 🏗️ New Construction
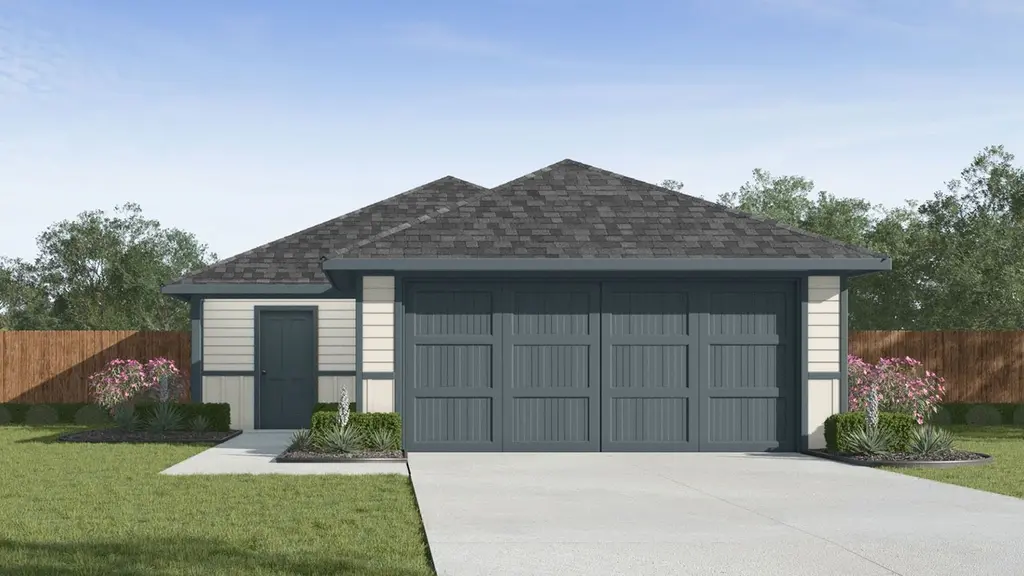
Barton Plan · Temple, TX
Flood risk No data
- FEMA flood zone
- —
- Chance of flooding over 30 yrs
- —
- Est. flood insurance / yr
- —
Fire risk No data
- Est. fire insurance / yr
- —
Heat risk No data
- Hot days now (above threshold)
- —
- Hot days in 30 yrs
- —
Wind risk No data
- Chance of severe wind over 30 yrs
- —
Air-quality risk No data
- Unhealthy air days now
- —
- Unhealthy air days in 30 yrs
- —
Risk factors via First Street. Map © Google.
Why this score? — see what drove the F grade
The composite is a weighted blend of 9 inputs, each scored 0–100. Each bar is that input's sub-score; the figure is the points it added to the 100-point composite (weight × sub-score).
- ARV discount +7.5/15.0
- Cash flow +7.0/30.0
- Condition / age +4.0/5.0
- Livability +3.8/5.0
- Schools +2.7/10.0
- Rent growth +2.3/5.0
- 1% rule +1.9/10.0
- DSCR +1.2/10.0
- Appreciation +0.0/10.0
$228,990
🖨 Deal sheet 📄 Offer letter ✓ Due diligence
Listing remarks MLS
Discover the Barton - a thoughtfully designed one-story floorplan in Pepper Creek Crossing community in Temple, TX. This inviting 3-bedroom, 2-bathroom home offers approximately 1,280 sq. ft. of comfortable living space with an open-concept layout that's perfect for both everyday living and entertaining. From the moment you step inside, you'll appreciate the welcoming ambiance and stylish features throughout. The heart of the home is the spacious kitchen, showcasing a large island, sleek stainless steel appliance, and plenty of room to gather. Just off the kitchen are two secondary bedroom and a full secondary bath. Tucked away near the back of the home, the private primary bedroom offers a peaceful retreat with its attached bathroom and a walk-in closet for all your storage needs. A 2-car garage provides ample space for vehicles and extra belongings, while built-in smart home technology ensures modern convenience at your fingertips. Make the Barton your new home and enjoy life in a community designed for comfort, style, and connection. Contact us today to learn more about living in Pepper Creek Crossing.
Key facts
- 2 garage spots
- Listed 69 days
Neighborhood map
What this means for you Summary
Snapshot
- This is a 3-bed/2.0-bath single-family listed at $229k. Condition is rated good.
Deal economics
- At list price, monthly cash flow is $-396 ($-5k/yr) — negative.
- To cash-flow at today's rent, offer at most $210k (8.1% below list).
- To meet the 1% rule (rent ≥ 1% of price), the offer needs to be $184k (19.6% below list).
- Recommended offer: $184k (19.6% below list) — sets the bar for 1% rule.
- Cap rate 4.5% vs local median 3.6% in Temple — meaningfully above typical; check what's discounted (condition, days-on-market, listing class) to confirm the premium yield is real.
Location & tenants
- Location reads 75/100 on livability (#122 in TX, #3,814 nationally) — a middle-class / working-renter tenant base. Strengths: cost of living A+, housing A+, health & safety A+; Watch: schools C-, commute C-, crime D+.
- Temple ISD (urban): math 32% / reading 31% proficiency, ranked #590 of 826 in TX (top 71%) — families likely to look elsewhere, expect single-tenant / working-renter base with shorter leases; 66% free/reduced lunch — lower-income household profile, screen leases tightly.
- Market conditions: Rents soft (-0.8%/yr); 1114 active listings in the ZIP; 40 comparable units currently listed for rent nearby; rentals at typical pace (median 24d on market — plan ~3-4 weeks tenant-placement turnaround); solid renter incomes; 3,222 units permitted in Bell County in 2024 (246 in 5+ unit buildings).
Forward outlook
- Local home prices are declining (-3.0%/yr); year-one equity from $2k of loan paydown is wiped out by about $8k of value loss. Plan a longer hold.
- Bell County population projected at +21% by 2050 — long-run rental-demand tailwind backs the buy-and-hold thesis.
Negotiation context
- It's been on market 69 days — a 6% lower offer ($215k) is reasonable based on typical stale-listing flexibility.
Questions for the listing agent
- What do current leases actually rent for vs. the listed asking? Can we see a recent rent roll and the last 12 months of T-12 income?
- It's been on market 69 days. Have you received any prior offers? Is the seller open to a 20% concession, seller financing, or rate buy-down credit?
- Why hasn't it sold? Are there any deal-killer items the seller is aware of (foundation, flood, title, zoning, code violations)?
- Is there a deadline driving the sale (1031 exchange, divorce, estate, relocation)? That informs how much negotiation room exists.
- Crime grade is D in this area — have there been break-ins, vandalism, or insurance claims at this property in the last 3 years? What carrier currently insures it and at what premium?
- The area grade is low — what's the realistic commute time and amenity access for the typical tenant pool here? Any planned neighborhood developments (good or bad) we should know about?
- What's the average days-on-market for RENTAL listings here right now (not sales)? A rising rental-DOM trend means longer vacancies and softer asking-rent achievability than the comps imply.
- What's the recent tenant-quality profile in this submarket — average credit score on applications, eviction rate, late-payment / NSF rate, and stable-employment percentage? A property-management company in the area should have these aggregated.
- How much new for-sale + rental construction is in the pipeline within 1–3 miles? Heavy new supply typically softens prices + rents 12–24 months out; constrained supply supports both.
Investment metrics
- 1% rule
- 0.69% ✗
- Cap rate
- 4.52%
- Cash-on-cash
- -6.34%
- DSCR
- 0.72
- GRM
- 12.1
CMA / ARV
- ARV (median comp)
- $267,750
- List price
- $228,990
- Delta
- -14.48%
- Verdict
- UNDERPRICED
- Comps
- 20 within 1.0 mi
Show comp detail 2 sales within ~0.75 mi
| Address | Dist | Beds/Ba | Sqft | Sold | Price | $/sf | Match |
|---|---|---|---|---|---|---|---|
| 4713 Fawn Valley Dr | 0.53mi | 3/2.0 | 1,418 (+11%) | 2mo | $255,000 | $180 | 56 |
| 1098 Spring Terrace Loop | 0.74mi | 3/2.0 | 1,400 (+9%) | 4mo | $245,000 | $175 | 46 |
Match score weights: distance 35% · size 25% · config 20% · recency 20%. Top-matched comps best support the ARV.
Projected returns pro-forma
-3.0% appreciation · 0.0% rent growth · sell at horizon
- IRR
- -30.6%
- Equity multiple
- 0.01×
- Total profit
- $-73,972
- Equity at exit
- $39,922
- IRR
- -52.7%
- Equity multiple
- -0.57×
- Total profit
- $-117,624
- Equity at exit
- $23,150
Cash invested: $74,970 (down + closing). Projections, not guarantees.
Landlord ↔ Tenant lean methodology
- Overall (STATE)
- 87 Strongly Landlord-Friendly
- State Texas
- 87 Strongly Landlord-Friendly · R+5
- County
- — inherits STATE
- City
- — inherits STATE
ZIP-level market 76502
- Rents YoY
- -0.8%
- Active inventory
- 1114
- Price-to-rent
- 10.4×
Monthly cashflow live
- Estimated rent
- $1,841 high interval (Pro) →
- Mortgage (P&I)
- −$1,404
- Tax est. 1.5%
- −$335 /mo · $4,016/yr
- Insurance
- −$112
- HOA
- −$0
- Vacancy / Maint / Mgmt
- −$387
- Net cashflow
- $-396
Break-even live
UW: 25.0% down · 7.5% · 30yr · 1.5% tax · 5.0% vac · 8.0% maint · 8.0% mgmt
Financing live
Cash to close
- Down payment
- $66,937
- Closing costs
- $8,032
- Reserves months
- —
- Total cash needed
- —
Loan-product check · same deal, 3 products live
Conventional
25% down · 7.5% · 30yr
- Down + closing
- —
- Monthly P&I
- —
- Monthly cashflow
- —
- DSCR
- —
- Eligible?
- —
Personal DTI + credit; lowest rate.
DSCR
20% down · 8.5% · 30yr
- Down + closing
- —
- Monthly P&I
- —
- Monthly cashflow
- —
- DSCR
- —
- Eligible?
- —
No personal income docs; deal must DSCR.
Hard money
10% down · 12.0% · 12mo
- Down + closing
- —
- Monthly P&I
- —
- Monthly cashflow
- —
- DSCR
- —
- Eligible?
- —
Short-term bridge; refi at stabilization.
Rent comps 40 comps
| Address | Beds | Baths | Sqft | Rent | $/sqft | DOM | Units | Dist |
|---|---|---|---|---|---|---|---|---|
| 7809 Montclair Dr Temple, TX | 4.0 | 2.0 | 1818 | $1,875 | $1.03 | 23d | 1 | 0.43mi |
| 1902 Bayou Wood Ln Temple, TX | 3.0 | 2.0 | 1517 | $1,795 | $1.18 | 13d | 1 | 0.45mi |
| 1938 Bayou Wood Ln Temple, TX | 3.0 | 2.0 | 1677 | $1,995 | $1.19 | 43d | 1 | 0.49mi |
| 8113 Northgate Loop Temple, TX | 3.0 | 2.0 | 1664 | $1,850 | $1.11 | 23d | 1 | 0.51mi |
| 1117 Lakeway Crossing Dr Temple, TX | 3.0 | 2.0 | 1418 | $1,675 | $1.18 | 43d | 1 | 0.58mi |
| 1245 Spring Terrace Loop Temple, TX | 3.0 | 2.0 | 1306 | $1,695 | $1.30 | 43d | 1 | 0.73mi |
| 1309 Juneberry Park Dr Temple, TX | 3.0 | 2.0 | 1565 | $1,695 | $1.08 | 13d | 1 | 0.85mi |
| 8428 Adelaide Dr Temple, TX | 3.0 | 2.5 | 1448 | $1,550 | $1.07 | 13d | 1 | 0.85mi |
| 2211 Hornbeam St Temple, TX | 3.0 | 2.0 | 1752 | $1,673 | $0.95 | 43d | 1 | 0.85mi |
| 2231 Hornbeam St Temple, TX | 4.0 | 2.0 | 1639 | $2,123 | $1.30 | 21d | 1 | 0.87mi |
| 748 Westfield Blvd Temple, TX | 3.0 | 2.5 | 1386 | $1,695 | $1.22 | 43d | 1 | 0.90mi |
| 740 Westfield Blvd Temple, TX | 2.0 | 2.5 | 1403 | $1,675 | $1.19 | 43d | 1 | 0.91mi |
| 8515 Chena Ridge Dr Temple, TX | 4.0 | 2.0 | 1700 | $2,100 | $1.24 | 13d | 1 | 0.92mi |
| 724 Westfield Blvd Temple, TX | 2.0 | 2.5 | 1403 | $1,675 | $1.19 | 23d | 1 | 0.93mi |
| 7305 Buffalo Grass Dr Temple, TX | 3.0 | 2.0 | 1329 | $1,650 | $1.24 | 43d | 1 | 0.94mi |
| 8118 Timber Hollow Ln Temple, TX | 3.0 | 2.0 | 1596 | $1,795 | $1.12 | 23d | 1 | 0.95mi |
| 516 Mercado St Temple, TX | 3.0 | 2.5 | 1467 | $1,670 | $1.14 | 43d | 1 | 0.95mi |
| 8112 Pineridge Way Temple, TX | 3.0 | 2.0 | 1580 | $1,895 | $1.20 | 43d | 1 | 0.97mi |
| 8015 Pineridge Way Temple, TX | 4.0 | 2.0 | 1700 | $1,850 | $1.09 | 43d | 1 | 0.98mi |
| 8614 Glade Dr Temple, TX | 4.0 | 2.0 | 1552 | $3,200 | $2.06 | 43d | 1 | 0.98mi |
| 7523 Buffalo Grass Dr Temple, TX | 3.0 | 2.0 | 1587 | $1,795 | $1.13 | 23d | 1 | 0.98mi |
| 917 Hollyhock Dr Temple, TX | 4.0 | 2.0 | 1600 | $1,900 | $1.19 | 13d | 1 | 1.00mi |
| 6611 Abode Ave Temple, TX | 1.0–3.0 | 1.0–2.0 | 983 | $1,920 | $1.95 | 13d | 34 | 1.03mi |
| 463 Westfield Blvd Temple, TX | 1.0–3.0 | 1.0–2.0 | 989 | $1,627 | $1.65 | 13d | 18 | 1.07mi |
| 531 Parkfield Ln Temple, TX | 3.0 | 2.0 | 1287 | $1,700 | $1.32 | 43d | 1 | 1.09mi |
| 3011 Wasilla Dr Temple, TX | 3.0 | 2.0 | 1361 | $1,695 | $1.25 | 21d | 1 | 1.11mi |
| 3004 Wasilla Dr Temple, TX | 3.0 | 2.0 | 1361 | $1,695 | $1.25 | 13d | 1 | 1.12mi |
| 619 Hollyhock Dr Temple, TX | 3.0 | 2.0 | 1443 | $1,800 | $1.25 | 13d | 1 | 1.13mi |
| 3111 Wasilla Dr Temple, TX | 3.0 | 2.0 | 1361 | $1,695 | $1.25 | 21d | 1 | 1.15mi |
| 3115 Wasilla Dr Temple, TX | 3.0 | 2.0 | 1361 | $1,695 | $1.25 | 21d | 1 | 1.16mi |
| 3112 Wasilla Dr Temple, TX | 3.0 | 2.0 | 1361 | $1,695 | $1.25 | 13d | 1 | 1.17mi |
| 3116 Wasilla Dr Temple, TX | 3.0 | 2.0 | 1361 | $1,695 | $1.25 | 21d | 1 | 1.18mi |
| 513 Fallbrook Dr Temple, TX | 3.0 | 2.0 | 1443 | $1,850 | $1.28 | 23d | 1 | 1.18mi |
| 3124 Wasilla Dr Temple, TX | 3.0 | 2.0 | 1361 | $1,695 | $1.25 | 13d | 1 | 1.19mi |
| 8012 Bridgepointe Dr Temple, TX | 3.0 | 2.0 | 1307 | $1,595 | $1.22 | 13d | 1 | 1.21mi |
| 8918 Night View Dr Temple, TX | 3.0 | 2.0 | 1506 | $1,649 | $1.09 | 23d | 1 | 1.21mi |
| 8419 Brahma Plains Rd Temple, TX | 3.0 | 2.0 | 1489 | $1,800 | $1.21 | 43d | 1 | 1.27mi |
| 1111 Porterhouse Rd Temple, TX | 3.0 | 2.0 | 1507 | $1,695 | $1.12 | 43d | 1 | 1.31mi |
| 1411 Amber Dawn Dr Temple, TX | 3.0 | 2.0 | 1621 | $1,745 | $1.08 | 43d | 1 | 1.32mi |
| 1411 Amber Dawn Dr Temple, TX | 3.0 | 2.0 | 1621 | $1,695 | $1.05 | 13d | 1 | 1.32mi |
Listing history 15 events
-
2026-06-18days on market $228,990 Active 69 DOM
-
2026-06-17days on market $228,990 Active 68 DOM
-
2026-06-16days on market $228,990 Active 67 DOM
-
2026-06-15days on market $228,990 Active 66 DOM
-
2026-06-14days on market $228,990 Active 64 DOM
-
2026-06-10days on market $228,990 Active 61 DOM
-
2026-06-09days on market $228,990 Active 60 DOM
-
2026-06-08days on market $228,990 Active 59 DOM
-
2026-06-07days on market $228,990 Active 58 DOM
-
2026-06-03days on market $228,990 Active 54 DOM
-
2026-06-02days on market $228,990 Active 53 DOM
-
2026-06-01days on market $228,990 Active 52 DOM
-
2026-05-31days on market $228,990 Active 51 DOM
-
2026-05-30days on market $228,990 Active 50 DOM
-
2026-04-10$228,990 Active 1122-char remark
Show marketing remark (1122 chars)
Discover the Barton - a thoughtfully designed one-story floorplan in Pepper Creek Crossing community in Temple, TX. This inviting 3-bedroom, 2-bathroom home offers approximately 1,280 sq. ft. of comfortable living space with an open-concept layout that's perfect for both everyday living and entertaining. From the moment you step inside, you'll appreciate the welcoming ambiance and stylish features throughout. The heart of the home is the spacious kitchen, showcasing a large island, sleek stainless steel appliance, and plenty of room to gather. Just off the kitchen are two secondary bedroom and a full secondary bath. Tucked away near the back of the home, the private primary bedroom offers a peaceful retreat with its attached bathroom and a walk-in closet for all your storage needs. A 2-car garage provides ample space for vehicles and extra belongings, while built-in smart home technology ensures modern convenience at your fingertips. Make the Barton your new home and enjoy life in a community designed for comfort, style, and connection. Contact us today to learn more about living in Pepper Creek Crossing.
ⓘ Source: listings_history table (triggers on properties + properties_extension) + one-shot
backfill from property_details.listing_events for pre-trigger history.
Nearby sold comps map
Loading sold comps map…
Walkable amenities ~0.75 mi
Loading nearby amenities…
Taxation est. · year 1
- Rental income
- $22,092
- − Mortgage interest
- −$14,998
- − Property taxes
- −$4,016
- − Insurance
- −$1,339
- − Repairs & maintenance
- −$1,767
- − Management
- −$1,767
- − Depreciation
- −$7,789
- Taxable loss
- −$9,585
- Est. tax savings @ 24.0%
- +$2,300
- After-tax cash flow
- $-2,451/yr
For passive investors: Depreciation is non-cash, so a rental often shows a tax loss while cash-flowing — sheltering income. Rental losses are passive: they offset passive income freely, and up to $25,000/yr can offset ordinary (W-2) income if you actively participate and your MAGI is under $100k (phasing out to $0 by $150k); unused losses carry forward. On sale, claimed depreciation is recaptured at up to 25%, and gains may owe capital-gains tax (a 1031 exchange can defer both). Figures are a year-1 estimate at your 24.0% rate — not tax advice; consult a CPA.
Condition & rehab AI · 13 photos
The home is in good condition with a modern kitchen and bathroom. It has a good exterior and flooring, and the interior walls are clean. The home is ready for a fresh coat of paint and some landscaping to enhance its curb appeal and value.
Value-add opportunities
- Both Paint exterior siding — Fresh paint can enhance curb appeal and property value.
- Both Landscaping — Well-maintained landscaping can improve curb appeal and attract potential buyers/tenants.
Renovation cost estimate screening
Value-add ROI direction
- Both Paint exterior siding — Fresh paint can enhance curb appeal and property value. ↑
- Both Landscaping — Well-maintained landscaping can improve curb appeal and attract potential buyers/tenants. ↑
ⓘ Cost ranges are severity-bucket heuristics (US national rule-of-thumb). Get contractor quotes + a written scope before underwriting a rehab budget.
Schools (NCES district)
- District
- Temple ISD
- NCES district ID
- 4842330
- Math proficiency
- 32% ▼ -8.00%
- Reading proficiency
- 31% ▼ -4.00%
- Median HH income
- $43,120
- Composite
- 26.8/100
- National rank
- #7123
- State rank
- #590 of 826 in TX
Livability — Temple
- Score
- 75/100
- State rank
- #122
- US rank
- #3814
Category grades
Schools grade is shown separately in the Schools card above.
Census & demographics
- Census place
- Temple, TX
- County
- Bell County · 345,090 people
- City population
- 96,587
- Metro
- Killeen-Temple, TX
- Population (ZIP)
- 52,669
- Household income
- $82,088
- Rent vs Own
- Severe rent burden
- 1890.0
Population outlook (Bell County) Hauer SSP2
- Today (2025)
- 371,114 people
- By 2030
- 389,104 · +4.8%
- By 2040
- 420,592 · +13.3%
- By 2050
- 447,779 · +20.7%
- By 2075
- 499,130 · +34.5%
- By 2100
- 505,680 · +36.3%
Race, ethnicity, and origin ACS 2023
- Neighborhood character
- Diverse neighborhood (Simpson 0.59)
- Race & ethnicity
- White 58% Hispanic / Latino 26% Two or more races 15% Black 9% Asian 3%
- Hispanic origin (detail)
- Mexican 21% Puerto Rican 2%
- Common ancestry
- Italian 2% Slovak 2% Serbian 1%
- Foreign-born
- 7% · Canada, South Korea, China
- Languages at home
- 86% English-only · Spanish 10% Other Indo-European 1% Korean 1%
Political lean MEDSL · Bell
- 2024 margin
- R (+16.2) · D 41.3% · R 57.6% · Other 1.1%
- 2008→2024 swing
- -6.5pp toward R · 2008: -9.8pp · 2024: -16.2pp
- All cycles
- 2024: R+16.2 2020: R+8.5 2016: R+15.1 2012: R+16.4 2008: R+9.8
Not yet ingested
- Civics
- —
Market trends
- HPI YoY
- ▼ -216.80%
- Current HPI
- 166.927
- Rent YoY
- ▼ -0.79%
- Metro
- Killeen-Temple, TX
- State GDP YoY
- ▲ 3.95%
- F500 in state
- 110
Industry mix (Fortune 500 HQ in TX)
| Industry | F500 HQs | Revenue |
|---|---|---|
| Energy | 16 | $1,198B |
|
||
| Technology | 5 | $198B |
|
||
| Engineering / Construction | 4 | $72B |
|
||
| Energy Services | 3 | $60B |
|
||
| Utilities | 3 | $41B |
|
||
| Healthcare | 2 | $330B |
|
||
Price history
1 event — show timeline
- 2026-04-10 Listed $228,990 Zillow
Cash-flow waterfall
monthlySold comps — $/sqft
last 12 mo · ≤1 miLoading sold comps…