1216 Janet Dr · Edgewood, MD
Flood risk No data
- FEMA flood zone
- —
- Chance of flooding over 30 yrs
- —
- Est. flood insurance / yr
- —
Fire risk No data
- Est. fire insurance / yr
- —
Heat risk No data
- Hot days now (above threshold)
- —
- Hot days in 30 yrs
- —
Wind risk No data
- Chance of severe wind over 30 yrs
- —
Air-quality risk No data
- Unhealthy air days now
- —
- Unhealthy air days in 30 yrs
- —
Risk factors via First Street. Map © Google.
Why this score? — see what drove the B+ grade
The composite is a weighted blend of 9 inputs, each scored 0–100. Each bar is that input's sub-score; the figure is the points it added to the 100-point composite (weight × sub-score).
- Cash flow +30.0/30.0
- ARV discount +15.0/15.0
- 1% rule +10.0/10.0
- DSCR +10.0/10.0
- Condition / age +3.8/5.0
- Rent growth +3.7/5.0
- Livability +3.7/5.0
- Schools +2.9/10.0
- Appreciation +0.0/10.0
$40,000
🖨 Deal sheet 📄 Offer letter ✓ Due diligence
Listing remarks
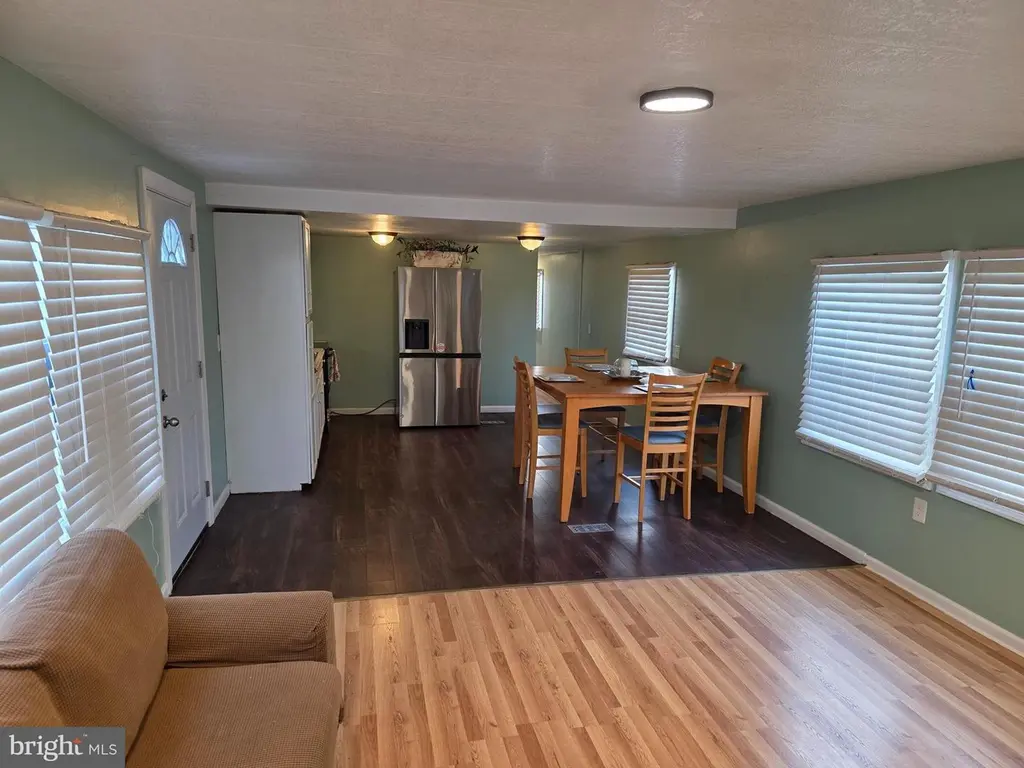
🏡 Charming Mobile Home in Harford Village – Edgewood, MD Welcome to this well-maintained mobile home located in the desirable Harford Village community! This cozy property features: 🛏️ 2 Bedrooms 🛁 1 Full Bathroom 🍽️ Spacious Kitchen 🛋️ Comfortable Living Room 🧺 Laundry Area The home offers an open layout with great natural light, a functional floor plan, and updated flooring throughout the main living areas. The kitchen flows nicely into the dining space, perfect for everyday living and entertaining. Conveniently located near shopping, dining, and major routes, making commuting easy.
Key facts
- Community pool
- Built 1981
- Listed 69 days
Neighborhood map
What this means for you Summary
Snapshot
- This is a 2-bed/1.0-bath single-family listed at $40k. Condition is rated good.
Deal economics
- At list price, monthly cash flow is $280 ($3k/yr) — positive.
- The deal already cash-flows at list — no discount required.
- Meets the 1% rule at list price ($2k rent vs $40k).
- Recommended offer: $38k (6.0% below list) — sets the bar for market timing.
- Cap rate 14.7% vs local median 5.5% in Edgewood — top-decile yield for the area; either an underpriced asset or a hidden risk that comps aren't pricing in. Stress-test before assuming the spread holds.
Location & tenants
- Location reads 73/100 on livability (#118 in MD, #4,991 nationally) — a middle-class / working-renter tenant base. Strengths: commute A+, housing A+, health & safety A+; Watch: schools D, amenities D, crime F.
- Harford County Public Schools (suburban): math 22% / reading 39% proficiency, ranked #9 of 24 in MD (top 38%) — families likely to look elsewhere, expect single-tenant / working-renter base with shorter leases.
- Market conditions: Rents rising fast (+4.9%/yr); 94 active listings in the ZIP; 5 comparable units currently listed for rent nearby; rentals lingering (median 44d on market — plan ~5-8 weeks vacancy on turnover, expect pricing pressure); 60% of comp listings sitting > 30 days — soft ceiling on asking rent; solid renter incomes; 803 units permitted in Harford County in 2024 (26 in 5+ unit buildings).
Forward outlook
- Local home prices are declining (-3.0%/yr); year-one equity from $277 of loan paydown is wiped out by about $1k of value loss. Plan a longer hold.
- At projected returns (-3.0% appreciation + 4.9% rent growth), your $11k cash investment doubles in ~4 years — after that, you're playing with house money.
Negotiation context
- It's been on market 69 days — a 6% lower offer ($38k) is reasonable based on typical stale-listing flexibility.
Risks & watch-outs
- Watch-outs: HOA is 45% of rent.
Questions for the listing agent
- It's been on market 69 days. Have you received any prior offers? Is the seller open to a 6% concession, seller financing, or rate buy-down credit?
- What does the HOA fee cover, when was the last increase, and are there any pending special assessments or reserve-fund shortfalls?
- Why hasn't it sold? Are there any deal-killer items the seller is aware of (foundation, flood, title, zoning, code violations)?
- Is there a deadline driving the sale (1031 exchange, divorce, estate, relocation)? That informs how much negotiation room exists.
- Schools are D-rated, which usually means shorter tenancies and higher turnover. Who's the typical renter profile here, and what's been the actual vacancy rate?
- Crime grade is F in this area — have there been break-ins, vandalism, or insurance claims at this property in the last 3 years? What carrier currently insures it and at what premium?
- What's the average days-on-market for RENTAL listings here right now (not sales)? A rising rental-DOM trend means longer vacancies and softer asking-rent achievability than the comps imply.
- What's the recent tenant-quality profile in this submarket — average credit score on applications, eviction rate, late-payment / NSF rate, and stable-employment percentage? A property-management company in the area should have these aggregated.
- How much new for-sale + rental construction is in the pipeline within 1–3 miles? Heavy new supply typically softens prices + rents 12–24 months out; constrained supply supports both.
Investment metrics
- 1% rule
- 4.14% ✓
- Cap rate
- 14.70%
- Cash-on-cash
- 30.04%
- DSCR
- 2.34
- GRM
- 2.0
CMA / ARV
- ARV (median comp)
- $50,465
- List price
- $40,000
- Delta
- -20.74%
- Verdict
- UNDERPRICED
- Comps
- 20 within 1.0 mi
Show comp detail 12 sales within ~0.75 mi
| Address | Dist | Beds/Ba | Sqft | Sold | Price | $/sf | Match |
|---|---|---|---|---|---|---|---|
| 1919 Chipper Dr | 0.02mi | 2/2.0 | 980 (0%) | 1mo | $66,000 | $67 | 94 |
| 1911 Chipper Dr | 0.04mi | 2/1.0 | 980 (0%) | 13mo | $27,000 | $28 | 87 |
| 1835 Steven Dr | 0.11mi | 2/1.0 | 975 (-0%) | 11mo | $44,000 | $45 | 85 |
| 1922 Steven Dr | 0.06mi | 2/1.5 | 980 (0%) | 16mo | $10,000 | $10 | 82 |
| 1833 Steven Dr | 0.12mi | 2/1.0 | 980 (0%) | 16mo | $65,000 | $66 | 81 |
| 1944 Chipper Dr | 0.07mi | 2/1.0 | 980 (0%) | 22mo | $59,000 | $60 | 79 |
| 1214 Janet | 0.01mi | 3/2.0 (+1) | 980 (0%) | 15mo | $60,000 | $61 | 78 |
| 1985 Chipper Dr | 0.20mi | 2/1.0 | 900 (-8%) | 15mo | $24,000 | $27 | 64 |
| 1957 Melvin Dr | 0.23mi | 3/2.0 (+1) | 910 (-7%) | 9mo | $61,000 | $67 | 61 |
| 1812 Steven Dr | 0.18mi | 3/2.0 (+1) | 1,056 (+8%) | 13mo | $72,000 | $68 | 59 |
| 1802 Sandee Ct | 0.16mi | 3/2.0 (+1) | 904 (-8%) | 14mo | $25,000 | $28 | 59 |
| 1862 John Dr | 0.08mi | 3/2.0 (+1) | 900 (-8%) | 23mo | $40,000 | $44 | 55 |
Match score weights: distance 35% · size 25% · config 20% · recency 20%. Top-matched comps best support the ARV.
Projected returns pro-forma
-3.0% appreciation · 4.92% rent growth · sell at horizon
- IRR
- 30.2%
- Equity multiple
- 2.35×
- Total profit
- $15,121
- Equity at exit
- $5,964
- IRR
- 40.0%
- Equity multiple
- 5.65×
- Total profit
- $52,056
- Equity at exit
- $3,458
Cash invested: $11,200 (down + closing). Projections, not guarantees.
Landlord ↔ Tenant lean methodology
- Overall (STATE)
- 27 Tenant-Leaning
- State Maryland
- 27 Tenant-Leaning · D+14
- County
- — inherits STATE
- City
- — inherits STATE
ZIP-level market 21040
- Home prices YoY
- -29.4%
- Rents YoY
- 4.9%
- Active inventory
- 94
- Price-to-rent
- 2.0×
Monthly cashflow live
- Estimated rent
- $1,657 high interval (Pro) →
- Mortgage (P&I)
- −$210
- Tax est. 1.5%
- −$50 /mo · $600/yr
- Insurance
- −$17
- HOA
- −$752
- Vacancy / Maint / Mgmt
- −$348
- Net cashflow
- $280
Break-even live
UW: 25.0% down · 7.5% · 30yr · 1.5% tax · 5.0% vac · 8.0% maint · 8.0% mgmt
Financing live
Cash to close
- Down payment
- $10,000
- Closing costs
- $1,200
- Reserves months
- —
- Total cash needed
- —
Loan-product check · same deal, 3 products live
Conventional
25% down · 7.5% · 30yr
- Down + closing
- —
- Monthly P&I
- —
- Monthly cashflow
- —
- DSCR
- —
- Eligible?
- —
Personal DTI + credit; lowest rate.
DSCR
20% down · 8.5% · 30yr
- Down + closing
- —
- Monthly P&I
- —
- Monthly cashflow
- —
- DSCR
- —
- Eligible?
- —
No personal income docs; deal must DSCR.
Hard money
10% down · 12.0% · 12mo
- Down + closing
- —
- Monthly P&I
- —
- Monthly cashflow
- —
- DSCR
- —
- Eligible?
- —
Short-term bridge; refi at stabilization.
Rent comps 5 comps
| Address | Beds | Baths | Sqft | Rent | $/sqft | DOM | Units | Dist |
|---|---|---|---|---|---|---|---|---|
| 1772 Judy Way Edgewood, MD | 3.0 | 1.5 | 1040 | $2,195 | $2.11 | 43d | 1 | 0.41mi |
| 905 Swallow Crest Ct Unit E Edgewood, MD | 2.0 | 1.0 | 990 | $1,495 | $1.51 | 43d | 1 | 0.57mi |
| 1703 Fountain Rock Way Unit 1703-B Edgewood, MD | 2.0 | 1.0 | 882 | $1,250 | $1.42 | 23d | 1 | 0.64mi |
| 814 Windstream Way Unit 814-A Edgewood, MD | 1.0 | 1.0 | 882 | $1,200 | $1.36 | 43d | 1 | 0.86mi |
| 802 Kingston Ct Edgewood, MD | 1.0–3.0 | 1.0–1.5 | 1007 | $1,660 | $1.65 | 1d | 15 | 0.99mi |
HOA detail
- Monthly dues
- $752 · $9,024/yr
Listing history 14 events
-
2026-06-18days on market $40,000 Active 69 DOM
-
2026-06-17days on market $40,000 Active 68 DOM
-
2026-06-16days on market $40,000 Active 67 DOM
-
2026-06-15days on market $40,000 Active 66 DOM
-
2026-06-13days on market $40,000 Active 64 DOM
-
2026-06-09days on market $40,000 Active 60 DOM
-
2026-06-08days on market $40,000 Active 59 DOM
-
2026-06-07days on market $40,000 Active 58 DOM
-
2026-06-04days on market $40,000 Active 55 DOM
-
2026-06-03days on market $40,000 Active 54 DOM
-
2026-06-02days on market $40,000 Active 53 DOM
-
2026-06-01days on market $40,000 Active 52 DOM
-
2026-05-31days on market $40,000 Active 51 DOM
-
2026-04-10$40,000 Active
ⓘ Source: listings_history table (triggers on properties + properties_extension) + one-shot
backfill from property_details.listing_events for pre-trigger history.
Nearby sold comps map
Loading sold comps map…
Walkable amenities ~0.75 mi
Loading nearby amenities…
Taxation est. · year 1
- Rental income
- $19,880
- − Mortgage interest
- −$2,241
- − Property taxes
- −$600
- − Insurance
- −$200
- − Repairs & maintenance
- −$1,590
- − Management
- −$1,590
- − HOA
- −$9,024
- − Depreciation
- −$1,164
- Taxable income
- $3,471
- Est. tax owed @ 24.0%
- −$833
- After-tax cash flow
- $2,531/yr
For passive investors: Depreciation is non-cash, so a rental often shows a tax loss while cash-flowing — sheltering income. Rental losses are passive: they offset passive income freely, and up to $25,000/yr can offset ordinary (W-2) income if you actively participate and your MAGI is under $100k (phasing out to $0 by $150k); unused losses carry forward. On sale, claimed depreciation is recaptured at up to 25%, and gains may owe capital-gains tax (a 1031 exchange can defer both). Figures are a year-1 estimate at your 24.0% rate — not tax advice; consult a CPA.
Condition & rehab AI · 3 photos
This charming mobile home in Edgewood, MD is well-maintained and ready for a new owner. It features updated flooring, modern appliances, and fresh paint, making it move-in ready.
Value-add opportunities
- Both Painting exterior and interior walls — Fresh paint enhances curb appeal and interior aesthetics.
- Both Landscaping and curb appeal improvements — Enhances curb appeal and can attract more potential buyers or renters.
- Both Upgrading light fixtures — Modernizes the space and improves energy efficiency.
- Both Adding smart home features — Enhances convenience and can increase property value in the future.
Renovation cost estimate screening
Value-add ROI direction
- Both Painting exterior and interior walls — Fresh paint enhances curb appeal and interior aesthetics. ↑
- Both Landscaping and curb appeal improvements — Enhances curb appeal and can attract more potential buyers or renters. ↑
- Both Upgrading light fixtures — Modernizes the space and improves energy efficiency. ↑
- Both Adding smart home features — Enhances convenience and can increase property value in the future. ↑
ⓘ Cost ranges are severity-bucket heuristics (US national rule-of-thumb). Get contractor quotes + a written scope before underwriting a rehab budget.
Schools (NCES district)
- District
- Harford County Public Schools
- NCES district ID
- 2400390
- Math proficiency
- 22% ▼ -23.00%
- Reading proficiency
- 39% ▼ -12.00%
- Median HH income
- $79,569
- Composite
- 29.38/100
- National rank
- #6527
- State rank
- #9 of 24 in MD
Livability — Edgewood
- Score
- 73/100
- State rank
- #118
- US rank
- #4991
Category grades
Schools grade is shown separately in the Schools card above.
Census & demographics
- Census place
- Edgewood, MD
- County
- Harford County · 198,512 people
- City population
- 24,960
- Metro
- Baltimore-Columbia-Towson, MD
- Population (ZIP)
- 24,960
- Household income
- $81,704
- Rent vs Own
- Severe rent burden
- 859.0
Population outlook (Harford County) Hauer SSP2
- Today (2025)
- 262,292 people
- By 2030
- 266,437 · +1.6%
- By 2040
- 269,954 · +2.9%
- By 2050
- 265,659 · +1.3%
- By 2075
- 252,886 · -3.6%
- By 2100
- 224,014 · -14.6%
Race, ethnicity, and origin ACS 2023
- Neighborhood character
- Diverse neighborhood (Simpson 0.66)
- Race & ethnicity
- Black 45% White 36% Two or more races 11% Hispanic / Latino 10% Asian 2%
- Hispanic origin (detail)
- Mexican 1% Puerto Rican 2%
- Common ancestry
- Romanian 4% Slovak 1% Italian 1%
- Foreign-born
- 8% · Canada, South Korea
- Languages at home
- 89% English-only · Spanish 5% Russian/Polish/Slavic 2% German/W. Germanic 1%
Political lean MEDSL · Harford
- 2024 margin
- R (+13.8) · D 41.9% · R 55.7% · Other 2.4%
- 2008→2024 swing
- +5.0pp toward D · 2008: -18.8pp · 2024: -13.8pp
- All cycles
- 2024: R+13.8 2020: R+12.0 2016: R+24.5 2012: R+19.5 2008: R+18.8
Not yet ingested
- Civics
- —
Market trends
- HPI YoY
- ▼ -106.14%
- Current HPI
- 254.2305
- Rent YoY
- ▲ 4.92%
- Metro
- Baltimore-Columbia-Towson, MD
- State GDP YoY
- ▲ 2.97%
- F500 in state
- 12
Industry mix (Fortune 500 HQ in MD)
| Industry | F500 HQs | Revenue |
|---|---|---|
| Aerospace / Defense | 1 | $71B |
|
||
| Utilities | 1 | $25B |
|
||
| Hotels | 1 | $24B |
|
||
| Consumer Goods | 1 | $7B |
|
||
| Real Estate | 1 | $6B |
|
||
| Chemicals | 1 | $2B |
|
||
Price history
1 event — show timeline
- 2026-04-10 Listed $40,000 BRIGHT MLS
Cash-flow waterfall
monthlySold comps — $/sqft
last 12 mo · ≤1 miLoading sold comps…