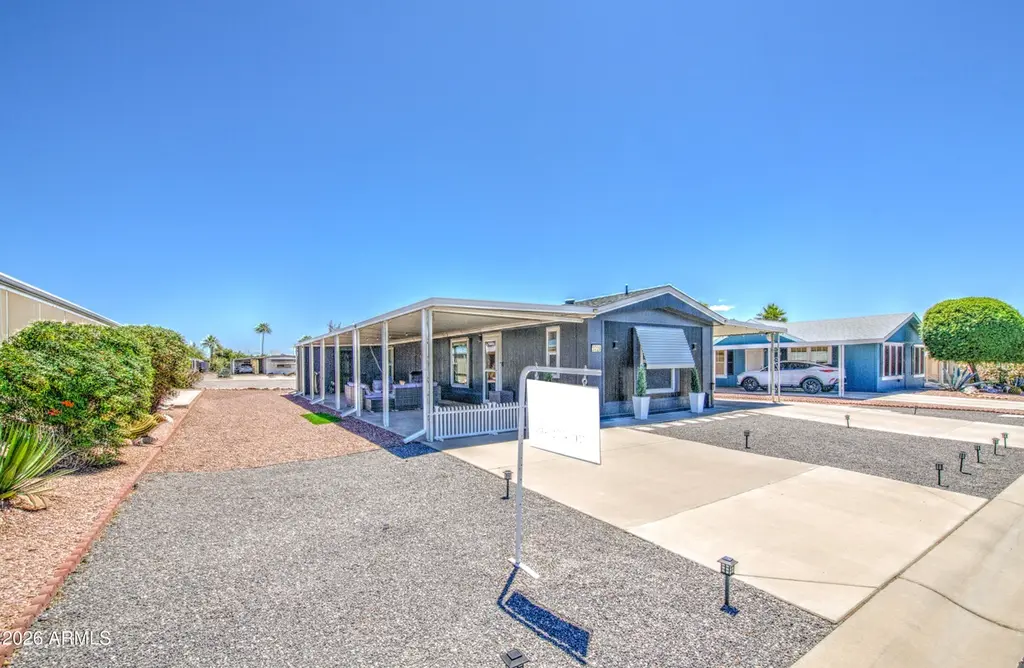
3729 N Minnesota Ave · Florence, AZ
Flood risk 1/10 · Minimal
- FEMA flood zone
- X (unshaded)
- Chance of flooding over 30 yrs
- 0.0%
- Est. flood insurance / yr
- $507 – $1,088
Fire risk 5/10 · Moderate
- Est. fire insurance / yr
- $610 – $1,132
Heat risk 8/10 · Major
- Hot days now (above 112°F)
- 5 days/yr
- Hot days in 30 yrs
- 14 days/yr
Wind risk 1/10 · Minimal
- Chance of severe wind over 30 yrs
- —
Air-quality risk 2/10 · Minimal
- Unhealthy air days now
- 0 days/yr
- Unhealthy air days in 30 yrs
- 1 days/yr
Risk factors via First Street. Map © Google.
Why this score? — see what drove the D- grade
The composite is a weighted blend of 9 inputs, each scored 0–100. Each bar is that input's sub-score; the figure is the points it added to the 100-point composite (weight × sub-score).
- Cash flow +15.3/30.0
- DSCR +4.7/10.0
- ARV discount +3.7/15.0
- 1% rule +3.2/10.0
- Livability +3.0/5.0
- Rent growth +2.8/5.0
- Condition / age +2.5/5.0
- Schools +1.8/10.0
- Appreciation +0.0/10.0
$178,871
🖨 Deal sheet 📄 Offer letter ✓ Due diligence
Listing remarks MLS
Water/Sewer Assessment NOT paid. A very clean late-model mobile home in a very active 55+ park. 2 carports makes for plenty of parking, and two storage sheds taped & textured. Golf course and clubhouse available. San Carlos Irrigation electric. Buyer or Buyer's agent to verify all info.
Key facts
- 5,087 sq ft lot
- 4 parking spots
- Community pool
Property features AI
Finance
- Other: Lot size per assessor: 5,087 sq ft
- Financial info: Annual tax information available
- HOA & community: Community association with annual fee; Association fee $605 annually; Association covers grounds maintenance and street maintenance; No visible truck/trailer/RV/boat allowed; Community amenities: pool, golf, pickleball, community spa (heated), community media room, tennis courts, fitness center
Exterior
- Parking: 2 covered parking spaces; 2 open parking spaces; 2 carport spaces
- Utilities: City water; Public sewer
- Home design: Manufactured/mobile home; Fee simple ownership; Desert view; Asphalt road surface
- Construction: Wood siding and wood frame construction; Painted exterior; Composition roof; Building area per assessor
- Exterior features: Private street; Private yard; Shed(s); Storage; Gravel/stone front and back; City-maintained road
Interior
- Kitchen: Built-in microwave; Laminate counters; Refrigerator; Disposal
- Bedrooms: 2 possible bedrooms
- Flooring: Vinyl
- Bathrooms: 2 full bathrooms (total 2)
- Heating & cooling: Heat pump heating; Heat pump cooling; Central air
- Interior features: High-speed internet available; Eat-in kitchen; Furnished (see remarks); 3/4 bath in master bedroom; Laminate counters; Dual-pane windows; Storage
- Laundry & utility: Laundry inside
Neighborhood map
What this means for you Summary
Snapshot
- This is a 2-bed/2.0-bath manufactured listed at $179k.
Deal economics
- At list price, monthly cash flow is $67 ($801/yr) — positive.
- The deal already cash-flows at list — no discount required.
- To meet the 1% rule (rent ≥ 1% of price), the offer needs to be $147k (17.7% below list).
- Recommended offer: $147k (17.7% below list) — sets the bar for 1% rule.
- Cap rate 6.7% vs local median 4.2% in Florence — top-decile yield for the area; either an underpriced asset or a hidden risk that comps aren't pricing in. Stress-test before assuming the spread holds.
Location & tenants
- Location reads 60/100 on livability (#187 in AZ) — a middle-class / working-renter tenant base. Strengths: crime A+, cost of living A+, housing A+; Watch: schools F, amenities F, commute F.
- Florence Unified School District (4437) (rural): math 16% / reading 24% proficiency, ranked #178 of 249 in AZ (top 72%) — low school quality limits family demand, transient renter base, plan for 1-2y turnover.
- Market conditions: Rents rising (+1.3%/yr); 714 active listings in the ZIP; 2 comparable units currently listed for rent nearby; solid renter incomes; 9,504 units permitted in Pinal County in 2024 (776 in 5+ unit buildings).
Forward outlook
- Local home prices are declining (-3.0%/yr); year-one equity from $1k of loan paydown is wiped out by about $5k of value loss. Plan a longer hold.
Negotiation context
- Only 11 days on market — expect competitive offers; lowballing is unlikely to land.
- 3 sale attempts since 24y ago with the ask held roughly flat each time — persistent listings suggest the price (not the market) is what's stuck; bring a comps-based counter.
- Current owner paid $140k; 28% above their basis — modest negotiation headroom, anchor on the comps not their cost.
Risks & watch-outs
- Climate carrying-cost: moderate wildfire risk; extreme-heat days projected 5→14/yr by 2055 (HVAC capex compounding) — expect insurance premiums to compound above CPI over the hold.
Questions for the listing agent
- What does the HOA fee cover, when was the last increase, and are there any pending special assessments or reserve-fund shortfalls?
- Is there a deadline driving the sale (1031 exchange, divorce, estate, relocation)? That informs how much negotiation room exists.
- Schools are F-rated, which usually means shorter tenancies and higher turnover. Who's the typical renter profile here, and what's been the actual vacancy rate?
- The area grade is low — what's the realistic commute time and amenity access for the typical tenant pool here? Any planned neighborhood developments (good or bad) we should know about?
- What's the average days-on-market for RENTAL listings here right now (not sales)? A rising rental-DOM trend means longer vacancies and softer asking-rent achievability than the comps imply.
- What's the recent tenant-quality profile in this submarket — average credit score on applications, eviction rate, late-payment / NSF rate, and stable-employment percentage? A property-management company in the area should have these aggregated.
- How much new for-sale + rental construction is in the pipeline within 1–3 miles? Heavy new supply typically softens prices + rents 12–24 months out; constrained supply supports both.
Investment metrics
- 1% rule
- 0.82% ✗
- Cap rate
- 6.74%
- Cash-on-cash
- 1.60%
- DSCR
- 1.07
- GRM
- 10.1
CMA / ARV
- ARV (median comp)
- $165,000
- List price
- $178,871
- Delta
- 8.41%
- Verdict
- FAIR
- Comps
- 17 within 1.0 mi
Show comp detail 12 sales within ~0.75 mi
| Address | Dist | Beds/Ba | Sqft | Sold | Price | $/sf | Match |
|---|---|---|---|---|---|---|---|
| 3614 N Ohio Ave | 0.25mi | 3/2.0 (+1) | 961 (+0%) | 2mo | $165,000 | $172 | 81 |
| 3717 N Illinois Ave | 0.26mi | 2/2.0 | 925 (-4%) | 3mo | $119,900 | $130 | 79 |
| 307 E Cholla Ln | 0.41mi | 2/2.0 | 955 (-0%) | 2mo | $155,000 | $162 | 78 |
| 3806 N Iowa Ave | 0.15mi | 2/2.0 | 1,040 (+8%) | 6mo | $184,500 | $177 | 74 |
| 810 E Mississippi St | 0.39mi | 3/2.0 (+1) | 985 (+3%) | 4mo | $199,000 | $202 | 69 |
| 3814 N Iowa Ave | 0.17mi | 2/2.5 | 1,024 (+7%) | 14mo | $240,000 | $234 | 67 |
| 3701 N Ohio Ave | 0.24mi | 2/1.5 | 855 (-11%) | 3mo | $155,000 | $181 | 66 |
| 3604 N North Dakota Ave | 0.27mi | 2/2.0 | 1,057 (+10%) | 10mo | $180,000 | $170 | 62 |
| 3609 N Minnesota Ave | 0.24mi | 2/2.0 | 1,057 (+10%) | 17mo | $175,000 | $166 | 58 |
| 3601 N Wisconsin Ave | 0.35mi | 2/1.0 | 897 (-7%) | 14mo | $90,000 | $100 | 57 |
| 3611 N Colorado Ave | 0.42mi | 2/2.0 | 1,057 (+10%) | 11mo | $173,000 | $164 | 54 |
| 3815 N Illinois Ave | 0.28mi | 3/3.0 (+1) | 1,089 (+13%) | 3mo | $195,000 | $179 | 53 |
Match score weights: distance 35% · size 25% · config 20% · recency 20%. Top-matched comps best support the ARV.
Projected returns pro-forma
-3.0% appreciation · 1.27% rent growth · sell at horizon
- IRR
- -15.5%
- Equity multiple
- 0.45×
- Total profit
- $-27,313
- Equity at exit
- $26,670
- IRR
- -10.0%
- Equity multiple
- 0.43×
- Total profit
- $-28,547
- Equity at exit
- $15,465
Cash invested: $50,084 (down + closing). Projections, not guarantees.
Landlord ↔ Tenant lean methodology
- Overall (STATE)
- 87 Strongly Landlord-Friendly
- State Arizona
- 87 Strongly Landlord-Friendly · R+3
- County
- — inherits STATE
- City
- — inherits STATE
ZIP-level market 85132
- Home prices YoY
- -5.2%
- Rents YoY
- 1.3%
- Active inventory
- 714
- Price-to-rent
- 10.1×
Monthly cashflow live
- Estimated rent
- $1,472 medium interval (Pro) →
- Mortgage (P&I)
- −$938
- Tax from tax record
- −$33 /mo · $398/yr
- Insurance
- −$75
- HOA
- −$50
- Vacancy / Maint / Mgmt
- −$309
- Net cashflow
- $67
Break-even live
UW: 25.0% down · 7.5% · 30yr · 1.5% tax · 5.0% vac · 8.0% maint · 8.0% mgmt
Financing live
Cash to close
- Down payment
- $44,718
- Closing costs
- $5,366
- Reserves months
- —
- Total cash needed
- —
Loan-product check · same deal, 3 products live
Conventional
25% down · 7.5% · 30yr
- Down + closing
- —
- Monthly P&I
- —
- Monthly cashflow
- —
- DSCR
- —
- Eligible?
- —
Personal DTI + credit; lowest rate.
DSCR
20% down · 8.5% · 30yr
- Down + closing
- —
- Monthly P&I
- —
- Monthly cashflow
- —
- DSCR
- —
- Eligible?
- —
No personal income docs; deal must DSCR.
Hard money
10% down · 12.0% · 12mo
- Down + closing
- —
- Monthly P&I
- —
- Monthly cashflow
- —
- DSCR
- —
- Eligible?
- —
Short-term bridge; refi at stabilization.
Rent comps 2 comps
| Address | Beds | Baths | Sqft | Rent | $/sqft | DOM | Units | Dist |
|---|---|---|---|---|---|---|---|---|
| 3722 N South Dakota Ave Florence, AZ | 1.0 | 1.0 | 721 | $1,100 | $1.53 | 44d | 1 | 0.10mi |
| 308 Lancaster Ct Unit 1 Florence, AZ | 2.0 | 1.0 | 841 | $1,295 | $1.54 | 44d | 1 | 0.34mi |
HOA detail
- Monthly dues
- $50 · $600/yr
- Likely covers
- watersewerelectric
Listing history 11 events
-
2026-05-18status Pending 799-char remark
-
2026-05-09status Active 799-char remark
-
2026-05-09price $178,871 799-char remark
-
2026-05-03historical 799-char remark
-
2026-05-01$178,888 Active 799-char remark
-
2024-12-26soldstatus $140,000
-
2006-12-05soldstatus $89,500
-
2003-05-01soldstatus $47,000
-
2003-04-30soldstatus $47,000 291-char remark
Show marketing remark (291 chars)
Water/Sewer Assessment NOT paid. A very clean late-model mobile home in a very active 55+ park. 2 carports makes for plenty of parking, and two storage sheds taped & textured. Golf course and clubhouse available. San Carlos Irrigation electric. Buyer or Buyer's agent to verify all info.
-
2003-03-28historical 291-char remark
Show marketing remark (291 chars)
Water/Sewer Assessment NOT paid. A very clean late-model mobile home in a very active 55+ park. 2 carports makes for plenty of parking, and two storage sheds taped & textured. Golf course and clubhouse available. San Carlos Irrigation electric. Buyer or Buyer's agent to verify all info.
-
2002-11-26$49,500 291-char remark
Show marketing remark (291 chars)
Water/Sewer Assessment NOT paid. A very clean late-model mobile home in a very active 55+ park. 2 carports makes for plenty of parking, and two storage sheds taped & textured. Golf course and clubhouse available. San Carlos Irrigation electric. Buyer or Buyer's agent to verify all info.
ⓘ Source: listings_history table (triggers on properties + properties_extension) + one-shot
backfill from property_details.listing_events for pre-trigger history.
Tax reassessment forecast AZ · Resets to sale price
- Current annual tax
- $398 · $33/mo
- Projected year-2 tax
- $1,181 · $98/mo
- Expected delta
- +$783/yr (+$65/mo · 196.7%)
ⓘ Screening estimate from a state-policy table — verify with the county assessor before closing.
Climate risk First Street
- Flood 1/10 Low FEMA zone X (unshaded) · 0% chance over 30 yrs
- Wildfire 5/10 Major
- Heat 8/10 Severe 5 d/yr ≥112°F today · 14 d/yr by 30 yrs out
- Wind 1/10 Low
- Air quality 2/10 Low 0 unhealthy d/yr today · 1 by 30 yrs out
Nearby sold comps map
Loading sold comps map…
Walkable amenities ~0.75 mi
Loading nearby amenities…
Taxation est. · year 1
- Rental income
- $17,658
- − Mortgage interest
- −$10,020
- − Property taxes
- −$398
- − Insurance
- −$894
- − Repairs & maintenance
- −$1,413
- − Management
- −$1,413
- − HOA
- −$600
- − Depreciation
- −$5,204
- Taxable loss
- −$2,282
- Est. tax savings @ 24.0%
- +$548
- After-tax cash flow
- $1,349/yr
For passive investors: Depreciation is non-cash, so a rental often shows a tax loss while cash-flowing — sheltering income. Rental losses are passive: they offset passive income freely, and up to $25,000/yr can offset ordinary (W-2) income if you actively participate and your MAGI is under $100k (phasing out to $0 by $150k); unused losses carry forward. On sale, claimed depreciation is recaptured at up to 25%, and gains may owe capital-gains tax (a 1031 exchange can defer both). Figures are a year-1 estimate at your 24.0% rate — not tax advice; consult a CPA.
Schools (NCES district)
- District
- Florence Unified School District (4437)
- NCES district ID
- 0402920
- Math proficiency
- 16% ▼ -11.00%
- Reading proficiency
- 24% ▼ -7.00%
- Median HH income
- $54,426
- Composite
- 18.31/100
- National rank
- #8950
- State rank
- #178 of 249 in AZ
Livability — Florence
- Score
- 60/100
- State rank
- #187
- US rank
- #19483
Category grades
Schools grade is shown separately in the Schools card above.
Census & demographics
- Census place
- Florence, AZ
- County
- Pinal County · 399,947 people
- City population
- 38,671
- Metro
- Phoenix-Mesa-Chandler, AZ
- Population (ZIP)
- 38,671
- Household income
- $79,000
- Rent vs Own
- Severe rent burden
- 102.0
Population outlook (Pinal County) Hauer SSP2
- Today (2025)
- 437,574 people
- By 2030
- 446,903 · +2.1%
- By 2040
- 452,589 · +3.4%
- By 2050
- 444,126 · +1.5%
- By 2075
- 430,300 · -1.7%
- By 2100
- 393,536 · -10.1%
Race, ethnicity, and origin ACS 2023
- Neighborhood character
- Diverse neighborhood (Simpson 0.56)
- Race & ethnicity
- White 59% Hispanic / Latino 28% Two or more races 9% Black 7% Native American 3%
- Hispanic origin (detail)
- Mexican 23%
- Common ancestry
- Italian 5% Portuguese 2% Romanian 2%
- Foreign-born
- 9% · Canada
- Languages at home
- 79% English-only · Spanish 17% German/W. Germanic 1% Russian/Polish/Slavic 1%
Political lean MEDSL · Pinal
- 2024 margin
- Strong R (+22.1) · D 38.5% · R 60.6%
- 2008→2024 swing
- -7.6pp toward R · 2008: -14.5pp · 2024: -22.1pp
- All cycles
- 2024: R+22.1 2020: R+17.3 2016: R+19.3 2012: R+17.1 2008: R+14.5
Not yet ingested
- Civics
- —
Market trends
- HPI YoY
- ▼ -12.75%
- Current HPI
- 233.6644
- Rent YoY
- ▲ 1.27%
- Metro
- Phoenix-Mesa-Chandler, AZ
- State GDP YoY
- ▲ 4.54%
- F500 in state
- 20
Industry mix (Fortune 500 HQ in AZ)
| Industry | F500 HQs | Revenue |
|---|---|---|
| Technology | 2 | $13B |
|
||
| Mining / Metals | 1 | $23B |
|
||
| Environmental Services | 1 | $16B |
|
||
| Metals / Steel | 1 | $14B |
|
||
| Technology Distribution | 1 | $9B |
|
||
| Homebuilding | 1 | $8B |
|
||
Price history
+261.4% since first listed11 events — show timeline
- 2026-05-18 Pending — ARMLS
- 2026-05-09 Relisted — ARMLS
- 2026-05-09 Price Changed $178,871 ARMLS
- 2026-05-03 Listing Removed — ARMLS
- 2026-05-01 Listed $178,888 ARMLS
- 2024-12-26 Sold (Public Records) $140,000 Public Records
- 2006-12-05 Sold (Public Records) $89,500 Public Records
- 2003-05-01 Sold (Public Records) $47,000 Public Records
- 2003-04-30 Sold (MLS) $47,000 ARMLS
- 2003-03-28 Listing Removed — ARMLS
- 2002-11-26 Listed $49,500 ARMLS
Property tax history
-2.6%/yrLatest (2025): $398 · -10.3% YoY. Source: county tax records.
Cash-flow waterfall
monthlySold comps — $/sqft
last 12 mo · ≤1 miLoading sold comps…