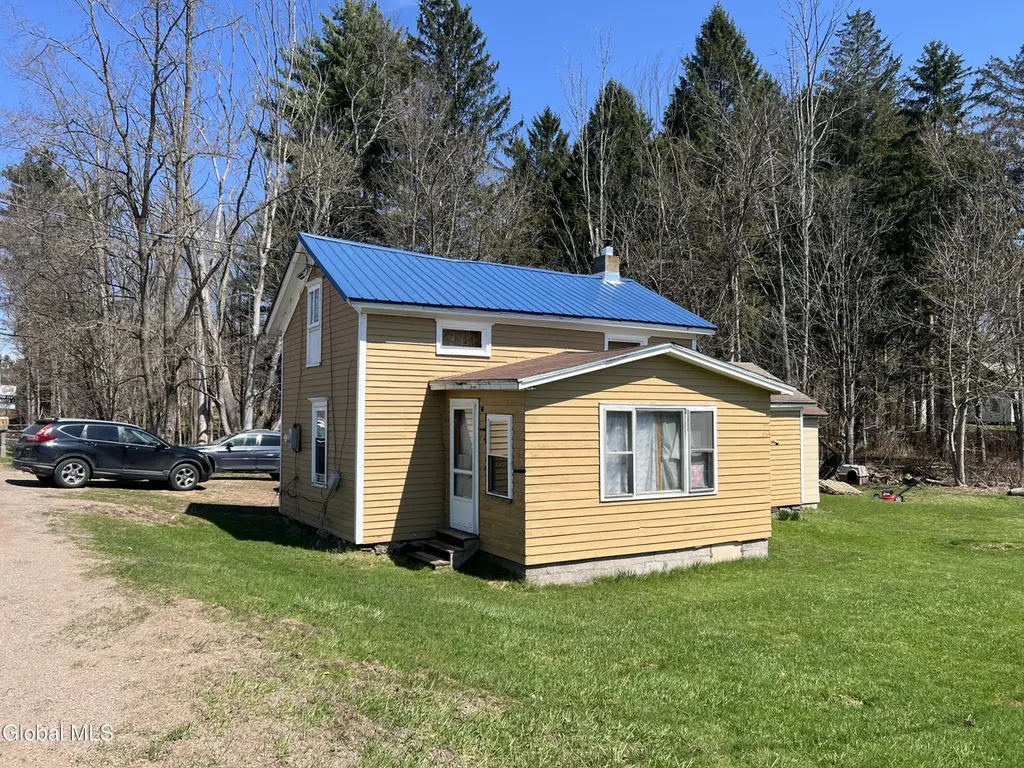
7492 Mill Rd · North Bay, NY
Flood risk 7/10 · Major
- FEMA flood zone
- AE
- Chance of flooding over 30 yrs
- 0.78%
- Est. flood insurance / yr
- $1,737 – $8,500
Fire risk 3/10 · Minor
- Est. fire insurance / yr
- $691 – $1,283
Heat risk 3/10 · Minor
- Hot days now (above 94°F)
- 7 days/yr
- Hot days in 30 yrs
- 16 days/yr
Wind risk 1/10 · Minimal
- Chance of severe wind over 30 yrs
- —
Air-quality risk 2/10 · Minimal
- Unhealthy air days now
- 1 days/yr
- Unhealthy air days in 30 yrs
- 1 days/yr
Risk factors via First Street. Map © Google.
Why this score? — see what drove the B+ grade
The composite is a weighted blend of 9 inputs, each scored 0–100. Each bar is that input's sub-score; the figure is the points it added to the 100-point composite (weight × sub-score).
- Cash flow +30.0/30.0
- 1% rule +10.0/10.0
- DSCR +10.0/10.0
- Appreciation +10.0/10.0
- ARV discount +7.5/15.0
- Schools +3.5/10.0
- Rent growth +2.5/5.0
- Livability +2.5/5.0
- Condition / age +2.5/5.0
$41,900
🖨 Deal sheet (PDF) 📄 Offer letter ✓ Due diligence
Listing remarks MLS
Opportunity awaits! This 2BD/1BA single-family home with views of Oneida Lake and a creek in the backyard is ready for a full transformation. The property is a complete gut renovation--perfect for a buyer looking to create a custom retreat or an investor targeting the seasonal rental market. Priced to reflect the work needed, there's strong ARV potential and plenty of room to add value. 30 minutes to Turning Stone Casino.
Key facts
- Views of oneida lake
- Strong arv potential
- 0.27 acre lot
Tags
Neighborhood map
What this means for you Summary
Snapshot
- This is a 2-bed/1.0-bath single-family listed at $42k.
Deal economics
- At list price, monthly cash flow is $199 ($2k/yr) — positive.
- The deal already cash-flows at list — no discount required.
- Meets the 1% rule at list price ($1k rent vs $42k).
- Recommended offer: $39k (6.0% below list) — sets the bar for market timing.
Location & tenants
- Location reads: area grade B — affects rentability + tenant quality, not the cash-flow math above.
- Camden Central School District (rural): math 34% / reading 48% proficiency, ranked #504 of 590 in NY (top 85%) — families likely to look elsewhere, expect single-tenant / working-renter base with shorter leases.
- Zoned schools: Mcconnellsville Elementary School (math 22% / reading 57%, grade F, #1,444 of 2,108 statewide, top 71%, 260 students, 41% FRL); Camden Middle School (math 17% / reading 42%, grade F, #550 of 729 statewide, top 77%, 580 students, 48% FRL); Camden Senior High School (math 92% / reading 75%, grade A, #409 of 1,100 statewide, top 39%, 620 students, 45% FRL) — zoned schools at 45% FRL track the district average.
- Market conditions: 34 active listings in the ZIP; 204 units permitted in Oneida County in 2024 (68 in 5+ unit buildings).
Forward outlook
- In year one you build about $4k of equity ($290 loan paydown + $4k appreciation (10.0% local appreciation)).
- Oneida County population projected at -12% by 2050 — secular population decline; favor cash flow + early exit over multi-decade hold.
- At projected returns (10.0% appreciation + 3.0% rent growth), your $12k cash investment doubles in ~2 years — after that, you're playing with house money.
- By year 7, paydown + projected appreciation supports a ~$32k cash-out refi (75% LTV) — recoverable capital for the next deal without selling this one.
Negotiation context
- It's been on market 69 days — a 6% lower offer ($39k) is reasonable based on typical stale-listing flexibility.
- Current owner paid $20k; list at $42k implies a 110% gain — meaningful room to come down on a strong offer.
Risks & watch-outs
- Watch-outs: property tax is 2.6% of price; flood insurance adds $427/mo; built in 1880 — expect roof / HVAC / electrical / plumbing capex.
- Climate carrying-cost: in FEMA flood zone AE (mandatory federal flood insurance) — expect insurance premiums to compound above CPI over the hold.
Questions for the listing agent
- It's been on market 69 days. Have you received any prior offers? Is the seller open to a 6% concession, seller financing, or rate buy-down credit?
- Built in 1880 — when were the roof, HVAC, electrical panel, plumbing, and water heater last replaced?
- Property tax is high relative to price — has the assessment been appealed recently, and will the sale trigger a re-assessment?
- What's the actual annual flood-insurance premium (NFIP or private), and is the property in a SFHA with mandatory coverage?
- Why hasn't it sold? Are there any deal-killer items the seller is aware of (foundation, flood, title, zoning, code violations)?
- Is there a deadline driving the sale (1031 exchange, divorce, estate, relocation)? That informs how much negotiation room exists.
- What's the average days-on-market for RENTAL listings here right now (not sales)? A rising rental-DOM trend means longer vacancies and softer asking-rent achievability than the comps imply.
- What's the recent tenant-quality profile in this submarket — average credit score on applications, eviction rate, late-payment / NSF rate, and stable-employment percentage? A property-management company in the area should have these aggregated.
- How much new for-sale + rental construction is in the pipeline within 1–3 miles? Heavy new supply typically softens prices + rents 12–24 months out; constrained supply supports both.
Investment metrics
- 1% rule
- 2.88% ✓
- Cap rate
- 24.21%
- Cash-on-cash
- 63.98%
- DSCR
- 3.85
- GRM
- 2.9
CMA / ARV
- ARV (median comp)
- $195,320
- List price
- $41,900
- Delta
- -78.55%
- Verdict
- UNDERPRICED
- Comps
- 3 within 1.0 mi
Show comp detail 2 sales within ~0.75 mi
| Address | Dist | Beds/Ba | Sqft | Sold | Price | $/sf | Match |
|---|---|---|---|---|---|---|---|
| 145 Drive 30 | 0.20mi | 2/1.0 | 754 (-7%) | 12mo | $180,750 | $240 | 69 |
| 1244 Lake St | 0.35mi | 2/1.0 | 832 (+3%) | 22mo | $490,000 | $589 | 61 |
Match score weights: distance 35% · size 25% · config 20% · recency 20%. Top-matched comps best support the ARV.
Projected returns pro-forma
10.0% appreciation · 3.0% rent growth · sell at horizon
- IRR
- 39.7%
- Equity multiple
- 4.05×
- Total profit
- $35,800
- Equity at exit
- $37,747
- IRR
- 34.4%
- Equity multiple
- 9.19×
- Total profit
- $96,061
- Equity at exit
- $81,402
Cash invested: $11,732 (down + closing). Projections, not guarantees.
Landlord ↔ Tenant lean methodology
- Overall (STATE)
- 15 Strongly Tenant-Friendly
- State New York
- 15 Strongly Tenant-Friendly · D+10
- County
- — inherits STATE
- City
- — inherits STATE
ZIP-level market 13308
- Home prices YoY
- 28.6%
- Active inventory
- 34
- Price-to-rent
- 2.9×
Monthly cashflow live
- Estimated rent
- $1,208 medium interval (Pro) →
- Mortgage (P&I)
- −$220
- Tax from tax record
- −$91 /mo · $1,095/yr
- Insurance
- −$17
- Flood insurance flood zone
- −$427 /mo · $5,118/yr
- HOA
- −$0
- Vacancy / Maint / Mgmt
- −$254
- Net cashflow
- $199
Break-even live
Sensitivity live
| Price | -10% $223 | -5% $211 | +0% $199 | +5% $187 | +10% $175 |
|---|---|---|---|---|---|
| Rent | -10% $104 | -5% $151 | +0% $199 | +5% $247 | +10% $294 |
| Rate | -1.0pp $220 | -0.5pp $210 | base $199 | +0.5pp $188 | +1.0pp $177 |
UW: 25.0% down · 7.5% · 30yr · 1.5% tax · 5.0% vac · 8.0% maint · 8.0% mgmt
Financing live
Cash to close
- Down payment
- $10,475
- Closing costs
- $1,257
- Reserves months
- —
- Total cash needed
- —
Loan-product check · same deal, 3 products live
Conventional
25% down · 7.5% · 30yr
- Down + closing
- —
- Monthly P&I
- —
- Monthly cashflow
- —
- DSCR
- —
- Eligible?
- —
Personal DTI + credit; lowest rate.
DSCR
20% down · 8.5% · 30yr
- Down + closing
- —
- Monthly P&I
- —
- Monthly cashflow
- —
- DSCR
- —
- Eligible?
- —
No personal income docs; deal must DSCR.
Hard money
10% down · 12.0% · 12mo
- Down + closing
- —
- Monthly P&I
- —
- Monthly cashflow
- —
- DSCR
- —
- Eligible?
- —
Short-term bridge; refi at stabilization.
Listing history 22 events
-
2026-06-22days on market $41,900 Active 69 DOM
-
2026-06-21days on market $41,900 Active 68 DOM
-
2026-06-21days on market $41,900 Active 67 DOM
-
2026-06-18price $41,900 Active 65 DOM
-
2026-06-18days on market $49,900 Active 65 DOM
-
2026-06-17days on market $49,900 Active 64 DOM
-
2026-06-16days on market $49,900 Active 63 DOM
-
2026-06-15days on market $49,900 Active 62 DOM
-
2026-06-13days on market $49,900 Active 60 DOM
-
2026-06-12days on market $49,900 Active 59 DOM
-
2026-06-09days on market $49,900 Active 56 DOM
-
2026-06-08days on market $49,900 Active 55 DOM
-
2026-06-07days on market $49,900 Active 54 DOM
-
2026-06-07days on market $49,900 Active 53 DOM
-
2026-06-04days on market $49,900 Active 50 DOM
-
2026-06-02days on market $49,900 Active 49 DOM
-
2026-06-01price $49,900 Active 48 DOM
-
2026-06-01days on market $55,000 Active 48 DOM
-
2026-05-31days on market $55,000 Active 47 DOM
-
2026-05-07price $59,900 425-char remark
Show marketing remark (425 chars)
Opportunity awaits! This 2BD/1BA single-family home with views of Oneida Lake and a creek in the backyard is ready for a full transformation. The property is a complete gut renovation--perfect for a buyer looking to create a custom retreat or an investor targeting the seasonal rental market. Priced to reflect the work needed, there's strong ARV potential and plenty of room to add value. 30 minutes to Turning Stone Casino.
-
2026-04-14$74,900 Active 425-char remark
Show marketing remark (425 chars)
Opportunity awaits! This 2BD/1BA single-family home with views of Oneida Lake and a creek in the backyard is ready for a full transformation. The property is a complete gut renovation--perfect for a buyer looking to create a custom retreat or an investor targeting the seasonal rental market. Priced to reflect the work needed, there's strong ARV potential and plenty of room to add value. 30 minutes to Turning Stone Casino.
-
1997-11-13soldstatus $20,000
ⓘ Source: listings_history table (triggers on properties + properties_extension) + one-shot
backfill from property_details.listing_events for pre-trigger history.
Tax reassessment forecast NY · Partial reset (capped growth)
- Current annual tax
- $1,095 · $91/mo
- Projected year-2 tax
- $1,095 · $91/mo
- Expected delta
- $0/yr ($0/mo · 0.0%)
ⓘ Screening estimate from a state-policy table — verify with the county assessor before closing.
Climate risk First Street
- Flood 7/10 Severe FEMA zone AE · 78% chance over 30 yrs
- Wildfire 3/10 Moderate
- Heat 3/10 Moderate 7 d/yr ≥94°F today · 16 d/yr by 30 yrs out
- Wind 1/10 Low
- Air quality 2/10 Low 1 unhealthy d/yr today · 1 by 30 yrs out
Nearby sold comps map
Loading sold comps map…
Walkable amenities ~0.75 mi
Loading nearby amenities…
Taxation est. · year 1
- Rental income
- $14,491
- − Mortgage interest
- −$2,347
- − Property taxes
- −$1,095
- − Insurance
- −$5,328
- − Repairs & maintenance
- −$1,159
- − Management
- −$1,159
- − Depreciation
- −$1,219
- Taxable income
- $2,184
- Est. tax owed @ 24.0%
- −$524
- After-tax cash flow
- $1,864/yr
For passive investors: Depreciation is non-cash, so a rental often shows a tax loss while cash-flowing — sheltering income. Rental losses are passive: they offset passive income freely, and up to $25,000/yr can offset ordinary (W-2) income if you actively participate and your MAGI is under $100k (phasing out to $0 by $150k); unused losses carry forward. On sale, claimed depreciation is recaptured at up to 25%, and gains may owe capital-gains tax (a 1031 exchange can defer both). Figures are a year-1 estimate at your 24.0% rate — not tax advice; consult a CPA.
Schools (NCES district)
- District
- Camden Central School District
- NCES district ID
- 3606240
- Math proficiency
- 34% ▼ -14.00%
- Reading proficiency
- 48% ▲ 1.00%
- Median HH income
- $48,686
- Composite
- 35.15/100
- National rank
- #5008
- State rank
- #504 of 590 in NY
Livability — North Bay
No livability data for this city. (Only ~50 U.S. cities are tracked.)
Census & demographics
- City population
- 35
- Population (ZIP)
- 4,239
Population outlook (Oneida County) Hauer SSP2
- Today (2025)
- 225,223 people
- By 2030
- 220,384 · -2.1%
- By 2040
- 209,071 · -7.2%
- By 2050
- 197,920 · -12.1%
- By 2075
- 175,541 · -22.1%
- By 2100
- 148,491 · -34.1%
Race, ethnicity, and origin ACS 2023
- Neighborhood character
- Predominantly White (93%)
- Race & ethnicity
- White 93% Two or more races 5% Hispanic / Latino 4% Asian 1%
- Common ancestry
- Romanian 8% Lithuanian 3% Subsaharan African 2%
- Foreign-born
- 2% · South Korea, Canada
- Languages at home
- 98% English-only · Korean 1%
Political lean MEDSL · Oneida
- 2024 margin
- Strong R (+21.3) · D 39.4% · R 60.6%
- 2008→2024 swing
- -15.2pp toward R · 2008: -6.1pp · 2024: -21.3pp
- All cycles
- 2024: R+21.3 2020: R+15.5 2016: R+21.1 2012: R+5.3 2008: R+6.1
Not yet ingested
- Civics
- —
Market trends
- HPI YoY
- ▲ 73.19%
- Current HPI
- 329.3091
- Rent YoY
- —
- Metro
- —
- State GDP YoY
- ▲ 2.60%
- F500 in state
- 92
Industry mix (Fortune 500 HQ in NY)
| Industry | F500 HQs | Revenue |
|---|---|---|
| Financial Services | 10 | $950B |
|
||
| Consumer Goods | 9 | $162B |
|
||
| Insurance | 4 | $225B |
|
||
| Telecommunications | 2 | $144B |
|
||
| Pharmaceuticals | 2 | $112B |
|
||
| Media / Entertainment | 2 | $69B |
|
||
Price history
+199.5% since first listed3 events — show timeline
- 2026-05-07 Price Changed $59,900 Global MLS
- 2026-04-14 Listed $74,900 Global MLS
- 1997-11-13 Sold (Public Records) $20,000 Public Records
Property tax history
+2.8%/yrLatest (2025): $1,095 · +1.1% YoY. Source: county tax records.
Cash-flow waterfall
monthlySold comps — $/sqft
last 12 mo · ≤1 miLoading sold comps…