 🌊 Lakefront
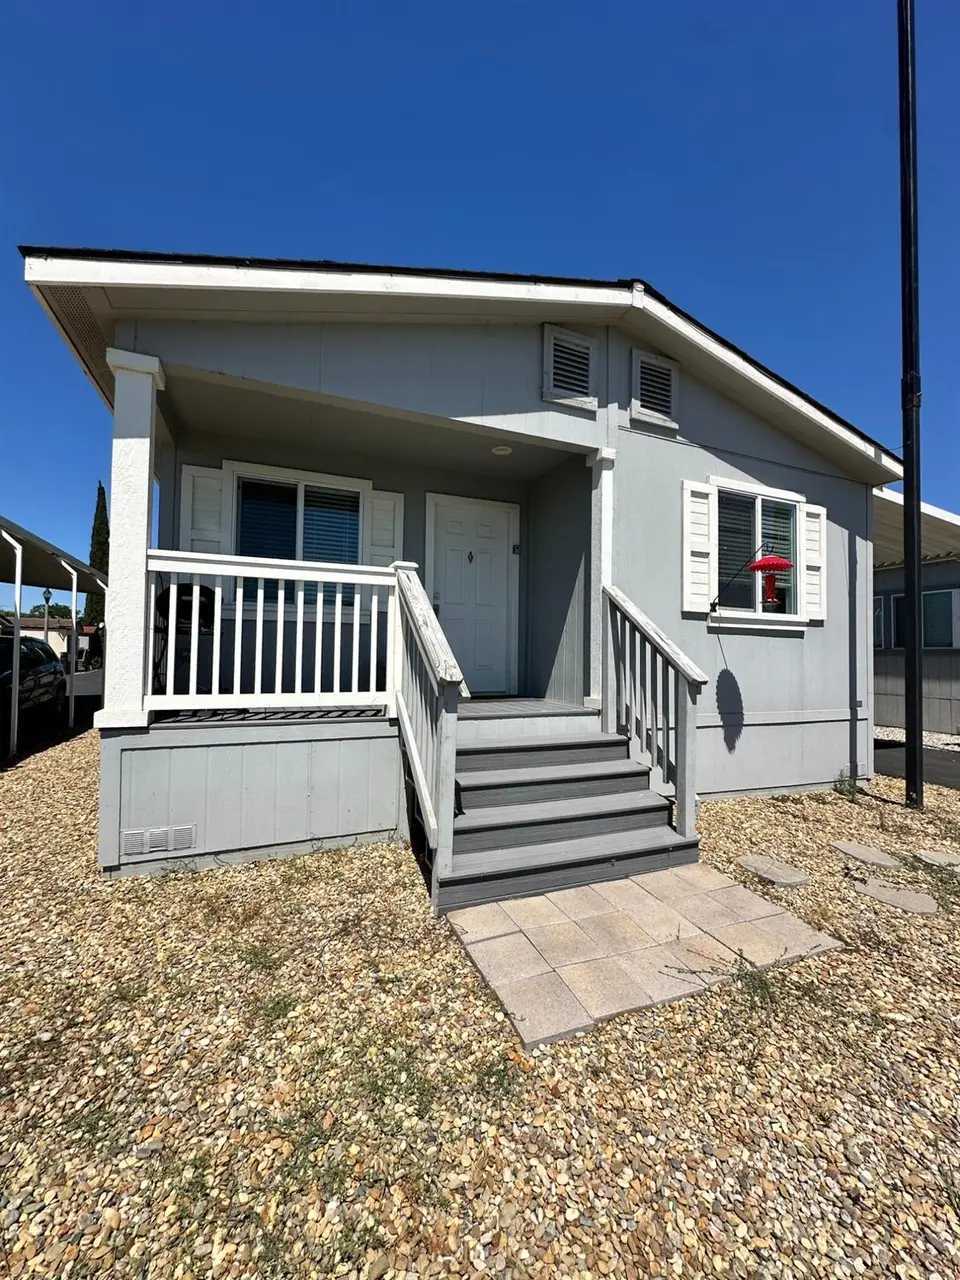
4399 Aplicella #74 · Lathrop, CA
Flood risk 5/10 · Moderate
- FEMA flood zone
- X
- Chance of flooding over 30 yrs
- 0.27%
- Est. flood insurance / yr
- $507 – $1,088
Fire risk 5/10 · Moderate
- Est. fire insurance / yr
- $659 – $1,223
Heat risk 6/10 · Moderate
- Hot days now (above 103°F)
- 7 days/yr
- Hot days in 30 yrs
- 15 days/yr
Wind risk 1/10 · Minimal
- Chance of severe wind over 30 yrs
- —
Air-quality risk 10/10 · Severe
- Unhealthy air days now
- 25 days/yr
- Unhealthy air days in 30 yrs
- 25 days/yr
Risk factors via First Street. Map © Google.
Why this score? — see what drove the C+ grade
The composite is a weighted blend of 9 inputs, each scored 0–100. Each bar is that input's sub-score; the figure is the points it added to the 100-point composite (weight × sub-score).
- Cash flow +30.0/30.0
- DSCR +10.0/10.0
- 1% rule +8.9/10.0
- Condition / age +4.0/5.0
- Schools +2.9/10.0
- Livability +2.8/5.0
- Rent growth +2.7/5.0
- ARV discount +0.0/15.0
- Appreciation +0.0/10.0
$220,000
🖨 Deal sheet (PDF) 📄 Offer letter ✓ Due diligence
Listing remarks
Price Improvement! Now offered at $220,000 a $10,000 reduction. welcome to Lakeside living in this beautifully maintained 2022 Double-Wide manufactured home located in a secure gated community in Manteca. Offering 3 bedrooms, 2 Bathrooms, and 1,284 sq ft. this home combines comfort, convenience, and low-maintenance living in a peaceful setting with scenic views. Enjoy tranquil mornings on your porch. Whether you are looking for a primary residence or a great value in today's market, this home stands out for its newer construction, desirable, location and life style appeal. Schedule your showing today and see why this home is a smart opportunity for motivated buyers.
Key facts
- Parking
- Built 2022
- Listed 33 days
Property features AI
Finance
- Other: Located in San Joaquin County (Manteca area); Address: 4399 Aplicella #74, Manteca, CA 95337; Cross street: Woodward; Directions available
- Financial info: Land lease: No
- HOA & community: No homeowners association; Not a senior community
Exterior
- Parking: Assigned parking; Off-street parking; Covered parking
- Utilities: Public water; Public sewer; Cable available; Internet available; 220 volts in laundry
- Home design: Manufactured in park; Double wide; Built in 2022
- Construction: Clayton manufactured home
- Exterior features: Lake access; Shingle roof; Wood skirting
Interior
- Kitchen: Built-in electric oven; Dishwasher; Marble counters; Island
- Bedrooms: 3 bedrooms
- Flooring: Vinyl
- Bathrooms: 2 full bathrooms; Tub with shower over; Shower stall(s)
- Heating & cooling: Central heating; Heat pump; Ceiling fan(s)
- Interior features: Marble countertops; Kitchen island; Dining and living area combined; Living room with additional features
- Laundry & utility: Washer/dryer hookups only; 220V outlet in laundry area
Neighborhood map
What this means for you Summary
Snapshot
- This is a 3-bed/2.0-bath manufactured listed at $220k. Condition is rated good.
Deal economics
- At list price, monthly cash flow is $892 ($11k/yr) — positive.
- The deal already cash-flows at list — no discount required.
- Meets the 1% rule at list price ($3k rent vs $220k).
- Recommended offer: $213k (3.0% below list) — sets the bar for market timing.
- Cap rate 11.2% vs local median 3.1% in Lathrop — top-decile yield for the area; either an underpriced asset or a hidden risk that comps aren't pricing in. Stress-test before assuming the spread holds.
Location & tenants
- Location reads 55/100 on livability (#842 in CA) — a working-class tenant base; expect higher turnover. Strengths: employment A+, housing A+; Watch: amenities D, schools F, commute F.
- Manteca Unified (suburban): math 15% / reading 48% proficiency, ranked #297 of 517 in CA (top 57%) — families likely to look elsewhere, expect single-tenant / working-renter base with shorter leases.
- Market conditions: Rents flat; 387 active listings in the ZIP; 2 comparable units currently listed for rent nearby; high-income renter base; 3,779 units permitted in San Joaquin County in 2024 (0 in 5+ unit buildings).
- This rent runs 31% of the median local income ($117k/yr) — at the standard rent-burdened threshold; future hikes will face affordability resistance.
Forward outlook
- Local home prices are declining (-3.0%/yr); year-one equity from $2k of loan paydown is wiped out by about $7k of value loss. Plan a longer hold.
- San Joaquin County population projected at +17% by 2050 — long-run rental-demand tailwind backs the buy-and-hold thesis.
- At projected returns (-3.0% appreciation + 0.8% rent growth), your $62k cash investment doubles in ~9 years — after that, you're playing with house money.
Negotiation context
- It's been on market 33 days — a 3% lower offer ($213k) is reasonable based on typical stale-listing flexibility.
Risks & watch-outs
- Climate carrying-cost: moderate flood risk; moderate wildfire risk; extreme-heat days projected 7→15/yr by 2055 (HVAC capex compounding) — expect insurance premiums to compound above CPI over the hold.
Questions for the listing agent
- It's been on market 33 days. Have you received any prior offers? Is the seller open to a 3% concession, seller financing, or rate buy-down credit?
- Is there a deadline driving the sale (1031 exchange, divorce, estate, relocation)? That informs how much negotiation room exists.
- Schools are F-rated, which usually means shorter tenancies and higher turnover. Who's the typical renter profile here, and what's been the actual vacancy rate?
- This sits on a lake — are riparian / water-frontage rights deeded with the parcel? Any dock permits, shoreline easements, or HOA water-use restrictions?
- What's the documented flood / surge / shoreline-erosion history here (FEMA AND non-FEMA — e.g., storm surge, creek backup, septic-field saturation)?
- Any water-quality or seasonal algae-bloom issues that affect tenant satisfaction or short-term-rental demand?
- What's the average days-on-market for RENTAL listings here right now (not sales)? A rising rental-DOM trend means longer vacancies and softer asking-rent achievability than the comps imply.
- What's the recent tenant-quality profile in this submarket — average credit score on applications, eviction rate, late-payment / NSF rate, and stable-employment percentage? A property-management company in the area should have these aggregated.
- How much new for-sale + rental construction is in the pipeline within 1–3 miles? Heavy new supply typically softens prices + rents 12–24 months out; constrained supply supports both.
Investment metrics
- 1% rule
- 1.39% ✓
- Cap rate
- 11.16%
- Cash-on-cash
- 17.37%
- DSCR
- 1.77
- GRM
- 6.0
CMA / ARV
- ARV (on-the-fly)
- $168,204
- Comps found
- 3
Show comp detail 3 sales within ~0.75 mi
| Address | Dist | Beds/Ba | Sqft | Sold | Price | $/sf | Match |
|---|---|---|---|---|---|---|---|
| 4399 Aplicella Ct #49 | 0.05mi | 3/2.0 | 1,283 (-0%) | 5mo | $185,000 | $144 | 94 |
| 4399 Aplicella #59 | 0.05mi | 3/2.0 | 1,440 (+12%) | 2mo | $188,000 | $131 | 76 |
| 4399 Aplicella Ct #29 | 0.00mi | 3/2.0 | 1,440 (+12%) | 7mo | $74,000 | $51 | 74 |
Match score weights: distance 35% · size 25% · config 20% · recency 20%. Top-matched comps best support the ARV.
Projected returns pro-forma
-3.0% appreciation · 0.82% rent growth · sell at horizon
- IRR
- 6.3%
- Equity multiple
- 1.24×
- Total profit
- $14,639
- Equity at exit
- $32,803
- IRR
- 13.6%
- Equity multiple
- 1.98×
- Total profit
- $60,323
- Equity at exit
- $19,022
Cash invested: $61,600 (down + closing). Projections, not guarantees.
Landlord ↔ Tenant lean methodology
- Overall (STATE)
- 18 Strongly Tenant-Friendly
- State California
- 18 Strongly Tenant-Friendly · D+13
- County
- — inherits STATE
- City
- — inherits STATE
ZIP-level market 95337
- Rents YoY
- 0.8%
- Active inventory
- 387
- Price-to-rent
- 6.0×
Monthly cashflow live
- Estimated rent
- $3,053 medium interval (Pro) →
- Mortgage (P&I)
- −$1,154
- Tax est. 1.5%
- −$275 /mo · $3,300/yr
- Insurance
- −$92
- HOA
- −$0
- Vacancy / Maint / Mgmt
- −$641
- Net cashflow
- $892
Break-even live
Sensitivity live
| Price | -10% $1,044 | -5% $968 | +0% $892 | +5% $816 | +10% $740 |
|---|---|---|---|---|---|
| Rent | -10% $651 | -5% $771 | +0% $892 | +5% $1,012 | +10% $1,133 |
| Rate | -1.0pp $1,003 | -0.5pp $948 | base $892 | +0.5pp $835 | +1.0pp $777 |
UW: 25.0% down · 7.5% · 30yr · 1.5% tax · 5.0% vac · 8.0% maint · 8.0% mgmt
Financing live
Cash to close
- Down payment
- $55,000
- Closing costs
- $6,600
- Reserves months
- —
- Total cash needed
- —
Loan-product check · same deal, 3 products live
Conventional
25% down · 7.5% · 30yr
- Down + closing
- —
- Monthly P&I
- —
- Monthly cashflow
- —
- DSCR
- —
- Eligible?
- —
Personal DTI + credit; lowest rate.
DSCR
20% down · 8.5% · 30yr
- Down + closing
- —
- Monthly P&I
- —
- Monthly cashflow
- —
- DSCR
- —
- Eligible?
- —
No personal income docs; deal must DSCR.
Hard money
10% down · 12.0% · 12mo
- Down + closing
- —
- Monthly P&I
- —
- Monthly cashflow
- —
- DSCR
- —
- Eligible?
- —
Short-term bridge; refi at stabilization.
Rent comps 2 comps
| Address | Beds | Baths | Sqft | Rent | $/sqft | DOM | Units | Dist |
|---|---|---|---|---|---|---|---|---|
| 3275 Hayduke St Manteca, CA | 3.0 | 2.5 | 1625 | $2,950 | $1.82 | 4d | 1 | 1.16mi |
| 1781 Haines Ave Manteca, CA | 3.0 | 2.0 | 1733 | $2,400 | $1.38 | 44d | 1 | 1.48mi |
Listing history 16 events
-
2026-06-18days on market $220,000 Active 33 DOM
-
2026-06-17days on market $220,000 Active 32 DOM
-
2026-06-16days on market $220,000 Active 31 DOM
-
2026-06-15days on market $220,000 Active 30 DOM
-
2026-06-14days on market $220,000 Active 28 DOM
-
2026-06-13days on market $220,000 Active 27 DOM
-
2026-06-10remarks 674-char remark
-
2026-06-10pricedays on market $220,000 Active 25 DOM
-
2026-06-09days on market $230,500 Active 24 DOM
-
2026-06-08days on market $230,500 Active 23 DOM
-
2026-06-07days on market $230,500 Active 22 DOM
-
2026-06-05days on market $230,500 Active 19 DOM
-
2026-06-03days on market $230,500 Active 18 DOM
-
2026-06-03days on market $230,500 Active 17 DOM
-
2026-06-01days on market $230,500 Active 16 DOM
-
2026-05-31days on market $230,500 Active 15 DOM
ⓘ Source: listings_history table (triggers on properties + properties_extension) + one-shot
backfill from property_details.listing_events for pre-trigger history.
Climate risk First Street
- Flood 5/10 Major FEMA zone X · 27% chance over 30 yrs
- Wildfire 5/10 Major
- Heat 6/10 Major 7 d/yr ≥103°F today · 15 d/yr by 30 yrs out
- Wind 1/10 Low
- Air quality 10/10 Extreme 25 unhealthy d/yr today · 25 by 30 yrs out
Nearby sold comps map
Loading sold comps map…
Walkable amenities ~0.75 mi
Loading nearby amenities…
Taxation est. · year 1
- Rental income
- $36,640
- − Mortgage interest
- −$12,323
- − Property taxes
- −$3,300
- − Insurance
- −$1,100
- − Repairs & maintenance
- −$2,931
- − Management
- −$2,931
- − Depreciation
- −$6,400
- Taxable income
- $7,654
- Est. tax owed @ 24.0%
- −$1,837
- After-tax cash flow
- $8,864/yr
For passive investors: Depreciation is non-cash, so a rental often shows a tax loss while cash-flowing — sheltering income. Rental losses are passive: they offset passive income freely, and up to $25,000/yr can offset ordinary (W-2) income if you actively participate and your MAGI is under $100k (phasing out to $0 by $150k); unused losses carry forward. On sale, claimed depreciation is recaptured at up to 25%, and gains may owe capital-gains tax (a 1031 exchange can defer both). Figures are a year-1 estimate at your 24.0% rate — not tax advice; consult a CPA.
Condition & rehab AI · 12 photos
This 2022 double-wide manufactured home is in good condition with modern updates and a good location. It offers a good investment opportunity with potential for value appreciation.
Value-add opportunities
- Both Paint exterior — Enhances curb appeal and value
- Both Replace carpet with tile — Improves durability and resale value
- Both Install smart home devices — Enhances convenience and marketability
Renovation cost estimate screening
Value-add ROI direction
- Both Paint exterior — Enhances curb appeal and value ↑
- Both Replace carpet with tile — Improves durability and resale value ↑
- Both Install smart home devices — Enhances convenience and marketability ↑
ⓘ Cost ranges are severity-bucket heuristics (US national rule-of-thumb). Get contractor quotes + a written scope before underwriting a rehab budget.
Schools (NCES district)
- District
- Manteca Unified
- NCES district ID
- 0623610
- Math proficiency
- 15% ▼ -14.00%
- Reading proficiency
- 48% ▬ 0.00%
- Median HH income
- $62,426
- Composite
- 28.5/100
- National rank
- #6737
- State rank
- #297 of 517 in CA
Livability — Lathrop
- Score
- 55/100
- State rank
- #842
- US rank
- #23278
Category grades
Schools grade is shown separately in the Schools card above.
Census & demographics
- County
- San Joaquin County · 729,570 people
- City population
- 35,395
- Metro
- Stockton, CA
- Population (ZIP)
- 48,731
- Household income
- $117,137
- Rent vs Own
- Severe rent burden
- 880.0
Population outlook (San Joaquin County) Hauer SSP2
- Today (2025)
- 796,965 people
- By 2030
- 828,849 · +4.0%
- By 2040
- 885,611 · +11.1%
- By 2050
- 929,798 · +16.7%
- By 2075
- 994,578 · +24.8%
- By 2100
- 971,291 · +21.9%
Race, ethnicity, and origin ACS 2023
- Neighborhood character
- Highly diverse neighborhood (Simpson 0.73)
- Race & ethnicity
- Hispanic / Latino 38% White 29% Two or more races 23% Asian 21% Black 4% Pacific Islander 2%
- Hispanic origin (detail)
- Mexican 32%
- Common ancestry
- Russian 4% Italian 2% Lithuanian 1%
- Foreign-born
- 25% · Canada, China
- Languages at home
- 61% English-only · Spanish 18% Other Indo-European 11% Tagalog/Filipino 4%
Political lean MEDSL · San Joaquin
- 2024 margin
- Toss-up / Even · D 48.0% · R 48.9% · Other 3.0%
- 2008→2024 swing
- -11.6pp toward R · 2008: 10.7pp · 2024: -0.9pp
- All cycles
- 2024: R+0.9 2020: D+13.9 2016: D+12.9 2012: D+8.9 2008: D+10.7
Not yet ingested
- Civics
- —
Market trends
- HPI YoY
- ▼ -481.88%
- Current HPI
- 273.9008
- Rent YoY
- ▲ 0.82%
- Metro
- Stockton, CA
- State GDP YoY
- ▲ 3.21%
- F500 in state
- 116
Industry mix (Fortune 500 HQ in CA)
| Industry | F500 HQs | Revenue |
|---|---|---|
| Technology | 27 | $1,492B |
|
||
| Financial Services | 3 | $174B |
|
||
| Retail | 3 | $44B |
|
||
| Insurance | 3 | $26B |
|
||
| Media / Entertainment | 2 | $115B |
|
||
| Pharmaceuticals / Biotech | 2 | $62B |
|
||
Cash-flow waterfall
monthlySold comps — $/sqft
last 12 mo · ≤1 miLoading sold comps…