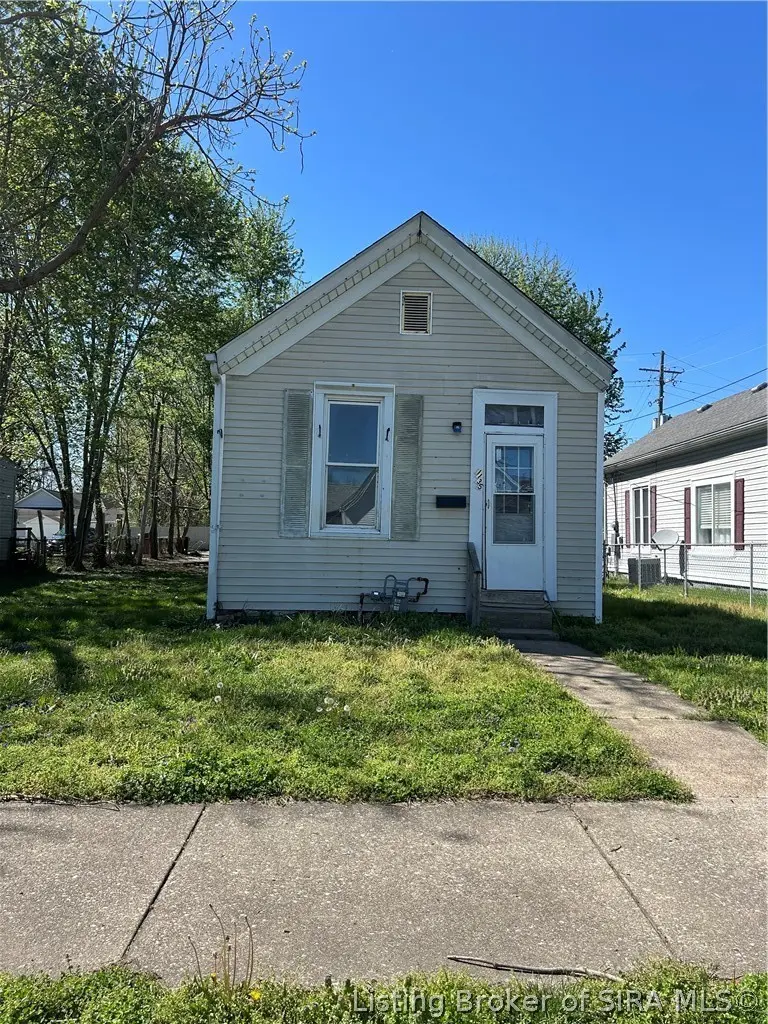
1135 Chartres St · New Albany, IN
Flood risk 1/10 · Minimal
- FEMA flood zone
- X (unshaded)
- Chance of flooding over 30 yrs
- 0.0%
- Est. flood insurance / yr
- $507 – $1,088
Fire risk 1/10 · Minimal
- Est. fire insurance / yr
- $717 – $1,331
Heat risk 5/10 · Moderate
- Hot days now (above 106°F)
- 7 days/yr
- Hot days in 30 yrs
- 20 days/yr
Wind risk 2/10 · Minimal
- Chance of severe wind over 30 yrs
- 1.0%
Air-quality risk 2/10 · Minimal
- Unhealthy air days now
- 1 days/yr
- Unhealthy air days in 30 yrs
- 2 days/yr
Risk factors via First Street. Map © Google.
Why this score? — see what drove the B grade
The composite is a weighted blend of 9 inputs, each scored 0–100. Each bar is that input's sub-score; the figure is the points it added to the 100-point composite (weight × sub-score).
- Cash flow +30.0/30.0
- DSCR +10.0/10.0
- 1% rule +8.1/10.0
- ARV discount +7.5/15.0
- Rent growth +4.3/5.0
- Schools +4.2/10.0
- Livability +3.7/5.0
- Condition / age +2.5/5.0
- Appreciation +0.0/10.0
$90,000
🖨 Deal sheet (PDF) 📄 Offer letter ✓ Due diligence
Listing remarks MLS
This 2 BR, 1BA home would make a great starter home or investment property! Home features vinyl siding. First Look Initiative: For the first 15 days that property is listed, seller will consider offers from owner occupant buyers, government entities and their partners. After 15 days, seller will also consider offers from investor buyers.
Key facts
- 6,054 sq ft lot
- Built 1929
- Listed 75 days
Property features AI
Finance
- Financial info: Annual taxes listed as $1,029
Exterior
- Parking: No garage
- Home design: Single-story home; 1,048 above-grade finished area
- Exterior features: Residential zoning; Assessor-reported lot size of 0.139 acres
Interior
- Bathrooms: 1 full bathroom
- Interior features: Resale condition
Neighborhood map
What this means for you Summary
Snapshot
- This is a 2-bed/1.0-bath single-family listed at $90k.
Deal economics
- At list price, monthly cash flow is $343 ($4k/yr) — positive.
- The deal already cash-flows at list — no discount required.
- Meets the 1% rule at list price ($1k rent vs $90k).
- Recommended offer: $85k (6.0% below list) — sets the bar for market timing.
- Cap rate 10.9% vs local median 3.9% in New Albany — top-decile yield for the area; either an underpriced asset or a hidden risk that comps aren't pricing in. Stress-test before assuming the spread holds.
Location & tenants
- Location reads 73/100 on livability (#100 in IN) — a middle-class / working-renter tenant base. Strengths: cost of living A+, housing A+, health & safety B; Watch: commute C-, employment D+, amenities F.
- New Albany-Floyd County Consolidated Schools (suburban): math 46% / reading 50% proficiency, ranked #68 of 301 in IN (top 23%) — families likely to look elsewhere, expect single-tenant / working-renter base with shorter leases.
- Zoned schools: Georgetown Elementary School (math 67% / reading 52%, grade B-, #128 of 994 statewide, top 15%, 683 students, 28% FRL); Highland Hills Middle School (math 53% / reading 57%, grade B-, #26 of 330 statewide, top 8%, 1,652 students, 19% FRL); Floyd Central High School (math 50% / reading 80%, grade B, #31 of 369 statewide, top 9%, 1,873 students, 19% FRL) — zoned schools average 22% FRL vs 38% district-wide (16 pts lower); this property's tenant base skews higher-income than the district average.
- Market conditions: Rents rising fast (+7.2%/yr); 278 active listings in the ZIP; 24 comparable units currently listed for rent nearby; rentals at typical pace (median 19d on market — plan ~3-4 weeks tenant-placement turnaround); 297 units permitted in Floyd County in 2024 (84 in 5+ unit buildings).
Forward outlook
- Local home prices are declining (-3.0%/yr); year-one equity from $622 of loan paydown is wiped out by about $3k of value loss. Plan a longer hold.
- Floyd County population projected at +10% by 2050 — modest demand growth; plan on rents tracking national, not racing it.
- At projected returns (-3.0% appreciation + 7.2% rent growth), your $25k cash investment doubles in ~6 years — after that, you're playing with house money.
Negotiation context
- It's been on market 75 days — a 6% lower offer ($85k) is reasonable based on typical stale-listing flexibility.
- 2 sale attempts since 14y ago with the ask held roughly flat each time — persistent listings suggest the price (not the market) is what's stuck; bring a comps-based counter.
- Current owner paid $12k; list at $90k implies a 620% gain — meaningful room to come down on a strong offer.
Risks & watch-outs
- Watch-outs: built in 1929 — expect roof / HVAC / electrical / plumbing capex.
- Climate carrying-cost: extreme-heat days projected 7→20/yr by 2055 (HVAC capex compounding) — expect insurance premiums to compound above CPI over the hold.
Questions for the listing agent
- It's been on market 75 days. Have you received any prior offers? Is the seller open to a 6% concession, seller financing, or rate buy-down credit?
- Built in 1929 — when were the roof, HVAC, electrical panel, plumbing, and water heater last replaced?
- Why hasn't it sold? Are there any deal-killer items the seller is aware of (foundation, flood, title, zoning, code violations)?
- Is there a deadline driving the sale (1031 exchange, divorce, estate, relocation)? That informs how much negotiation room exists.
- Schools are D-rated, which usually means shorter tenancies and higher turnover. Who's the typical renter profile here, and what's been the actual vacancy rate?
- What's the average days-on-market for RENTAL listings here right now (not sales)? A rising rental-DOM trend means longer vacancies and softer asking-rent achievability than the comps imply.
- What's the recent tenant-quality profile in this submarket — average credit score on applications, eviction rate, late-payment / NSF rate, and stable-employment percentage? A property-management company in the area should have these aggregated.
- How much new for-sale + rental construction is in the pipeline within 1–3 miles? Heavy new supply typically softens prices + rents 12–24 months out; constrained supply supports both.
Investment metrics
- 1% rule
- 1.31% ✓
- Cap rate
- 10.87%
- Cash-on-cash
- 16.34%
- DSCR
- 1.73
- GRM
- 6.4
CMA / ARV
- ARV (on-the-fly)
- $189,688
- Comps found
- 12
Show comp detail 12 sales within ~0.75 mi
| Address | Dist | Beds/Ba | Sqft | Sold | Price | $/sf | Match |
|---|---|---|---|---|---|---|---|
| 1428 Locust St | 0.16mi | 2/1.0 | 1,084 (+3%) | 2mo | $143,500 | $132 | 86 |
| 710 Culbertson Ave | 0.34mi | 2/1.5 | 1,120 (+7%) | 1mo | $210,000 | $188 | 70 |
| 1317 Vine St | 0.71mi | 2/1.0 | 1,040 (-1%) | 4mo | $104,595 | $101 | 62 |
| 330 E 16th St | 0.58mi | 2/1.0 | 1,008 (-4%) | 6mo | $190,000 | $188 | 62 |
| 1521 Ekin Ave | 0.27mi | 2/1.0 | 896 (-14%) | 2mo | $162,000 | $181 | 61 |
| 1108 State St | 0.66mi | 2/1.0 | 982 (-6%) | 2mo | $52,900 | $54 | 57 |
| 1309 Vine St | 0.71mi | 3/1.0 (+1) | 1,060 (+1%) | 4mo | $172,000 | $162 | 56 |
| 1834 Conservative St | 0.74mi | 3/1.0 (+1) | 1,056 (+1%) | 5mo | $179,900 | $170 | 55 |
| 1711 Ekin Ave | 0.38mi | 2/2.0 | 900 (-14%) | 4mo | $210,000 | $233 | 52 |
| 1313 Vine St | 0.71mi | 1/1.0 (-1) | 1,012 (-3%) | 6mo | $114,000 | $113 | 51 |
| 1804 Ekin Ave | 0.49mi | 3/2.0 (+1) | 1,174 (+12%) | 2mo | $246,500 | $210 | 47 |
| 226 Green St | 0.66mi | 2/1.0 | 898 (-14%) | 6mo | $180,000 | $200 | 40 |
Match score weights: distance 35% · size 25% · config 20% · recency 20%. Top-matched comps best support the ARV.
Projected returns pro-forma
-3.0% appreciation · 7.24% rent growth · sell at horizon
- IRR
- 11.9%
- Equity multiple
- 1.50×
- Total profit
- $12,499
- Equity at exit
- $13,419
- IRR
- 23.9%
- Equity multiple
- 3.48×
- Total profit
- $62,434
- Equity at exit
- $7,782
Cash invested: $25,200 (down + closing). Projections, not guarantees.
Landlord ↔ Tenant lean methodology
- Overall (STATE)
- 90 Strongly Landlord-Friendly
- State Indiana
- 90 Strongly Landlord-Friendly · R+11
- County
- — inherits STATE
- City
- — inherits STATE
ZIP-level market 47150
- Rents YoY
- 7.2%
- Active inventory
- 278
- Price-to-rent
- 6.4×
Monthly cashflow live
- Estimated rent
- $1,176 high interval (Pro) →
- Mortgage (P&I)
- −$472
- Tax from tax record
- −$76 /mo · $913/yr
- Insurance
- −$38
- HOA
- −$0
- Vacancy / Maint / Mgmt
- −$247
- Net cashflow
- $343
Break-even live
Sensitivity live
| Price | -10% $394 | -5% $369 | +0% $343 | +5% $318 | +10% $292 |
|---|---|---|---|---|---|
| Rent | -10% $250 | -5% $297 | +0% $343 | +5% $390 | +10% $436 |
| Rate | -1.0pp $389 | -0.5pp $366 | base $343 | +0.5pp $320 | +1.0pp $296 |
UW: 25.0% down · 7.5% · 30yr · 1.5% tax · 5.0% vac · 8.0% maint · 8.0% mgmt
Financing live
Cash to close
- Down payment
- $22,500
- Closing costs
- $2,700
- Reserves months
- —
- Total cash needed
- —
Loan-product check · same deal, 3 products live
Conventional
25% down · 7.5% · 30yr
- Down + closing
- —
- Monthly P&I
- —
- Monthly cashflow
- —
- DSCR
- —
- Eligible?
- —
Personal DTI + credit; lowest rate.
DSCR
20% down · 8.5% · 30yr
- Down + closing
- —
- Monthly P&I
- —
- Monthly cashflow
- —
- DSCR
- —
- Eligible?
- —
No personal income docs; deal must DSCR.
Hard money
10% down · 12.0% · 12mo
- Down + closing
- —
- Monthly P&I
- —
- Monthly cashflow
- —
- DSCR
- —
- Eligible?
- —
Short-term bridge; refi at stabilization.
Rent comps 24 comps
| Address | Beds | Baths | Sqft | Rent | $/sqft | DOM | Units | Dist |
|---|---|---|---|---|---|---|---|---|
| 1409 Chartres St Unit 2 New Albany, IN | 1.0 | 1.0 | 700 | $750 | $1.07 | 25d | 1 | 0.09mi |
| 812 Culbertson Ave New Albany, IN | 2.0 | 1.0 | 1000 | $1,095 | $1.09 | 23d | 1 | 0.30mi |
| 901 E Oak St New Albany, IN | 3.0 | 1.0 | 1100 | $1,350 | $1.23 | 25d | 1 | 0.35mi |
| 808 Vincennes St New Albany, IN | 2.0 | 1.5 | 1444 | $2,000 | $1.39 | 23d | 1 | 0.37mi |
| 520 Culbertson Ave Unit B New Albany, IN | 3.0 | 2.0 | 1000 | $1,395 | $1.40 | 5d | 1 | 0.40mi |
| 905 E Elm St New Albany, IN | 1.0–2.0 | 1.0 | 937 | $1,035 | $1.10 | 25d | 1 | 0.42mi |
| 508 Vincennes St New Albany, IN | 1.0 | 1.0 | 750 | $850 | $1.13 | 25d | 1 | 0.50mi |
| 1112 E Spring St Unit 1 New Albany, IN | 2.0 | 2.0 | 1200 | $1,440 | $1.20 | 25d | 1 | 0.51mi |
| 608 E Spring St Unit 2 New Albany, IN | 2.0 | 2.0 | 1100 | $1,195 | $1.09 | 25d | 1 | 0.59mi |
| 608 E Spring St Unit 2 New Albany, IN | 2.0 | 2.0 | 1100 | $1,195 | $1.09 | 5d | 1 | 0.59mi |
| 1307 E Market St #1 New Albany, IN | 2.0 | 1.0 | 936 | $1,190 | $1.27 | 18d | 1 | 0.61mi |
| 1307 E Market St #2 New Albany, IN | 1.0 | 1.0 | 804 | $975 | $1.21 | 17d | 1 | 0.61mi |
| 1108 State St New Albany, IN | 2.0 | 1.0 | 982 | $1,150 | $1.17 | 23d | 1 | 0.64mi |
| 309 E Spring St Unit 310-106 New Albany, IN | 2.0 | 2.0 | 1005 | $1,250 | $1.24 | 18d | 1 | 0.65mi |
| 309 E Spring St Unit 310-203 New Albany, IN | 2.0 | 2.5 | 1005 | $1,250 | $1.24 | 5d | 1 | 0.65mi |
| 1915 Culbertson Ave New Albany, IN | 3.0 | 1.0 | 1000 | $1,450 | $1.45 | 18d | 1 | 0.66mi |
| 807 E Main St New Albany, IN | 3.0 | 2.0 | 1500 | $1,650 | $1.10 | 21d | 1 | 0.67mi |
| 1201 Dewey St #3 New Albany, IN | 1.0 | 1.0 | 700 | $775 | $1.11 | 18d | 1 | 0.73mi |
| 1316 Roosevelt Ave Unit 11 New Albany, IN | 2.0 | 1.5 | 700 | $950 | $1.36 | 25d | 1 | 0.75mi |
| 2239 Charlestown Rd Apt 104 New Albany, IN | 1.0 | 1.0 | 842 | $1,100 | $1.31 | 16d | 1 | 0.82mi |
| 1808 Bono Rd New Albany, IN | 1.0–2.0 | 1.0–2.0 | 1000 | $1,035 | $1.03 | 5d | 1 | 0.84mi |
| 2201 Ekin Ave New Albany, IN | 2.0 | 1.0 | 1300 | $1,350 | $1.04 | 5d | 1 | 0.90mi |
| 2676 Grant Line Rd New Albany, IN | 1.0–2.0 | 1.0–2.0 | 828 | $1,402 | $1.69 | 3d | 12 | 1.33mi |
| 1429 Slate Run Rd New Albany, IN | 1.0–2.0 | 1.0–2.0 | 1200 | $1,365 | $1.14 | 16d | 4 | 1.45mi |
Listing history 17 events
-
2026-06-21days on market $90,000 Active 75 DOM
-
2026-06-18days on market $90,000 Active 72 DOM
-
2026-06-17days on market $90,000 Active 71 DOM
-
2026-06-16days on market $90,000 Active 70 DOM
-
2026-06-15days on market $90,000 Active 69 DOM
-
2026-06-13days on market $90,000 Active 67 DOM
-
2026-06-10days on market $90,000 Active 64 DOM
-
2026-06-09days on market $90,000 Active 63 DOM
-
2026-06-08days on market $90,000 Active 62 DOM
-
2026-06-07days on market $90,000 Active 61 DOM
-
2026-06-03days on market $90,000 Active 57 DOM
-
2026-06-02days on market $90,000 Active 56 DOM
-
2026-06-01days on market $90,000 Active 55 DOM
-
2026-05-31days on market $90,000 Active 54 DOM
-
2026-04-06$90,000 Active
-
2012-06-08soldstatus $12,500 339-char remark
Show marketing remark (339 chars)
This 2 BR, 1BA home would make a great starter home or investment property! Home features vinyl siding. First Look Initiative: For the first 15 days that property is listed, seller will consider offers from owner occupant buyers, government entities and their partners. After 15 days, seller will also consider offers from investor buyers.
-
2012-03-30$12,500 339-char remark
Show marketing remark (339 chars)
This 2 BR, 1BA home would make a great starter home or investment property! Home features vinyl siding. First Look Initiative: For the first 15 days that property is listed, seller will consider offers from owner occupant buyers, government entities and their partners. After 15 days, seller will also consider offers from investor buyers.
ⓘ Source: listings_history table (triggers on properties + properties_extension) + one-shot
backfill from property_details.listing_events for pre-trigger history.
Tax reassessment forecast IN · Partial reset (capped growth)
- Current annual tax
- $913 · $76/mo
- Projected year-2 tax
- $913 · $76/mo
- Expected delta
- $0/yr ($0/mo · 0.0%)
ⓘ Screening estimate from a state-policy table — verify with the county assessor before closing.
Climate risk First Street
- Flood 1/10 Low FEMA zone X (unshaded) · 0% chance over 30 yrs
- Wildfire 1/10 Low
- Heat 5/10 Major 7 d/yr ≥106°F today · 20 d/yr by 30 yrs out
- Wind 2/10 Low 100% chance of damaging wind over 30 yrs
- Air quality 2/10 Low 1 unhealthy d/yr today · 2 by 30 yrs out
Nearby sold comps map
Loading sold comps map…
Walkable amenities ~0.75 mi
Loading nearby amenities…
Taxation est. · year 1
- Rental income
- $14,108
- − Mortgage interest
- −$5,041
- − Property taxes
- −$913
- − Insurance
- −$450
- − Repairs & maintenance
- −$1,129
- − Management
- −$1,129
- − Depreciation
- −$2,618
- Taxable income
- $2,828
- Est. tax owed @ 24.0%
- −$679
- After-tax cash flow
- $3,440/yr
For passive investors: Depreciation is non-cash, so a rental often shows a tax loss while cash-flowing — sheltering income. Rental losses are passive: they offset passive income freely, and up to $25,000/yr can offset ordinary (W-2) income if you actively participate and your MAGI is under $100k (phasing out to $0 by $150k); unused losses carry forward. On sale, claimed depreciation is recaptured at up to 25%, and gains may owe capital-gains tax (a 1031 exchange can defer both). Figures are a year-1 estimate at your 24.0% rate — not tax advice; consult a CPA.
Schools (NCES district)
- District
- New Albany-Floyd County Consolidated Schools
- NCES district ID
- 1807410
- Math proficiency
- 46% ▼ -4.00%
- Reading proficiency
- 50% ▼ -3.00%
- Median HH income
- $54,709
- Composite
- 41.57/100
- National rank
- #3441
- State rank
- #68 of 301 in IN
Livability — New Albany
- Score
- 73/100
- State rank
- #100
- US rank
- #5454
Category grades
Schools grade is shown separately in the Schools card above.
Census & demographics
- Census place
- New Albany, IN
- County
- Floyd County · 49,144 people
- City population
- 49,144
- Metro
- Louisville/Jefferson County, KY-IN
- Population (ZIP)
- 49,144
- Household income
- $62,820
- Rent vs Own
- Severe rent burden
- 1737.0
Population outlook (Floyd County) Hauer SSP2
- Today (2025)
- 82,092 people
- By 2030
- 84,384 · +2.8%
- By 2040
- 87,919 · +7.1%
- By 2050
- 89,958 · +9.6%
- By 2075
- 94,159 · +14.7%
- By 2100
- 91,907 · +12.0%
Race, ethnicity, and origin ACS 2023
- Neighborhood character
- Predominantly White (82%)
- Race & ethnicity
- White 82% Black 8% Two or more races 6% Hispanic / Latino 5% Asian 1%
- Common ancestry
- Italian 3% Slovak 2% Lithuanian 2%
- Foreign-born
- 3% · Canada
- Languages at home
- 96% English-only · Spanish 2% Other Asian/Pacific 1%
Political lean MEDSL · Floyd
- 2024 margin
- R (+15.5) · D 41.4% · R 56.9% · Other 1.7%
- 2008→2024 swing
- -5.4pp toward R · 2008: -10.1pp · 2024: -15.5pp
- All cycles
- 2024: R+15.5 2020: R+14.1 2016: R+20.1 2012: R+14.3 2008: R+10.1
Not yet ingested
- Civics
- —
Market trends
- HPI YoY
- ▼ -185.20%
- Current HPI
- 206.7738
- Rent YoY
- ▲ 7.24%
- Metro
- Louisville/Jefferson County, KY-IN
- State GDP YoY
- ▲ 2.90%
- F500 in state
- 18
Industry mix (Fortune 500 HQ in IN)
| Industry | F500 HQs | Revenue |
|---|---|---|
| Industrial Machinery | 2 | $37B |
|
||
| Healthcare | 1 | $177B |
|
||
| Pharmaceuticals | 1 | $45B |
|
||
| Metals / Steel | 1 | $18B |
|
||
| Agriculture | 1 | $17B |
|
||
| Packaging | 1 | $12B |
|
||
Price history
+620.0% since first listed3 events — show timeline
- 2026-04-06 Listed $90,000 SIRA
- 2012-06-08 Sold (MLS) $12,500 SIRA
- 2012-03-30 Listed $12,500 SIRA
Property tax history
+14.3%/yrLatest (2024): $913 · -9.8% YoY. Source: county tax records.
Cash-flow waterfall
monthlySold comps — $/sqft
last 12 mo · ≤1 miLoading sold comps…