3847 N Vinewood Ave · Indianapolis city (balance), IN
Flood risk 1/10 · Minimal
- FEMA flood zone
- X (unshaded)
- Chance of flooding over 30 yrs
- 0.0%
- Est. flood insurance / yr
- $507 – $1,088
Fire risk 1/10 · Minimal
- Est. fire insurance / yr
- $717 – $1,331
Heat risk 3/10 · Minor
- Hot days now (above 101°F)
- 7 days/yr
- Hot days in 30 yrs
- 19 days/yr
Wind risk 2/10 · Minimal
- Chance of severe wind over 30 yrs
- —
Air-quality risk 4/10 · Minor
- Unhealthy air days now
- 4 days/yr
- Unhealthy air days in 30 yrs
- 5 days/yr
Risk factors via First Street. Map © Google.
Why this score? — see what drove the D+ grade
The composite is a weighted blend of 9 inputs, each scored 0–100. Each bar is that input's sub-score; the figure is the points it added to the 100-point composite (weight × sub-score).
- Cash flow +15.8/30.0
- ARV discount +14.7/15.0
- DSCR +4.9/10.0
- 1% rule +4.7/10.0
- Rent growth +3.5/5.0
- Livability +2.5/5.0
- Condition / age +2.5/5.0
- Schools +1.4/10.0
- Appreciation +0.0/10.0
$142,000
🖨 Deal sheet 📄 Offer letter ✓ Due diligence
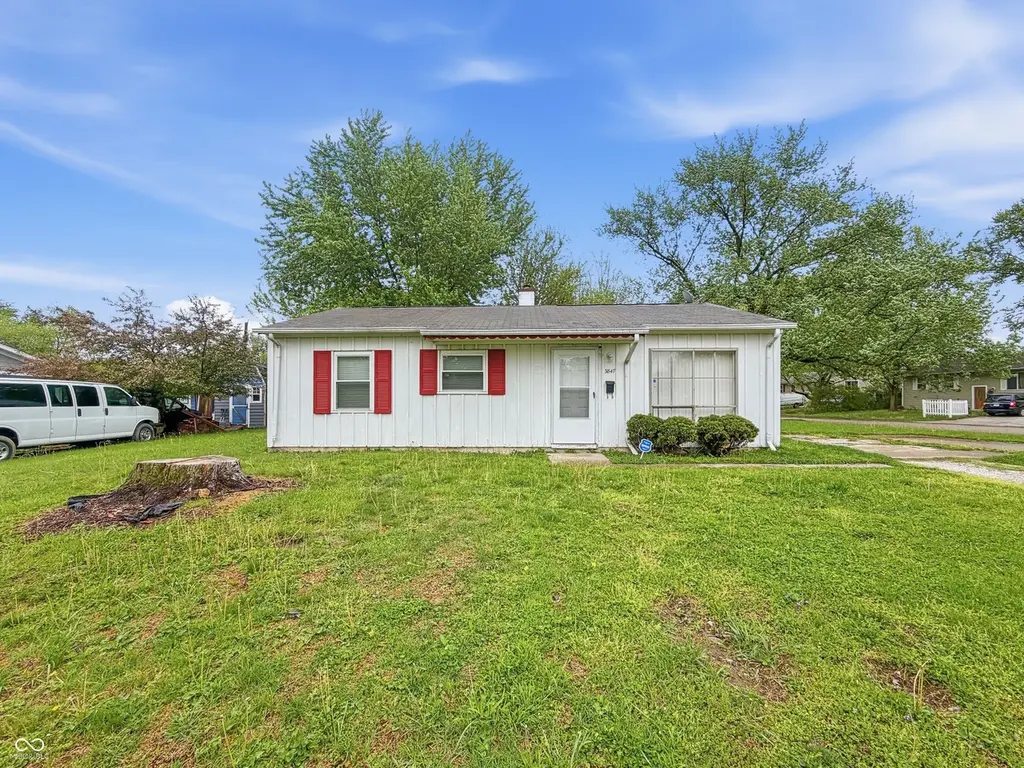
Listing remarks
This ranch-style home offers a simple, comfortable layout with the kind of potential that's easy to appreciate. From the moment you arrive, you'll see the opportunity to make it your own and create a space that fits your needs. Whether you're just getting started or looking for a solid investment, this one is worth a closer look. Built in 1962, this single-level home offers 950 square feet of living space with aluminum siding and vinyl windows for low-maintenance living. Inside, you'll find 3 bedrooms and 1 bath, with a functional layout that makes the most of the space. While there's no garage, a dedicated parking pad provides convenient off-street parking, adding to the home's practicalit
Key facts
- 8,102 sq ft lot
- Built 1962
- Listed 2 days
Property features AI
Exterior
- Utilities: Public water; Municipal sewer connected; Solid waste service available
- Home design: Single-family residence; One story
- Construction: Aluminum and vinyl siding; Slab foundation
- Exterior features: Lot under 1/4 acre (approximately 0.19 acre)
Interior
- Kitchen: No appliances included
- Bedrooms: Three bedrooms on the main level (all bedrooms on main)
- Bathrooms: One full bathroom on the main level
- Heating & cooling: Forced air heating (natural gas); Central air conditioning
- Interior features: Woodwork stained/painted
- Laundry & utility: No laundry appliances listed
Neighborhood map
What this means for you Summary
Snapshot
- This is a 3-bed/1.0-bath single-family listed at $142k.
Deal economics
- At list price, monthly cash flow is $64 ($774/yr) — positive.
- The deal already cash-flows at list — no discount required.
- To meet the 1% rule (rent ≥ 1% of price), the offer needs to be $138k (3.0% below list).
- Recommended offer: $138k (3.0% below list) — sets the bar for 1% rule.
- Cap rate 6.8% vs local median 4.4% in Indianapolis city (balance) — top-decile yield for the area; either an underpriced asset or a hidden risk that comps aren't pricing in. Stress-test before assuming the spread holds.
Location & tenants
- Location reads: area grade D — affects rentability + tenant quality, not the cash-flow math above.
- Indianapolis Public Schools (urban): math 14% / reading 20% proficiency, ranked #286 of 301 in IN (top 95%) — low school quality limits family demand, transient renter base, plan for 1-2y turnover; 77% free/reduced lunch — lower-income household profile, screen leases tightly.
- Market conditions: Rents rising fast (+4.1%/yr); 15 active listings in the ZIP; 15 comparable units currently listed for rent nearby; rentals at typical pace (median 24d on market — plan ~3-4 weeks tenant-placement turnaround); 1,906 units permitted in Marion County in 2024 (621 in 5+ unit buildings).
Forward outlook
- Local home prices are declining (-3.0%/yr); year-one equity from $982 of loan paydown is wiped out by about $4k of value loss. Plan a longer hold.
- Marion County population projected at +18% by 2050 — long-run rental-demand tailwind backs the buy-and-hold thesis.
Negotiation context
- Only 2 days on market — expect competitive offers; lowballing is unlikely to land.
Questions for the listing agent
- Built in 1962 — when were the roof, HVAC, electrical panel, plumbing, and water heater last replaced?
- Is there a deadline driving the sale (1031 exchange, divorce, estate, relocation)? That informs how much negotiation room exists.
- The area grade is low — what's the realistic commute time and amenity access for the typical tenant pool here? Any planned neighborhood developments (good or bad) we should know about?
- What's the average days-on-market for RENTAL listings here right now (not sales)? A rising rental-DOM trend means longer vacancies and softer asking-rent achievability than the comps imply.
- What's the recent tenant-quality profile in this submarket — average credit score on applications, eviction rate, late-payment / NSF rate, and stable-employment percentage? A property-management company in the area should have these aggregated.
- How much new for-sale + rental construction is in the pipeline within 1–3 miles? Heavy new supply typically softens prices + rents 12–24 months out; constrained supply supports both.
Investment metrics
- 1% rule
- 0.97% ✗
- Cap rate
- 6.84%
- Cash-on-cash
- 1.95%
- DSCR
- 1.09
- GRM
- 8.6
CMA / ARV
- ARV (on-the-fly)
- $169,100
- Comps found
- 12
Show comp detail 12 sales within ~0.75 mi
| Address | Dist | Beds/Ba | Sqft | Sold | Price | $/sf | Match |
|---|---|---|---|---|---|---|---|
| 3847 N Vinewood Ave | 0.00mi | 3/1.0 | 950 (0%) | 1mo | $142,000 | $149 | 99 |
| 6014 Ruskin Pl W | 0.16mi | 3/1.0 | 950 (0%) | 5mo | $165,000 | $174 | 88 |
| 3820 N Lawndale Ave | 0.08mi | 4/1.5 (+1) | 925 (-3%) | 1mo | $165,000 | $178 | 84 |
| 3944 N Lawndale Ave | 0.15mi | 3/1.0 | 1,008 (+6%) | 2mo | $70,000 | $69 | 81 |
| 5807 Westhaven Dr | 0.26mi | 3/1.0 | 950 (0%) | 11mo | $195,000 | $205 | 79 |
| 6008 Penway Cir | 0.27mi | 3/1.0 | 925 (-3%) | 8mo | $220,000 | $238 | 76 |
| 3938 N Vinewood Ave | 0.11mi | 4/1.0 (+1) | 988 (+4%) | 9mo | $180,000 | $182 | 76 |
| 6108 Penway St | 0.30mi | 3/1.0 | 936 (-2%) | 10mo | $155,000 | $166 | 75 |
| 5932 Dabny Ct | 0.58mi | 3/1.5 | 936 (-2%) | 2mo | $214,900 | $230 | 67 |
| 5919 W 41st Pl | 0.37mi | 3/1.0 | 864 (-9%) | 2mo | $125,000 | $145 | 66 |
| 3532 N Lawndale Ave | 0.42mi | 3/1.0 | 1,044 (+10%) | 4mo | $210,000 | $201 | 61 |
| 3544 Patton Dr | 0.52mi | 3/1.0 | 1,044 (+10%) | 8mo | $175,000 | $168 | 53 |
Match score weights: distance 35% · size 25% · config 20% · recency 20%. Top-matched comps best support the ARV.
Projected returns pro-forma
-3.0% appreciation · 4.13% rent growth · sell at horizon
- IRR
- -11.9%
- Equity multiple
- 0.57×
- Total profit
- $-17,274
- Equity at exit
- $21,173
- IRR
- -1.0%
- Equity multiple
- 0.93×
- Total profit
- $-2,913
- Equity at exit
- $12,278
Cash invested: $39,760 (down + closing). Projections, not guarantees.
Landlord ↔ Tenant lean methodology
- Overall (STATE)
- 90 Strongly Landlord-Friendly
- State Indiana
- 90 Strongly Landlord-Friendly · R+11
- County
- — inherits STATE
- City
- — inherits STATE
ZIP-level market 46254
- Home prices YoY
- -33.6%
- Rents YoY
- 4.1%
- Active inventory
- 15
- Price-to-rent
- 8.6×
Monthly cashflow live
- Estimated rent
- $1,378 high interval (Pro) →
- Mortgage (P&I)
- −$745
- Tax from tax record
- −$220 /mo · $2,641/yr
- Insurance
- −$59
- HOA
- −$0
- Vacancy / Maint / Mgmt
- −$289
- Net cashflow
- $64
Break-even live
UW: 25.0% down · 7.5% · 30yr · 1.5% tax · 5.0% vac · 8.0% maint · 8.0% mgmt
Financing live
Cash to close
- Down payment
- $35,500
- Closing costs
- $4,260
- Reserves months
- —
- Total cash needed
- —
Loan-product check · same deal, 3 products live
Conventional
25% down · 7.5% · 30yr
- Down + closing
- —
- Monthly P&I
- —
- Monthly cashflow
- —
- DSCR
- —
- Eligible?
- —
Personal DTI + credit; lowest rate.
DSCR
20% down · 8.5% · 30yr
- Down + closing
- —
- Monthly P&I
- —
- Monthly cashflow
- —
- DSCR
- —
- Eligible?
- —
No personal income docs; deal must DSCR.
Hard money
10% down · 12.0% · 12mo
- Down + closing
- —
- Monthly P&I
- —
- Monthly cashflow
- —
- DSCR
- —
- Eligible?
- —
Short-term bridge; refi at stabilization.
Rent comps 15 comps
| Address | Beds | Baths | Sqft | Rent | $/sqft | DOM | Units | Dist |
|---|---|---|---|---|---|---|---|---|
| 5801 Westhaven Dr Indianapolis, IN | 4.0 | 1.0 | 1102 | $1,300 | $1.18 | 23d | 1 | 0.29mi |
| 5801 Westhaven Dr Indianapolis, IN | 4.0 | 1.0 | 1102 | $1,300 | $1.18 | 43d | 1 | 0.29mi |
| 3636 Mission Dr Indianapolis, IN | 2.0 | 1.5 | 1100 | $1,225 | $1.11 | 43d | 1 | 0.42mi |
| 6363 Commons Dr Indianapolis, IN | 1.0–3.0 | 1.0–2.0 | 966 | $1,440 | $1.49 | 3d | 13 | 0.61mi |
| 6710 Hollow Run Pl Indianapolis, IN | 1.0–3.0 | 1.0–2.0 | 995 | $2,000 | $2.01 | 7d | 37 | 0.66mi |
| 5505 Scarlet Dr Indianapolis, IN | 3.0 | 1.0–1.5 | 883 | $1,549 | $1.75 | 2d | 4 | 0.72mi |
| 6474 Lupine Ter Indianapolis, IN | 2.0 | 1.0 | 847 | $950 | $1.12 | 23d | 1 | 0.73mi |
| 6536 Lupine Ter Indianapolis, IN | 2.0 | 1.0 | 906 | $1,280 | $1.41 | 23d | 1 | 0.78mi |
| 3269 Lupine Dr Indianapolis, IN | 2.0 | 1.0 | 986 | $995 | $1.01 | 23d | 1 | 0.84mi |
| 3279 Lupine Dr Indianapolis, IN | 2.0 | 1.0 | 827 | $1,150 | $1.39 | 43d | 1 | 0.84mi |
| 3281 Lupine Dr Indianapolis, IN | 2.0 | 1.0 | 966 | $1,300 | $1.35 | 23d | 1 | 0.85mi |
| 6436 Lupine Dr Indianapolis, IN | 2.0 | 1.0 | 966 | $950 | $0.98 | 23d | 1 | 1.12mi |
| 6458 Lupine Dr Indianapolis, IN | 2.0 | 1.0 | 966 | $950 | $0.98 | 23d | 1 | 1.13mi |
| 3201 Watergate Rd Indianapolis, IN | 3.0 | 1.0–2.0 | 826 | $1,269 | $1.54 | 3d | 20 | 1.14mi |
| 3245 Chrysler St Indianapolis, IN | 3.0 | 1.0 | 945 | $1,345 | $1.42 | 4d | 1 | 1.48mi |
Listing history 2 events
-
2026-05-01status Pending
-
2026-04-29$142,000 Active
ⓘ Source: listings_history table (triggers on properties + properties_extension) + one-shot
backfill from property_details.listing_events for pre-trigger history.
Tax reassessment forecast IN · Partial reset (capped growth)
- Current annual tax
- $2,641 · $220/mo
- Projected year-2 tax
- $2,641 · $220/mo
- Expected delta
- $0/yr ($0/mo · 0.0%)
ⓘ Screening estimate from a state-policy table — verify with the county assessor before closing.
Climate risk First Street
- Flood 1/10 Low FEMA zone X (unshaded) · 0% chance over 30 yrs
- Wildfire 1/10 Low
- Heat 3/10 Moderate 7 d/yr ≥101°F today · 19 d/yr by 30 yrs out
- Wind 2/10 Low
- Air quality 4/10 Moderate 4 unhealthy d/yr today · 5 by 30 yrs out
Nearby sold comps map
Loading sold comps map…
Walkable amenities ~0.75 mi
Loading nearby amenities…
Taxation est. · year 1
- Rental income
- $16,532
- − Mortgage interest
- −$7,954
- − Property taxes
- −$2,641
- − Insurance
- −$710
- − Repairs & maintenance
- −$1,323
- − Management
- −$1,323
- − Depreciation
- −$4,131
- Taxable loss
- −$1,549
- Est. tax savings @ 24.0%
- +$372
- After-tax cash flow
- $1,145/yr
For passive investors: Depreciation is non-cash, so a rental often shows a tax loss while cash-flowing — sheltering income. Rental losses are passive: they offset passive income freely, and up to $25,000/yr can offset ordinary (W-2) income if you actively participate and your MAGI is under $100k (phasing out to $0 by $150k); unused losses carry forward. On sale, claimed depreciation is recaptured at up to 25%, and gains may owe capital-gains tax (a 1031 exchange can defer both). Figures are a year-1 estimate at your 24.0% rate — not tax advice; consult a CPA.
Schools (NCES district)
- District
- Indianapolis Public Schools
- NCES district ID
- 1804770
- Math proficiency
- 14% ▼ -7.00%
- Reading proficiency
- 20% ▼ -3.00%
- Median HH income
- $32,034
- Composite
- 13.69/100
- National rank
- #9499
- State rank
- #286 of 301 in IN
Livability — Indianapolis city (balance)
No livability data for this city. (Only ~50 U.S. cities are tracked.)
Census & demographics
- Census place
- Indianapolis city (balance), IN
- County
- Marion County · 998,460 people
- City population
- 881,119
- Metro
- Indianapolis-Carmel-Anderson, IN
- Population (ZIP)
- 40,674
- Household income
- $60,287
- Rent vs Own
- Severe rent burden
- 1660.0
Population outlook (Marion County) Hauer SSP2
- Today (2025)
- 1,025,572 people
- By 2030
- 1,065,727 · +3.9%
- By 2040
- 1,141,577 · +11.3%
- By 2050
- 1,208,920 · +17.9%
- By 2075
- 1,367,288 · +33.3%
- By 2100
- 1,438,201 · +40.2%
Race, ethnicity, and origin ACS 2023
- Neighborhood character
- Diverse neighborhood (Simpson 0.61)
- Race & ethnicity
- Black 56% White 20% Hispanic / Latino 18% Two or more races 11% Asian 2%
- Hispanic origin (detail)
- Mexican 8% Puerto Rican 2% Dominican 2%
- Common ancestry
- Hispanic 3% Lithuanian 1% Italian 1%
- Foreign-born
- 23% · Canada, United Kingdom, Mexico
- Languages at home
- 75% English-only · Spanish 14% French/Haitian/Cajun 5% Other Indo-European 1%
Political lean MEDSL · Marion
- 2024 margin
- Strong D (+27.7) · D 63.0% · R 35.3% · Other 1.7%
- 2008→2024 swing
- -0.7pp no change · 2008: 28.4pp · 2024: 27.7pp
- All cycles
- 2024: D+27.7 2020: D+29.1 2016: D+22.8 2012: D+22.2 2008: D+28.4
Not yet ingested
- Civics
- —
Market trends
- HPI YoY
- ▼ -127.90%
- Current HPI
- 252.8994
- Rent YoY
- ▲ 4.13%
- Metro
- Indianapolis-Carmel-Anderson, IN
- State GDP YoY
- ▲ 2.90%
- F500 in state
- 18
Industry mix (Fortune 500 HQ in IN)
| Industry | F500 HQs | Revenue |
|---|---|---|
| Industrial Machinery | 2 | $37B |
|
||
| Healthcare | 1 | $177B |
|
||
| Pharmaceuticals | 1 | $45B |
|
||
| Metals / Steel | 1 | $18B |
|
||
| Agriculture | 1 | $17B |
|
||
| Packaging | 1 | $12B |
|
||
Price history
2 events — show timeline
- 2026-05-01 Pending — MIBOR as Distributed by MLS Grid
- 2026-04-29 Listed $142,000 MIBOR as Distributed by MLS Grid
Property tax history
+10.1%/yrLatest (2025): $2,641 · +13.4% YoY. Source: county tax records.
Cash-flow waterfall
monthlySold comps — $/sqft
last 12 mo · ≤1 miLoading sold comps…