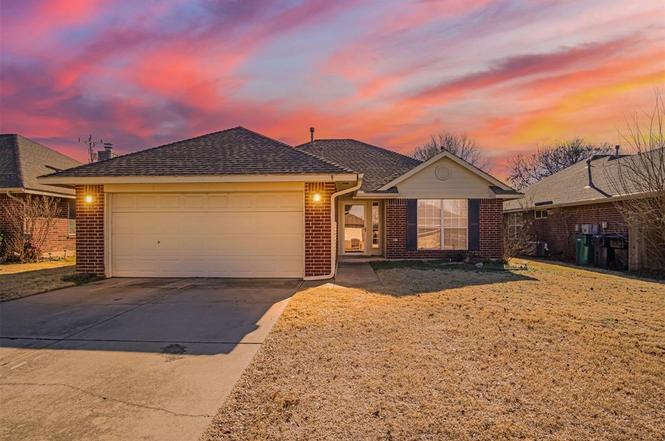
1936 NW 172nd St · Oklahoma City, OK
Flood risk 1/10 · Minimal
- FEMA flood zone
- X (unshaded)
- Chance of flooding over 30 yrs
- 0.0%
- Est. flood insurance / yr
- $507 – $1,088
Fire risk 4/10 · Minor
- Est. fire insurance / yr
- $2,463 – $4,575
Heat risk 6/10 · Moderate
- Hot days now (above 108°F)
- 7 days/yr
- Hot days in 30 yrs
- 19 days/yr
Wind risk 2/10 · Minimal
- Chance of severe wind over 30 yrs
- 2.0%
Air-quality risk 2/10 · Minimal
- Unhealthy air days now
- 2 days/yr
- Unhealthy air days in 30 yrs
- 2 days/yr
Risk factors via First Street. Map © Google.
Why this score? — see what drove the C grade
The composite is a weighted blend of 9 inputs, each scored 0–100. Each bar is that input's sub-score; the figure is the points it added to the 100-point composite (weight × sub-score).
- Cash flow +19.3/30.0
- ARV discount +15.0/15.0
- DSCR +6.1/10.0
- 1% rule +5.1/10.0
- Livability +4.0/5.0
- Schools +3.6/10.0
- Rent growth +2.8/5.0
- Condition / age +2.5/5.0
- Appreciation +0.0/10.0
$195,000
🖨 Deal sheet 📄 Offer letter ✓ Due diligence
Listing remarks MLS
Immaculate custom home with solid wood floors and lots of crown molding! Beautiful colors, Carpet only in Bedrooms, Nice gas log fireplace, big back yard! Private master with large walk-in closet, whirlpool and showwer with double vanities. Light . Bright and Open floorplan with formal dinina area. Eazy to see this stunning home anytime!
Key facts
- 6,765 sq ft lot
- 2 garage spots
- Built 2000
Neighborhood map
What this means for you Summary
Snapshot
- This is a 3-bed/2.0-bath single-family listed at $195k.
Deal economics
- At list price, monthly cash flow is $215 ($3k/yr) — positive.
- The deal already cash-flows at list — no discount required.
- Meets the 1% rule at list price ($2k rent vs $195k).
- Cap rate 7.6% vs local median 3.7% in Oklahoma City — top-decile yield for the area; either an underpriced asset or a hidden risk that comps aren't pricing in. Stress-test before assuming the spread holds.
Location & tenants
- Location reads 80/100 on livability (#3 in OK, #1,635 nationally) — a professional / high-income tenant draw. Strengths: amenities A+, commute A+, cost of living A+; Watch: crime F.
- Edmond (suburban): math 38% / reading 40% proficiency, ranked #11 of 270 in OK (top 4%) — families likely to look elsewhere, expect single-tenant / working-renter base with shorter leases.
- Zoned schools: West Field Es (math 40% / reading 45%, grade F, #83 of 845 statewide, top 10%, 852 students, 0% FRL); Santa Fe Hs (math 36% / reading 52%, grade F, #18 of 447 statewide, top 4%, 2,796 students, 0% FRL) — zoned schools average 0% FRL vs 22% district-wide (22 pts lower); this property's tenant base skews higher-income than the district average.
- Market conditions: Rents rising (+1.2%/yr); 626 active listings in the ZIP; 40 comparable units currently listed for rent nearby; rentals at typical pace (median 15d on market — plan ~3-4 weeks tenant-placement turnaround); high-income renter base; 5,365 units permitted in Oklahoma County in 2024 (569 in 5+ unit buildings).
Forward outlook
- Local home prices are declining (-3.0%/yr); year-one equity from $1k of loan paydown is wiped out by about $6k of value loss. Plan a longer hold.
- Oklahoma County population projected at +41% by 2050 — long-run rental-demand tailwind backs the buy-and-hold thesis.
Negotiation context
- Only 2 days on market — expect competitive offers; lowballing is unlikely to land.
- 4 sale attempts since 21y ago with the ask held roughly flat each time — persistent listings suggest the price (not the market) is what's stuck; bring a comps-based counter.
- Current owner paid $145k; 34% above their basis — modest negotiation headroom, anchor on the comps not their cost.
Risks & watch-outs
- Climate carrying-cost: extreme-heat days projected 7→19/yr by 2055 (HVAC capex compounding) — expect insurance premiums to compound above CPI over the hold.
Questions for the listing agent
- Is there a deadline driving the sale (1031 exchange, divorce, estate, relocation)? That informs how much negotiation room exists.
- Schools are F-rated, which usually means shorter tenancies and higher turnover. Who's the typical renter profile here, and what's been the actual vacancy rate?
- Crime grade is F in this area — have there been break-ins, vandalism, or insurance claims at this property in the last 3 years? What carrier currently insures it and at what premium?
- What's the average days-on-market for RENTAL listings here right now (not sales)? A rising rental-DOM trend means longer vacancies and softer asking-rent achievability than the comps imply.
- What's the recent tenant-quality profile in this submarket — average credit score on applications, eviction rate, late-payment / NSF rate, and stable-employment percentage? A property-management company in the area should have these aggregated.
- How much new for-sale + rental construction is in the pipeline within 1–3 miles? Heavy new supply typically softens prices + rents 12–24 months out; constrained supply supports both.
Investment metrics
- 1% rule
- 1.01% ✓
- Cap rate
- 7.62%
- Cash-on-cash
- 4.73%
- DSCR
- 1.21
- GRM
- 8.3
CMA / ARV
- ARV (on-the-fly)
- $329,298
- Comps found
- 12
Show comp detail 12 sales within ~0.75 mi
| Address | Dist | Beds/Ba | Sqft | Sold | Price | $/sf | Match |
|---|---|---|---|---|---|---|---|
| 17632 Palladium Ln | 0.28mi | 3/2.0 | 1,629 (+5%) | 3mo | $254,500 | $156 | 75 |
| 17409 Gold Dr | 0.14mi | 3/2.0 | 1,726 (+12%) | 1mo | $214,000 | $124 | 73 |
| 17305 Gold Dr | 0.09mi | 3/2.0 | 1,718 (+11%) | 5mo | $254,900 | $148 | 73 |
| 2244 NW 170th St | 0.52mi | 3/2.0 | 1,550 (+0%) | 7mo | $352,840 | $228 | 70 |
| 2240 NW 170th St | 0.52mi | 3/2.0 | 1,500 (-3%) | 2mo | $352,840 | $235 | 69 |
| 2237 NW 170th St | 0.22mi | 4/2.0 (+1) | 1,700 (+10%) | 0mo | $372,140 | $219 | 68 |
| 1900 NW 177th Ter | 0.46mi | 3/2.0 | 1,493 (-3%) | 6mo | $232,500 | $156 | 68 |
| 2236 NW 170th St | 0.52mi | 4/2.0 (+1) | 1,565 (+1%) | 2mo | $333,490 | $213 | 67 |
| 2304 NW 170th St | 0.52mi | 4/2.0 (+1) | 1,700 (+10%) | 3mo | $377,340 | $222 | 52 |
| 2305 NW 170th St | 0.48mi | 3/2.0 | 1,750 (+13%) | 5mo | $374,340 | $214 | 52 |
| 16416 Okalee Ln | 0.70mi | 3/2.0 | 1,391 (-10%) | 2mo | $234,900 | $169 | 49 |
| 17820 Griffin Gate Dr | 0.69mi | 3/2.0 | 1,755 (+14%) | 2mo | $297,990 | $170 | 44 |
Match score weights: distance 35% · size 25% · config 20% · recency 20%. Top-matched comps best support the ARV.
Projected returns pro-forma
-3.0% appreciation · 1.21% rent growth · sell at horizon
- IRR
- -10.9%
- Equity multiple
- 0.61×
- Total profit
- $-21,335
- Equity at exit
- $29,075
- IRR
- -4.4%
- Equity multiple
- 0.73×
- Total profit
- $-14,569
- Equity at exit
- $16,860
Cash invested: $54,600 (down + closing). Projections, not guarantees.
Landlord ↔ Tenant lean methodology
- Overall (STATE)
- 83 Strongly Landlord-Friendly
- State Oklahoma
- 83 Strongly Landlord-Friendly · R+20
- County
- — inherits STATE
- City
- — inherits STATE
ZIP-level market 73012
- Home prices YoY
- -17.9%
- Rents YoY
- 1.2%
- Active inventory
- 626
- Price-to-rent
- 8.3×
Monthly cashflow live
- Estimated rent
- $1,960 high interval (Pro) →
- Mortgage (P&I)
- −$1,023
- Tax from tax record
- −$229 /mo · $2,753/yr
- Insurance
- −$81
- HOA
- −$0
- Vacancy / Maint / Mgmt
- −$412
- Net cashflow
- $215
Break-even live
UW: 25.0% down · 7.5% · 30yr · 1.5% tax · 5.0% vac · 8.0% maint · 8.0% mgmt
Financing live
Cash to close
- Down payment
- $48,750
- Closing costs
- $5,850
- Reserves months
- —
- Total cash needed
- —
Loan-product check · same deal, 3 products live
Conventional
25% down · 7.5% · 30yr
- Down + closing
- —
- Monthly P&I
- —
- Monthly cashflow
- —
- DSCR
- —
- Eligible?
- —
Personal DTI + credit; lowest rate.
DSCR
20% down · 8.5% · 30yr
- Down + closing
- —
- Monthly P&I
- —
- Monthly cashflow
- —
- DSCR
- —
- Eligible?
- —
No personal income docs; deal must DSCR.
Hard money
10% down · 12.0% · 12mo
- Down + closing
- —
- Monthly P&I
- —
- Monthly cashflow
- —
- DSCR
- —
- Eligible?
- —
Short-term bridge; refi at stabilization.
Rent comps 40 comps
| Address | Beds | Baths | Sqft | Rent | $/sqft | DOM | Units | Dist |
|---|---|---|---|---|---|---|---|---|
| 17405 Bronze Ln Edmond, OK | 4.0 | 2.0 | 1787 | $2,050 | $1.15 | 2d | 1 | 0.09mi |
| 17309 Platinum Ln Edmond, OK | 3.0 | 2.0 | 1840 | $1,895 | $1.03 | 15d | 1 | 0.22mi |
| 17609 Gold Dr Edmond, OK | 4.0 | 2.0 | 1640 | $1,995 | $1.22 | 24d | 1 | 0.28mi |
| 1720 NW 172nd St Edmond, OK | 4.0 | 2.0 | 1868 | $1,975 | $1.06 | 24d | 1 | 0.32mi |
| 17516 Black Hawk Dr Edmond, OK | 3.0 | 2.0 | 1846 | $2,095 | $1.13 | 2d | 1 | 0.43mi |
| 1708 NW 163rd Cir Edmond, OK | 3.0 | 2.0 | 2128 | $1,950 | $0.92 | 15d | 1 | 0.65mi |
| 1528 NW 179th St Edmond, OK | 4.0 | 2.0 | 2067 | $2,221 | $1.07 | 15d | 1 | 0.72mi |
| 17409 Wain Bridge Ave Edmond, OK | 3.0 | 2.0 | 2120 | $1,800 | $0.85 | 24d | 1 | 0.74mi |
| 16224 Panther Way Edmond, OK | 3.0 | 2.0 | 1512 | $1,695 | $1.12 | 15d | 1 | 0.75mi |
| 17617 Wain Bridge Ave Edmond, OK | 4.0 | 2.0 | 1707 | $1,895 | $1.11 | 2d | 1 | 0.79mi |
| 17904 Scarlet Oak Ln Edmond, OK | 3.0 | 2.0 | 1713 | $1,625 | $0.95 | 4d | 1 | 0.82mi |
| 16001 Korie Dr Edmond, OK | 3.0 | 2.0 | 1778 | $1,995 | $1.12 | 24d | 1 | 0.84mi |
| 16401 Osceola Trl Edmond, OK | 3.0 | 2.0 | 1563 | $1,595 | $1.02 | 24d | 1 | 0.90mi |
| 16401 Osceola Trl Edmond, OK | 3.0 | 2.0 | 1563 | $1,595 | $1.02 | 20d | 1 | 0.90mi |
| 15937 Katie Ridge Dr Edmond, OK | 4.0 | 2.0 | 1763 | $1,945 | $1.10 | 2d | 1 | 0.91mi |
| 17029 Woodvine Dr Edmond, OK | 3.0 | 2.0 | 1838 | $1,970 | $1.07 | 17d | 1 | 0.92mi |
| 17115 Cedar Dr Edmond, OK | 2.0 | 2.0 | 1563 | $1,495 | $0.96 | 12d | 1 | 0.94mi |
| 1420 NW 183rd Ter Edmond, OK | 3.0 | 2.0 | 1767 | $1,950 | $1.10 | 21d | 1 | 0.95mi |
| 17025 Canyonwood Ln Edmond, OK | 4.0 | 2.0 | 2075 | $1,799 | $0.87 | 2d | 1 | 0.97mi |
| 16212 Osceola Trl Edmond, OK | 3.0 | 2.0 | 1672 | $1,800 | $1.08 | 2d | 1 | 0.97mi |
| 1005 Valley Ct Edmond, OK | 3.0 | 2.0 | 1455 | $1,795 | $1.23 | 24d | 1 | 1.01mi |
| 18301 Montoro Way Edmond, OK | 3.0 | 2.0 | 1556 | $1,695 | $1.09 | 2d | 1 | 1.02mi |
| 18509 Chestnut Oak Dr Edmond, OK | 3.0 | 2.0 | 1766 | $1,800 | $1.02 | 21d | 1 | 1.03mi |
| 1037 NW 166th St Edmond, OK | 3.0 | 2.0 | 1630 | $1,595 | $0.98 | 24d | 1 | 1.04mi |
| 1037 NW 166th St Edmond, OK | 3.0 | 2.0 | 1600 | $1,595 | $1.00 | 4d | 1 | 1.04mi |
| 1018 NW 166th Ter Edmond, OK | 3.0 | 2.0 | 1835 | $1,650 | $0.90 | 24d | 1 | 1.08mi |
| 2717 NW 178th St Edmond, OK | 1.0–3.0 | 1.0–2.0 | 943 | $1,749 | $1.85 | 2d | 15 | 1.09mi |
| 2609 NW 182nd St Edmond, OK | 3.0 | 2.0 | 1954 | $2,150 | $1.10 | 2d | 1 | 1.14mi |
| 18509 Agua Dr Edmond, OK | 3.0 | 2.0 | 1595 | $1,800 | $1.13 | 2d | 1 | 1.15mi |
| 2344 Roca Dr Edmond, OK | 3.0 | 2.0 | 1213 | $1,650 | $1.36 | 12d | 1 | 1.17mi |
| 2212 NW 157th Ter Edmond, OK | 3.0 | 2.0 | 1964 | $1,895 | $0.96 | 2d | 1 | 1.18mi |
| 18212 Viento Dr Edmond, OK | 3.0 | 2.0 | 1954 | $1,745 | $0.89 | 24d | 1 | 1.21mi |
| 18613 Vivo Dr Edmond, OK | 3.0 | 2.0 | 1682 | $1,995 | $1.19 | 19d | 1 | 1.21mi |
| 2201 NW 155th St Edmond, OK | 2.0 | 2.0 | 1149 | $1,495 | $1.30 | 24d | 1 | 1.21mi |
| 17116 Sunny Hollow Rd Edmond, OK | 4.0 | 2.5 | 1690 | $2,100 | $1.24 | 2d | 1 | 1.22mi |
| 16108 N Western Ave Edmond, OK | 3.0–4.0 | 2.5 | 1700 | $1,598 | $0.94 | 3d | 6 | 1.23mi |
| 18600 Luna Dr Edmond, OK | 4.0 | 2.0 | 1989 | $2,395 | $1.20 | 2d | 1 | 1.23mi |
| 604A NW 175th St Unit 604A Edmond, OK | 4.0 | 2.5 | 1968 | $1,900 | $0.97 | 24d | 1 | 1.28mi |
| 525 NW 171st St Edmond, OK | 3.0 | 2.0 | 1607 | $1,900 | $1.18 | 2d | 1 | 1.32mi |
| 15501 N Pennsylvania Ave Edmond, OK | 3.0 | 2.0 | 1053 | $1,699 | $1.61 | 24d | 1 | 1.32mi |
Listing history 12 events
-
2026-01-18status Pending
-
2026-01-16$195,000 Active
-
2010-05-06soldstatus $145,000
-
2010-04-30soldstatus $144,900 339-char remark
Show marketing remark (339 chars)
Immaculate custom home with solid wood floors and lots of crown molding! Beautiful colors, Carpet only in Bedrooms, Nice gas log fireplace, big back yard! Private master with large walk-in closet, whirlpool and showwer with double vanities. Light . Bright and Open floorplan with formal dinina area. Eazy to see this stunning home anytime!
-
2010-03-30$144,900 339-char remark
Show marketing remark (339 chars)
Immaculate custom home with solid wood floors and lots of crown molding! Beautiful colors, Carpet only in Bedrooms, Nice gas log fireplace, big back yard! Private master with large walk-in closet, whirlpool and showwer with double vanities. Light . Bright and Open floorplan with formal dinina area. Eazy to see this stunning home anytime!
-
2006-05-30soldstatus $135,000 278-char remark
Show marketing remark (278 chars)
NEW PRICE....Gorgeous REAL hardwood floors in the living/formal dining-area and hallway. Large bedrooms, master bdrm. away from primary bdrms., great closet space in all rooms, large utility room, pantry in kitchen, 2 coat closets. MAKE OFFER, THE SELLER IS VERY MOTIVATED......
-
2006-05-30soldstatus $135,000
Show marketing remark (278 chars)
NEW PRICE....Gorgeous REAL hardwood floors in the living/formal dining-area and hallway. Large bedrooms, master bdrm. away from primary bdrms., great closet space in all rooms, large utility room, pantry in kitchen, 2 coat closets. MAKE OFFER, THE SELLER IS VERY MOTIVATED......
-
2006-01-07$140,500 278-char remark
Show marketing remark (278 chars)
NEW PRICE....Gorgeous REAL hardwood floors in the living/formal dining-area and hallway. Large bedrooms, master bdrm. away from primary bdrms., great closet space in all rooms, large utility room, pantry in kitchen, 2 coat closets. MAKE OFFER, THE SELLER IS VERY MOTIVATED......
-
2005-08-03soldstatus $142,500
-
2005-07-29soldstatus $142,500
-
2005-04-29$142,500
-
2005-04-29historical
ⓘ Source: listings_history table (triggers on properties + properties_extension) + one-shot
backfill from property_details.listing_events for pre-trigger history.
Tax reassessment forecast OK · Resets to sale price
- Current annual tax
- $2,753 · $229/mo
- Projected year-2 tax
- $2,753 · $229/mo
- Expected delta
- $0/yr ($0/mo · 0.0%)
ⓘ Screening estimate from a state-policy table — verify with the county assessor before closing.
Climate risk First Street
- Flood 1/10 Low FEMA zone X (unshaded) · 0% chance over 30 yrs
- Wildfire 4/10 Moderate
- Heat 6/10 Major 7 d/yr ≥108°F today · 19 d/yr by 30 yrs out
- Wind 2/10 Low 2% chance of damaging wind over 30 yrs
- Air quality 2/10 Low 2 unhealthy d/yr today · 2 by 30 yrs out
Nearby sold comps map
Loading sold comps map…
Walkable amenities ~0.75 mi
Loading nearby amenities…
Taxation est. · year 1
- Rental income
- $23,522
- − Mortgage interest
- −$10,923
- − Property taxes
- −$2,753
- − Insurance
- −$975
- − Repairs & maintenance
- −$1,882
- − Management
- −$1,882
- − Depreciation
- −$5,673
- Taxable loss
- −$565
- Est. tax savings @ 24.0%
- +$136
- After-tax cash flow
- $2,719/yr
For passive investors: Depreciation is non-cash, so a rental often shows a tax loss while cash-flowing — sheltering income. Rental losses are passive: they offset passive income freely, and up to $25,000/yr can offset ordinary (W-2) income if you actively participate and your MAGI is under $100k (phasing out to $0 by $150k); unused losses carry forward. On sale, claimed depreciation is recaptured at up to 25%, and gains may owe capital-gains tax (a 1031 exchange can defer both). Figures are a year-1 estimate at your 24.0% rate — not tax advice; consult a CPA.
Schools (NCES district)
- District
- Edmond
- NCES district ID
- 4010590
- Math proficiency
- 38% ▼ -12.00%
- Reading proficiency
- 40% ▼ -12.00%
- Median HH income
- $73,212
- Composite
- 35.88/100
- National rank
- #4814
- State rank
- #11 of 270 in OK
Livability — Oklahoma City
- Score
- 80/100
- State rank
- #3
- US rank
- #1635
Category grades
Schools grade is shown separately in the Schools card above.
Census & demographics
- Census place
- Oklahoma City, OK
- County
- Oklahoma County · 771,644 people
- City population
- 498,656
- Metro
- Oklahoma City, OK
- Population (ZIP)
- 46,993
- Household income
- $126,659
- Rent vs Own
- Severe rent burden
- 898.0
Population outlook (Oklahoma County) Hauer SSP2
- Today (2025)
- 911,875 people
- By 2030
- 982,413 · +7.7%
- By 2040
- 1,130,468 · +24.0%
- By 2050
- 1,288,422 · +41.3%
- By 2075
- 1,711,482 · +87.7%
- By 2100
- 2,088,448 · +129.0%
Race, ethnicity, and origin ACS 2023
- Neighborhood character
- Predominantly White (67%)
- Race & ethnicity
- White 67% Two or more races 10% Black 8% Asian 8% Hispanic / Latino 8% Native American 2%
- Hispanic origin (detail)
- Mexican 5%
- Common ancestry
- Italian 3% Slovak 2% Romanian 2%
- Foreign-born
- 11% · Canada, China, Vietnam
- Languages at home
- 86% English-only · Spanish 4% Other Indo-European 2% Chinese 2%
Political lean MEDSL · Oklahoma
- 2024 margin
- Toss-up / Even · D 48.0% · R 49.7% · Other 2.3%
- 2008→2024 swing
- +15.1pp toward D · 2008: -16.8pp · 2024: -1.7pp
- All cycles
- 2024: R+1.7 2020: R+1.1 2016: R+10.5 2012: R+16.7 2008: R+16.8
Not yet ingested
- Civics
- —
Market trends
- HPI YoY
- ▼ -44.41%
- Current HPI
- 203.1105
- Rent YoY
- ▲ 1.21%
- Metro
- Oklahoma City, OK
- State GDP YoY
- ▲ 1.55%
- F500 in state
- 6
Industry mix (Fortune 500 HQ in OK)
| Industry | F500 HQs | Revenue |
|---|---|---|
| Energy | 3 | $48B |
|
||
Price history
+36.8% since first listed12 events — show timeline
- 2026-01-18 Pending — MLSOK
- 2026-01-16 Listed $195,000 MLSOK
- 2010-05-06 Sold (Public Records) $145,000 Public Records
- 2010-04-30 Sold (MLS) $144,900 MLSOK
- 2010-03-30 Listed $144,900 MLSOK
- 2006-05-30 Sold (Public Records) $135,000 Public Records
- 2006-05-30 Sold (MLS) $135,000 MLSOK
- 2006-01-07 Listed $140,500 MLSOK
- 2005-08-03 Sold (MLS) $142,500 MLSOK
- 2005-07-29 Sold (Public Records) $142,500 Public Records
- 2005-04-29 Listing Removed — MLSOK
- 2005-04-29 Listed $142,500 MLSOK
Property tax history
+3.3%/yrLatest (2025): $2,753 · +5.3% YoY. Source: county tax records.
Cash-flow waterfall
monthlySold comps — $/sqft
last 12 mo · ≤1 miLoading sold comps…