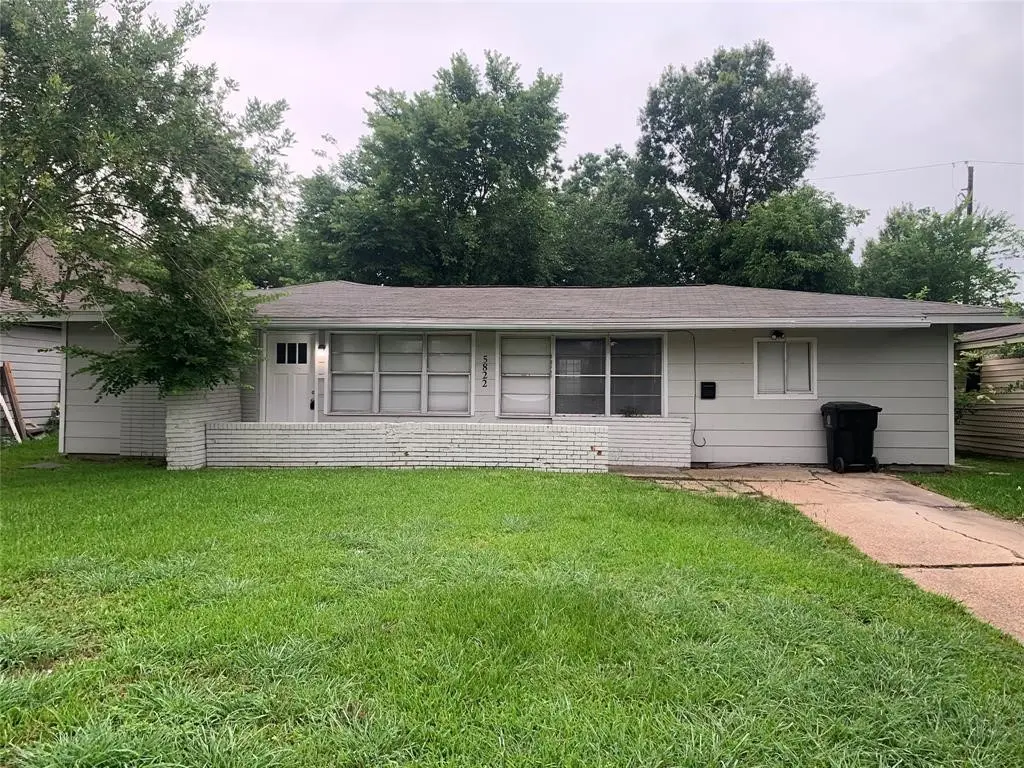
5822 Glenhurst Dr · Houston, TX
Flood risk 6/10 · Moderate
- FEMA flood zone
- X (unshaded)
- Chance of flooding over 30 yrs
- 0.71%
- Est. flood insurance / yr
- $507 – $1,088
Fire risk 1/10 · Minimal
- Est. fire insurance / yr
- $1,222 – $2,270
Heat risk 9/10 · Severe
- Hot days now (above 109°F)
- 6 days/yr
- Hot days in 30 yrs
- 18 days/yr
Wind risk 9/10 · Severe
- Chance of severe wind over 30 yrs
- 99.0%
Air-quality risk 2/10 · Minimal
- Unhealthy air days now
- 2 days/yr
- Unhealthy air days in 30 yrs
- 2 days/yr
Risk factors via First Street. Map © Google.
Why this score? — see what drove the D grade
The composite is a weighted blend of 9 inputs, each scored 0–100. Each bar is that input's sub-score; the figure is the points it added to the 100-point composite (weight × sub-score).
- Cash flow +15.2/30.0
- ARV discount +7.5/15.0
- 1% rule +4.6/10.0
- DSCR +4.6/10.0
- Rent growth +3.9/5.0
- Livability +3.7/5.0
- Schools +2.7/10.0
- Condition / age +2.5/5.0
- Appreciation +0.0/10.0
$219,000
🖨 Deal sheet (PDF) 📄 Offer letter ✓ Due diligence
Listing remarks MLS
Investors Special near Medical Center. Needs rehab
Key facts
- 6,899 sq ft lot
- Built 1940
- Listed 46 days
Property features AI
Finance
- Financial info: Lease not considered
Exterior
- Utilities: Public water; Public sewer; Central heating (electric); Central air conditioning (electric)
- Home design: Residential property; Built in 1940; Pillar/post/pier foundation
- Construction: Wood siding; Composition roof
- Exterior features: Subdivision lot
Interior
- Kitchen: Kitchen (First floor) approximately 11 x 11; Disposal
- Bedrooms: Primary bedroom (First floor) approximately 11 x 10; Three additional bedrooms (First floor) each approximately 10 x 10; One more bedroom (First floor) approximately 10 x 10 — property lists 4 possible bedrooms
- Bathrooms: 2 full bathrooms
- Interior features: Disposal; No fireplaces; 6 total rooms
Neighborhood map
What this means for you Summary
Snapshot
- This is a 4-bed/2.0-bath single-family listed at $219k.
Deal economics
- At list price, monthly cash flow is $74 ($890/yr) — positive.
- The deal already cash-flows at list — no discount required.
- To meet the 1% rule (rent ≥ 1% of price), the offer needs to be $209k (4.5% below list).
- Recommended offer: $209k (4.5% below list) — sets the bar for 1% rule.
- Cap rate 6.7% vs local median 3.2% in Houston — top-decile yield for the area; either an underpriced asset or a hidden risk that comps aren't pricing in. Stress-test before assuming the spread holds.
Location & tenants
- Location reads 74/100 on livability (#184 in TX, #4,771 nationally) — a middle-class / working-renter tenant base. Strengths: amenities A+, cost of living A+, housing A+; Watch: crime F.
- Houston ISD (urban): math 27% / reading 35% proficiency, ranked #593 of 826 in TX (top 72%) — families likely to look elsewhere, expect single-tenant / working-renter base with shorter leases; 71% free/reduced lunch — lower-income household profile, screen leases tightly.
- Zoned schools: Alcott El (math 32% / reading 22%, grade F, #2,791 of 4,322 statewide, top 68%, 192 students, 100% FRL); Attucks Middle (math 15% / reading 22%, grade F, #1,478 of 1,662 statewide, top 90%, 439 students, 98% FRL); Sterling H S (math 16% / reading 27%, grade F, #1,377 of 1,632 statewide, top 85%, 1,421 students, 92% FRL) — zoned schools average 96% FRL vs 71% district-wide (25 pts higher); higher-poverty schools than district average — tighter screening recommended.
- Market conditions: Rents rising fast (+5.5%/yr); 345 active listings in the ZIP; 29 comparable units currently listed for rent nearby; rentals at typical pace (median 26d on market — plan ~3-4 weeks tenant-placement turnaround); 48% of comp listings sitting > 30 days — soft ceiling on asking rent; lower-income renter base — watch delinquency; 29,883 units permitted in Harris County in 2024 (8,621 in 5+ unit buildings).
- At $2,092/mo this rent would consume 66% of the median local household income ($38k/yr) (locally 1728% of renters already pay >50% of income on rent) — very limited rent-growth headroom before tenants either downsize or default.
Forward outlook
- Local home prices are declining (-3.0%/yr); year-one equity from $2k of loan paydown is wiped out by about $7k of value loss. Plan a longer hold.
- Harris County population projected at +47% by 2050 — long-run rental-demand tailwind backs the buy-and-hold thesis.
Negotiation context
- It's been on market 46 days — a 3% lower offer ($212k) is reasonable based on typical stale-listing flexibility.
- 11 sale attempts since 3y ago with the ask held roughly flat each time — persistent listings suggest the price (not the market) is what's stuck; bring a comps-based counter.
Risks & watch-outs
- Watch-outs: built in 1940 — expect roof / HVAC / electrical / plumbing capex.
- Climate carrying-cost: major flood risk; severe wind risk, 99% chance of damaging wind over 30y; extreme-heat days projected 6→18/yr by 2055 (HVAC capex compounding) — expect insurance premiums to compound above CPI over the hold.
Questions for the listing agent
- It's been on market 46 days. Have you received any prior offers? Is the seller open to a 4% concession, seller financing, or rate buy-down credit?
- Built in 1940 — when were the roof, HVAC, electrical panel, plumbing, and water heater last replaced?
- Is there a deadline driving the sale (1031 exchange, divorce, estate, relocation)? That informs how much negotiation room exists.
- Schools are D-rated, which usually means shorter tenancies and higher turnover. Who's the typical renter profile here, and what's been the actual vacancy rate?
- Crime grade is F in this area — have there been break-ins, vandalism, or insurance claims at this property in the last 3 years? What carrier currently insures it and at what premium?
- The area grade is low — what's the realistic commute time and amenity access for the typical tenant pool here? Any planned neighborhood developments (good or bad) we should know about?
- What's the average days-on-market for RENTAL listings here right now (not sales)? A rising rental-DOM trend means longer vacancies and softer asking-rent achievability than the comps imply.
- What's the recent tenant-quality profile in this submarket — average credit score on applications, eviction rate, late-payment / NSF rate, and stable-employment percentage? A property-management company in the area should have these aggregated.
- How much new for-sale + rental construction is in the pipeline within 1–3 miles? Heavy new supply typically softens prices + rents 12–24 months out; constrained supply supports both.
Investment metrics
- 1% rule
- 0.96% ✗
- Cap rate
- 6.70%
- Cash-on-cash
- 1.45%
- DSCR
- 1.06
- GRM
- 8.7
CMA / ARV
- ARV (median comp)
- $218,766
- List price
- $219,000
- Delta
- 0.11%
- Verdict
- FAIR
- Comps
- 20 within 1.0 mi
Show comp detail 12 sales within ~0.75 mi
| Address | Dist | Beds/Ba | Sqft | Sold | Price | $/sf | Match |
|---|---|---|---|---|---|---|---|
| 5614 Northridge Dr | 0.37mi | 4/2.0 | 1,850 (-1%) | 9mo | $256,990 | $139 | 73 |
| 6026 Ridgeway Dr | 0.42mi | 4/2.0 | 1,984 (+6%) | 2mo | $250,000 | $126 | 69 |
| 5946 Ridgeway Dr | 0.25mi | 3/2.0 (-1) | 1,692 (-10%) | 8mo | $135,000 | $80 | 61 |
| 5731 Doulton Dr | 0.13mi | 3/2.0 (-1) | 1,668 (-11%) | 13mo | $329,900 | $198 | 60 |
| 6025 Wortham Way | 0.39mi | 4/2.5 | 1,629 (-13%) | 6mo | $225,000 | $138 | 53 |
| 5931 Westover St | 0.64mi | 4/2.0 | 1,925 (+3%) | 15mo | $235,000 | $122 | 53 |
| 5826 Flamingo Dr | 0.72mi | 3/1.5 (-1) | 1,753 (-6%) | 3mo | $174,500 | $100 | 47 |
| 6031 E Lyndhurst Dr | 0.45mi | 4/2.0 | 1,595 (-15%) | 15mo | $149,900 | $94 | 42 |
| 7822 Sharondale Dr | 0.37mi | 3/1.0 (-1) | 1,606 (-14%) | 12mo | $105,000 | $65 | 40 |
| 5311 Lyndhurst Dr | 0.62mi | 3/1.5 (-1) | 1,692 (-10%) | 10mo | $135,000 | $80 | 40 |
| 5806 Beldart St | 0.65mi | 3/1.0 (-1) | 1,736 (-7%) | 11mo | $150,000 | $86 | 40 |
| 5727 Thrush Dr | 0.74mi | 3/2.5 (-1) | 1,684 (-10%) | 5mo | $255,000 | $151 | 38 |
Match score weights: distance 35% · size 25% · config 20% · recency 20%. Top-matched comps best support the ARV.
Projected returns pro-forma
-3.0% appreciation · 5.45% rent growth · sell at horizon
- IRR
- -11.1%
- Equity multiple
- 0.59×
- Total profit
- $-25,407
- Equity at exit
- $32,654
- IRR
- 1.5%
- Equity multiple
- 1.11×
- Total profit
- $7,050
- Equity at exit
- $18,935
Cash invested: $61,320 (down + closing). Projections, not guarantees.
Landlord ↔ Tenant lean methodology
- Overall (STATE)
- 87 Strongly Landlord-Friendly
- State Texas
- 87 Strongly Landlord-Friendly · R+5
- County
- — inherits STATE
- City
- — inherits STATE
ZIP-level market 77033
- Home prices YoY
- -16.3%
- Rents YoY
- 5.5%
- Active inventory
- 345
- Price-to-rent
- 8.7×
Monthly cashflow live
- Estimated rent
- $2,092 high interval (Pro) →
- Mortgage (P&I)
- −$1,148
- Tax from tax record
- −$339 /mo · $4,069/yr
- Insurance
- −$91
- HOA
- −$0
- Vacancy / Maint / Mgmt
- −$439
- Net cashflow
- $74
Break-even live
Sensitivity live
| Price | -10% $198 | -5% $136 | +0% $74 | +5% $12 | +10% $-50 |
|---|---|---|---|---|---|
| Rent | -10% $-91 | -5% $-8 | +0% $74 | +5% $157 | +10% $239 |
| Rate | -1.0pp $184 | -0.5pp $130 | base $74 | +0.5pp $17 | +1.0pp $-40 |
UW: 25.0% down · 7.5% · 30yr · 1.5% tax · 5.0% vac · 8.0% maint · 8.0% mgmt
Financing live
Cash to close
- Down payment
- $54,750
- Closing costs
- $6,570
- Reserves months
- —
- Total cash needed
- —
Loan-product check · same deal, 3 products live
Conventional
25% down · 7.5% · 30yr
- Down + closing
- —
- Monthly P&I
- —
- Monthly cashflow
- —
- DSCR
- —
- Eligible?
- —
Personal DTI + credit; lowest rate.
DSCR
20% down · 8.5% · 30yr
- Down + closing
- —
- Monthly P&I
- —
- Monthly cashflow
- —
- DSCR
- —
- Eligible?
- —
No personal income docs; deal must DSCR.
Hard money
10% down · 12.0% · 12mo
- Down + closing
- —
- Monthly P&I
- —
- Monthly cashflow
- —
- DSCR
- —
- Eligible?
- —
Short-term bridge; refi at stabilization.
Rent comps 29 comps
| Address | Beds | Baths | Sqft | Rent | $/sqft | DOM | Units | Dist |
|---|---|---|---|---|---|---|---|---|
| 5818 Glenhurst Dr Houston, TX | 3.0 | 2.0 | 1441 | $1,750 | $1.21 | 1d | 1 | 0.04mi |
| 5942 Ridgeway Dr Houston, TX | 4.0 | 2.0 | 1490 | $2,250 | $1.51 | 45d | 1 | 0.23mi |
| 5767 Belcrest St Houston, TX | 4.0 | 2.0 | 1480 | $1,790 | $1.21 | 45d | 1 | 0.42mi |
| 5954 Doolittle Blvd Houston, TX | 3.0 | 2.0 | 1371 | $1,575 | $1.15 | 45d | 1 | 0.46mi |
| 5623 Bellfort St Houston, TX | 4.0 | 1.0 | 1320 | $1,700 | $1.29 | 16d | 1 | 0.48mi |
| 6850 Southbank St Unit A Houston, TX | 3.0 | 3.0 | 2000 | $2,200 | $1.10 | 6d | 1 | 0.51mi |
| 6850 Southbank St Unit A Houston, TX | 3.0 | 3.0 | 2000 | $2,200 | $1.10 | 5d | 1 | 0.51mi |
| 5314 Longmeadow St Houston, TX | 3.0 | 3.0 | 1646 | $1,900 | $1.15 | 45d | 1 | 0.55mi |
| 5201 Kenilwood Dr Unit B Houston, TX | 3.0 | 2.0 | 2442 | $1,725 | $0.71 | 15d | 1 | 0.69mi |
| 5222 Northridge Dr Houston, TX | 4.0 | 2.0 | 1300 | $1,850 | $1.42 | 26d | 1 | 0.70mi |
| 7339 Krueger Rd Houston, TX | 3.0 | 2.0 | 2440 | $1,900 | $0.78 | 45d | 1 | 0.75mi |
| 5317 Chennault Rd Unit A Houston, TX | 3.0 | 2.5 | 1608 | $1,849 | $1.15 | 0d | 1 | 0.91mi |
| 7710 Darnay Dr Houston, TX | 3.0 | 3.0 | 1635 | $2,095 | $1.28 | 45d | 1 | 0.91mi |
| 5407 Thrush Dr Houston, TX | 4.0 | 1.0 | 1407 | $1,495 | $1.06 | 15d | 1 | 0.95mi |
| 7358 Guadalcanal Rd Houston, TX | 3.0 | 3.0 | 1768 | $2,195 | $1.24 | 45d | 1 | 1.02mi |
| 4942 Bataan Rd Unit 77033 Houston, TX | 4.0 | 2.0 | 1350 | $1,800 | $1.33 | 45d | 1 | 1.09mi |
| 5036 Mallow St Houston, TX | 3.0 | 3.0 | 1472 | $2,050 | $1.39 | 45d | 1 | 1.14mi |
| 6419 Belarbor St Houston, TX | 3.0 | 1.0 | 1240 | $1,425 | $1.15 | 45d | 1 | 1.17mi |
| 4835 Sunflower St Unit 1546466P Houston, TX | 3.0 | 2.0 | 1883 | $4,516 | $2.40 | 16d | 1 | 1.27mi |
| 9509 Merle St Unit 9509A Houston, TX | 4.0 | 2.5 | 1404 | $1,500 | $1.07 | 45d | 1 | 1.29mi |
| 8107 Calhoun Rd Houston, TX | 3.0 | 2.5 | 1304 | $2,250 | $1.73 | 26d | 1 | 1.31mi |
| 4613 Bricker St Unit B Houston, TX | 3.0 | 2.5 | 1600 | $2,300 | $1.44 | 45d | 1 | 1.41mi |
| 4609 Bricker St Unit B Houston, TX | 3.0 | 2.5 | 1300 | $3,500 | $2.69 | 14d | 1 | 1.43mi |
| 4609 Bricker St Unit ABC Houston, TX | 3.0 | 2.5 | 1375 | $3,500 | $2.55 | 13d | 1 | 1.43mi |
| 4601 White Rock St Unit A Houston, TX | 3.0 | 2.5 | 1700 | $2,500 | $1.47 | 45d | 1 | 1.46mi |
| 4918 Wilmington St Unit A Houston, TX | 3.0 | 3.0 | 1300 | $2,100 | $1.62 | 45d | 1 | 1.46mi |
| 6301 Iron Rock St Houston, TX | 5.0 | 3.0 | 1689 | $2,099 | $1.24 | 3d | 1 | 1.47mi |
| 4723 Mallow St Houston, TX | 3.0 | 2.5 | 1472 | $1,850 | $1.26 | 7d | 1 | 1.47mi |
| 5012 Higgins St Unit B Houston, TX | 3.0 | 2.5 | 1611 | $1,650 | $1.02 | 26d | 1 | 1.48mi |
Listing history 38 events
-
2026-06-21days on market $219,000 Active 46 DOM
-
2026-06-18days on market $219,000 Active 43 DOM
-
2026-06-17days on market $219,000 Active 42 DOM
-
2026-06-16days on market $219,000 Active 41 DOM
-
2026-06-15days on market $219,000 Active 40 DOM
-
2026-06-13days on market $219,000 Active 38 DOM
-
2026-06-10days on market $219,000 Active 34 DOM
-
2026-06-08days on market $219,000 Active 33 DOM
-
2026-06-07days on market $219,000 Active 32 DOM
-
2026-06-04days on market $219,000 Active 29 DOM
-
2026-06-01days on market $219,000 Active 26 DOM
-
2026-05-31days on market $219,000 Active 25 DOM
-
2026-05-06$219,000 Active 331-char remark
-
2025-11-01historical $1,695
-
2025-10-20$1,695
-
2025-10-19historical $1,795
-
2025-09-30$1,795
-
2025-09-29historical $1,895
-
2025-09-26$1,895
-
2025-09-25historical $1,995
-
2025-08-27$1,995
-
2025-08-26historical
-
2025-08-06price $219,900
-
2025-07-16price $235,000
-
2025-06-10$249,900 Active
-
2025-03-08historical $1,895
-
2025-03-06$1,895
-
2024-04-02historical $1,795
-
2024-03-19$1,795
-
2024-03-19historical $1,895
-
2024-03-02historical $1,895
-
2024-03-02$1,895
-
2024-02-20$2,000
-
2023-10-07soldstatus Sold
Show marketing remark (50 chars)
Investors Special near Medical Center. Needs rehab
-
2023-10-03soldstatus
-
2023-09-12status Pending
Show marketing remark (50 chars)
Investors Special near Medical Center. Needs rehab
-
2023-09-01$109,000 Active
Show marketing remark (50 chars)
Investors Special near Medical Center. Needs rehab
-
1988-01-02soldstatus
ⓘ Source: listings_history table (triggers on properties + properties_extension) + one-shot
backfill from property_details.listing_events for pre-trigger history.
Tax reassessment forecast TX · Resets to sale price
- Current annual tax
- $4,069 · $339/mo
- Projected year-2 tax
- $4,069 · $339/mo
- Expected delta
- $0/yr ($0/mo · 0.0%)
ⓘ Screening estimate from a state-policy table — verify with the county assessor before closing.
Climate risk First Street
- Flood 6/10 Major FEMA zone X (unshaded) · 71% chance over 30 yrs
- Wildfire 1/10 Low
- Heat 9/10 Extreme 6 d/yr ≥109°F today · 18 d/yr by 30 yrs out
- Wind 9/10 Extreme 99% chance of damaging wind over 30 yrs
- Air quality 2/10 Low 2 unhealthy d/yr today · 2 by 30 yrs out
Nearby sold comps map
Loading sold comps map…
Walkable amenities ~0.75 mi
Loading nearby amenities…
Taxation est. · year 1
- Rental income
- $25,109
- − Mortgage interest
- −$12,267
- − Property taxes
- −$4,069
- − Insurance
- −$1,095
- − Repairs & maintenance
- −$2,009
- − Management
- −$2,009
- − Depreciation
- −$6,371
- Taxable loss
- −$2,711
- Est. tax savings @ 24.0%
- +$651
- After-tax cash flow
- $1,541/yr
For passive investors: Depreciation is non-cash, so a rental often shows a tax loss while cash-flowing — sheltering income. Rental losses are passive: they offset passive income freely, and up to $25,000/yr can offset ordinary (W-2) income if you actively participate and your MAGI is under $100k (phasing out to $0 by $150k); unused losses carry forward. On sale, claimed depreciation is recaptured at up to 25%, and gains may owe capital-gains tax (a 1031 exchange can defer both). Figures are a year-1 estimate at your 24.0% rate — not tax advice; consult a CPA.
Schools (NCES district)
- District
- Houston ISD
- NCES district ID
- 4823640
- Math proficiency
- 27% ▼ -18.00%
- Reading proficiency
- 35% ▼ -6.00%
- Median HH income
- $46,054
- Composite
- 26.63/100
- National rank
- #7173
- State rank
- #593 of 826 in TX
Livability — Houston
- Score
- 74/100
- State rank
- #184
- US rank
- #4771
Category grades
Schools grade is shown separately in the Schools card above.
Census & demographics
- Census place
- Houston, TX
- County
- Harris County · 4,702,590 people
- City population
- 3,226,434
- Metro
- Houston-The Woodlands-Sugar Land, TX
- Population (ZIP)
- 29,154
- Household income
- $38,071
- Rent vs Own
- Severe rent burden
- 1728.0
Population outlook (Harris County) Hauer SSP2
- Today (2025)
- 5,571,493 people
- By 2030
- 6,089,821 · +9.3%
- By 2040
- 7,142,806 · +28.2%
- By 2050
- 8,185,864 · +46.9%
- By 2075
- 10,574,329 · +89.8%
- By 2100
- 12,109,958 · +117.4%
Race, ethnicity, and origin ACS 2023
- Neighborhood character
- Majority Black (55%)
- Race & ethnicity
- Black 55% Hispanic / Latino 43% Two or more races 17% Native American 1%
- Hispanic origin (detail)
- Mexican 35%
- Common ancestry
- Lithuanian 1%
- Foreign-born
- 18% · Canada
- Languages at home
- 61% English-only · Spanish 39%
Political lean MEDSL · Harris
- 2024 margin
- Lean D (+5.5) · D 52.0% · R 46.4% · Other 1.6%
- 2008→2024 swing
- +3.9pp toward D · 2008: 1.6pp · 2024: 5.5pp
- All cycles
- 2024: D+5.5 2020: D+13.3 2016: D+12.4 2012: D+0.1 2008: D+1.6
Not yet ingested
- Civics
- —
Market trends
- HPI YoY
- ▼ -41.49%
- Current HPI
- 212.6472
- Rent YoY
- ▲ 5.45%
- Metro
- Houston-The Woodlands-Sugar Land, TX
- State GDP YoY
- ▲ 3.95%
- F500 in state
- 110
Industry mix (Fortune 500 HQ in TX)
| Industry | F500 HQs | Revenue |
|---|---|---|
| Energy | 16 | $1,198B |
|
||
| Technology | 5 | $198B |
|
||
| Engineering / Construction | 4 | $72B |
|
||
| Energy Services | 3 | $60B |
|
||
| Utilities | 3 | $41B |
|
||
| Healthcare | 2 | $330B |
|
||
Price history
+100.9% since first listed26 events — show timeline
- 2026-05-06 Listed $219,000 HARMLS
- 2025-11-01 Rental Removed $1,695 HARMLS
- 2025-10-20 Listed for Rent $1,695 HARMLS
- 2025-10-19 Rental Removed $1,795 HARMLS
- 2025-09-30 Listed for Rent $1,795 HARMLS
- 2025-09-29 Rental Removed $1,895 HARMLS
- 2025-09-26 Listed for Rent $1,895 HARMLS
- 2025-09-25 Rental Removed $1,995 HARMLS
- 2025-08-27 Listed for Rent $1,995 HARMLS
- 2025-08-26 Listing Removed — HARMLS
- 2025-08-06 Price Changed $219,900 HARMLS
- 2025-07-16 Price Changed $235,000 HARMLS
- 2025-06-10 Listed $249,900 HARMLS
- 2025-03-08 Rental Removed $1,895 HARMLS
- 2025-03-06 Listed for Rent $1,895 HARMLS
- 2024-04-02 Rental Removed $1,795 HARMLS
- 2024-03-19 Listed for Rent $1,795 HARMLS
- 2024-03-19 Rental Removed $1,895 HARMLS
- 2024-03-02 Rental Removed $1,895 HARMLS
- 2024-03-02 Listed for Rent $1,895 HARMLS
- 2024-02-20 Listed for Rent $2,000 HARMLS
- 2023-10-07 Sold (MLS) — HARMLS
- 2023-10-03 Sold (Public Records) — Public Records
- 2023-09-12 Pending — HARMLS
- 2023-09-01 Listed $109,000 HARMLS
- 1988-01-02 Sold (Public Records) — Public Records
Property tax history
+6.6%/yrLatest (2025): $4,069 · +1.5% YoY. Source: county tax records.
Cash-flow waterfall
monthlySold comps — $/sqft
last 12 mo · ≤1 miLoading sold comps…