19570 E Highway 24 · Woodland Park, CO
Flood risk 1/10 · Minimal
- FEMA flood zone
- X (unshaded)
- Chance of flooding over 30 yrs
- 0.0%
- Est. flood insurance / yr
- $507 – $1,088
Fire risk 8/10 · Major
- Est. fire insurance / yr
- $939 – $1,743
Heat risk 1/10 · Minimal
- Hot days now (above 81°F)
- 10 days/yr
- Hot days in 30 yrs
- 28 days/yr
Wind risk 2/10 · Minimal
- Chance of severe wind over 30 yrs
- —
Air-quality risk 2/10 · Minimal
- Unhealthy air days now
- 1 days/yr
- Unhealthy air days in 30 yrs
- 1 days/yr
Risk factors via First Street. Map © Google.
Why this score? — see what drove the B grade
The composite is a weighted blend of 9 inputs, each scored 0–100. Each bar is that input's sub-score; the figure is the points it added to the 100-point composite (weight × sub-score).
- Cash flow +30.0/30.0
- 1% rule +10.0/10.0
- DSCR +10.0/10.0
- ARV discount +7.5/15.0
- Livability +3.6/5.0
- Rent growth +3.4/5.0
- Schools +3.4/10.0
- Condition / age +2.5/5.0
- Appreciation +0.0/10.0
$65,000
🖨 Deal sheet 📄 Offer letter ✓ Due diligence
Listing remarks
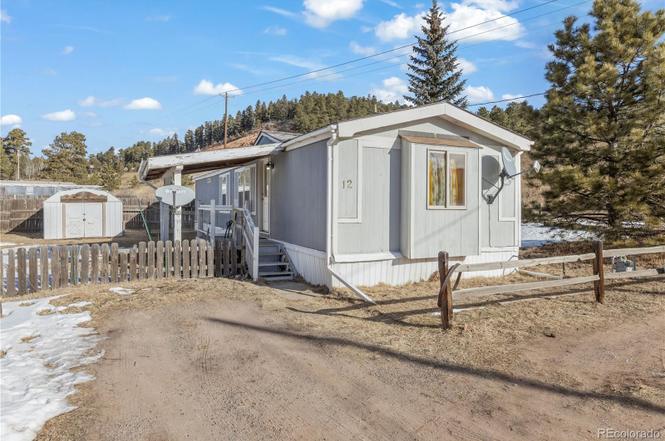
What a great opportunity to own a home in Woodland Park! The interior features numerous upgrades that add comfort and style throughout. A cozy wood-burning fireplace will keep you warm on chilly mountain evenings. Enjoy outdoor living on the covered deck, and the fenced yard offers space for pets, gardening, or relaxation. Potential owner-carry terms may be available, making this an excellent opportunity for qualified buyers.
Key facts
- Covered deck
- Fenced yard
- 2 parking spots
Tags
Property features AI
Finance
- Other: Owned by an agent-owner
- HOA & community: Located in Woodland Village Mobile Home Park; Land lease of $700 per month (lease expires June 24, 2027)
Exterior
- Parking: Two off-street parking spaces (2 total)
- Utilities: Public sewer
- Home design: Manufactured home located in a park; Faces southwest; Single-story/main-level living
- Construction: Wood siding; Shingle roof; Built as a manufactured home; Approximately 1,024 square feet of living area
- Exterior features: Dog run; Covered porch; Deck; Front porch
Interior
- Kitchen: Main-level kitchen (approx. 12 x 15)
- Bedrooms: One bedroom on the main level (approx. 12 x 15)
- Bathrooms: One full bathroom on the main level
- Heating & cooling: Electric heating available; Wood heating with wood stove
- Interior features: Main-level layout; Covered front porch; Deck; Dog run
- Laundry & utility: Main-level laundry room
Neighborhood map
What this means for you Summary
Snapshot
- This is a 1-bed/1.0-bath land listed at $65k.
Deal economics
- At list price, monthly cash flow is $982 ($12k/yr) — positive.
- The deal already cash-flows at list — no discount required.
- Meets the 1% rule at list price ($2k rent vs $65k).
- Recommended offer: $59k (9.0% below list) — sets the bar for market timing.
- Cap rate 24.4% vs local median 3.5% in Woodland Park — top-decile yield for the area; either an underpriced asset or a hidden risk that comps aren't pricing in. Stress-test before assuming the spread holds.
Location & tenants
- Location reads 71/100 on livability (#78 in CO) — a middle-class / working-renter tenant base. Strengths: housing A+, crime A, health & safety A; Watch: commute F, cost of living F.
- Woodland Park School District No. Re-2 (town): math 28% / reading 47% proficiency, ranked #29 of 86 in CO (top 34%) — families likely to look elsewhere, expect single-tenant / working-renter base with shorter leases.
- Zoned schools: Gateway Elementary School (math 15% / reading 37%, grade F, #581 of 966 statewide, top 61%, 293 students, 36% FRL); Woodland Park Middle School (math 27% / reading 47%, grade F, #95 of 270 statewide, top 37%, 386 students, 34% FRL); Woodland Park High School (math 37% / reading 62%, grade D, #115 of 381 statewide, top 34%, 579 students, 33% FRL).
- Market conditions: Rents rising (+3.6%/yr); 245 active listings in the ZIP; 1 comparable units currently listed for rent nearby; solid renter incomes; 148 units permitted in Teller County in 2024 (0 in 5+ unit buildings).
Forward outlook
- Local home prices are declining (-3.0%/yr); year-one equity from $449 of loan paydown is wiped out by about $2k of value loss. Plan a longer hold.
- Teller County population projected at -22% by 2050 — secular population decline; favor cash flow + early exit over multi-decade hold.
- At projected returns (-3.0% appreciation + 3.6% rent growth), your $18k cash investment doubles in ~2 years — after that, you're playing with house money.
Negotiation context
- It's been on market 120 days — a 9% lower offer ($59k) is reasonable based on typical stale-listing flexibility.
Risks & watch-outs
- Climate carrying-cost: severe wildfire risk — expect insurance premiums to compound above CPI over the hold.
Questions for the listing agent
- It's been on market 120 days. Have you received any prior offers? Is the seller open to a 9% concession, seller financing, or rate buy-down credit?
- Why hasn't it sold? Are there any deal-killer items the seller is aware of (foundation, flood, title, zoning, code violations)?
- Is there a deadline driving the sale (1031 exchange, divorce, estate, relocation)? That informs how much negotiation room exists.
- What's the average days-on-market for RENTAL listings here right now (not sales)? A rising rental-DOM trend means longer vacancies and softer asking-rent achievability than the comps imply.
- What's the recent tenant-quality profile in this submarket — average credit score on applications, eviction rate, late-payment / NSF rate, and stable-employment percentage? A property-management company in the area should have these aggregated.
- How much new for-sale + rental construction is in the pipeline within 1–3 miles? Heavy new supply typically softens prices + rents 12–24 months out; constrained supply supports both.
Investment metrics
- 1% rule
- 2.79% ✓
- Cap rate
- 24.42%
- Cash-on-cash
- 64.74%
- DSCR
- 3.88
- GRM
- 3.0
CMA / ARV
No comps found within radius.
Projected returns pro-forma
-3.0% appreciation · 3.64% rent growth · sell at horizon
- IRR
- 64.6%
- Equity multiple
- 3.92×
- Total profit
- $53,205
- Equity at exit
- $9,692
- IRR
- 69.2%
- Equity multiple
- 8.24×
- Total profit
- $131,846
- Equity at exit
- $5,620
Cash invested: $18,200 (down + closing). Projections, not guarantees.
Landlord ↔ Tenant lean methodology
- Overall (STATE)
- 38 Tenant-Leaning
- State Colorado
- 38 Tenant-Leaning · D+4
- County
- — inherits STATE
- City
- — inherits STATE
ZIP-level market 80863
- Home prices YoY
- -29.8%
- Rents YoY
- 3.6%
- Active inventory
- 245
- Price-to-rent
- 3.0×
Monthly cashflow live
- Estimated rent
- $1,811 medium interval (Pro) →
- Mortgage (P&I)
- −$341
- Tax est. 1.5%
- −$81 /mo · $975/yr
- Insurance
- −$27
- HOA
- −$0
- Vacancy / Maint / Mgmt
- −$380
- Net cashflow
- $982
Break-even live
UW: 25.0% down · 7.5% · 30yr · 1.5% tax · 5.0% vac · 8.0% maint · 8.0% mgmt
Financing live
Cash to close
- Down payment
- $16,250
- Closing costs
- $1,950
- Reserves months
- —
- Total cash needed
- —
Loan-product check · same deal, 3 products live
Conventional
25% down · 7.5% · 30yr
- Down + closing
- —
- Monthly P&I
- —
- Monthly cashflow
- —
- DSCR
- —
- Eligible?
- —
Personal DTI + credit; lowest rate.
DSCR
20% down · 8.5% · 30yr
- Down + closing
- —
- Monthly P&I
- —
- Monthly cashflow
- —
- DSCR
- —
- Eligible?
- —
No personal income docs; deal must DSCR.
Hard money
10% down · 12.0% · 12mo
- Down + closing
- —
- Monthly P&I
- —
- Monthly cashflow
- —
- DSCR
- —
- Eligible?
- —
Short-term bridge; refi at stabilization.
Rent comps 1 comps
| Address | Beds | Baths | Sqft | Rent | $/sqft | DOM | Units | Dist |
|---|---|---|---|---|---|---|---|---|
| 704 Stone Park Ln Woodland Park, CO | 1.0–3.0 | 1.0–2.0 | 1054 | $2,089 | $1.98 | 1d | 8 | 0.85mi |
Listing history 16 events
-
2026-06-18days on market $65,000 Active 120 DOM
-
2026-06-17days on market $65,000 Active 119 DOM
-
2026-06-16days on market $65,000 Active 118 DOM
-
2026-06-15days on market $65,000 Active 117 DOM
-
2026-06-14days on market $65,000 Active 115 DOM
-
2026-06-13days on market $65,000 Active 114 DOM
-
2026-06-10days on market $65,000 Active 112 DOM
-
2026-06-09days on market $65,000 Active 111 DOM
-
2026-06-08days on market $65,000 Active 110 DOM
-
2026-06-07days on market $65,000 Active 109 DOM
-
2026-06-03days on market $65,000 Active 105 DOM
-
2026-06-03days on market $65,000 Active 104 DOM
-
2026-06-01days on market $65,000 Active 103 DOM
-
2026-05-31days on market $65,000 Active 102 DOM
-
2026-02-18$65,000 Active
-
2007-02-27soldstatus $3,280,000
ⓘ Source: listings_history table (triggers on properties + properties_extension) + one-shot
backfill from property_details.listing_events for pre-trigger history.
Climate risk First Street
- Flood 1/10 Low FEMA zone X (unshaded) · 0% chance over 30 yrs
- Wildfire 8/10 Severe
- Heat 1/10 Low 10 d/yr ≥81°F today · 28 d/yr by 30 yrs out
- Wind 2/10 Low
- Air quality 2/10 Low 1 unhealthy d/yr today · 1 by 30 yrs out
Nearby sold comps map
Loading sold comps map…
Walkable amenities ~0.75 mi
Loading nearby amenities…
Taxation est. · year 1
- Rental income
- $21,738
- − Mortgage interest
- −$3,641
- − Property taxes
- −$975
- − Insurance
- −$325
- − Repairs & maintenance
- −$1,739
- − Management
- −$1,739
- − Depreciation
- −$1,891
- Taxable income
- $11,428
- Est. tax owed @ 24.0%
- −$2,743
- After-tax cash flow
- $9,040/yr
For passive investors: Depreciation is non-cash, so a rental often shows a tax loss while cash-flowing — sheltering income. Rental losses are passive: they offset passive income freely, and up to $25,000/yr can offset ordinary (W-2) income if you actively participate and your MAGI is under $100k (phasing out to $0 by $150k); unused losses carry forward. On sale, claimed depreciation is recaptured at up to 25%, and gains may owe capital-gains tax (a 1031 exchange can defer both). Figures are a year-1 estimate at your 24.0% rate — not tax advice; consult a CPA.
Schools (NCES district)
- District
- Woodland Park School District No. Re-2
- NCES district ID
- 0807380
- Math proficiency
- 28% ▼ -3.00%
- Reading proficiency
- 47% ▼ -2.00%
- Median HH income
- $63,920
- Composite
- 33.68/100
- National rank
- #5385
- State rank
- #29 of 86 in CO
Livability — Woodland Park
- Score
- 71/100
- State rank
- #78
- US rank
- #7181
Category grades
Schools grade is shown separately in the Schools card above.
Census & demographics
- Census place
- Woodland Park, CO
- County
- Teller County · 12,329 people
- City population
- 12,329
- Metro
- Colorado Springs, CO
- Population (ZIP)
- 12,329
- Household income
- $104,779
- Rent vs Own
- Severe rent burden
- 418.0
Population outlook (Teller County) Hauer SSP2
- Today (2025)
- 22,404 people
- By 2030
- 21,527 · -3.9%
- By 2040
- 19,356 · -13.6%
- By 2050
- 17,462 · -22.1%
- By 2075
- 14,658 · -34.6%
- By 2100
- 11,982 · -46.5%
Race, ethnicity, and origin ACS 2023
- Neighborhood character
- Predominantly White (85%)
- Race & ethnicity
- White 85% Two or more races 10% Hispanic / Latino 5% Black 1%
- Hispanic origin (detail)
- Mexican 3%
- Common ancestry
- Slovak 4% Lithuanian 3% Italian 3%
- Foreign-born
- 3% · South Korea
- Languages at home
- 97% English-only · Spanish 1% German/W. Germanic 1% Russian/Polish/Slavic 1%
Political lean MEDSL · Teller
- 2024 margin
- Solid R (+35.5) · D 31.0% · R 66.5% · Other 2.5%
- 2008→2024 swing
- -7.3pp toward R · 2008: -28.1pp · 2024: -35.5pp
- All cycles
- 2024: R+35.5 2020: R+35.2 2016: R+42.5 2012: R+33.1 2008: R+28.1
Not yet ingested
- Civics
- —
Market trends
- HPI YoY
- ▼ -129.47%
- Current HPI
- 304.4625
- Rent YoY
- ▲ 3.64%
- Metro
- Colorado Springs, CO
- State GDP YoY
- ▲ 1.95%
- F500 in state
- 14
Industry mix (Fortune 500 HQ in CO)
| Industry | F500 HQs | Revenue |
|---|---|---|
| Technology Distribution | 1 | $31B |
|
||
| Food / Agriculture | 1 | $18B |
|
||
| Packaging | 1 | $14B |
|
||
| Healthcare | 1 | $13B |
|
||
| Energy | 1 | $10B |
|
||
| Technology | 1 | $4B |
|
||
Price history
-98.0% since first listed2 events — show timeline
- 2026-02-18 Listed $65,000 REColorado as Distributed by MLS Grid
- 2007-02-27 Sold (Public Records) $3,280,000 Public Records
Property tax history
+11.0%/yrLatest (2022): $58 · -2.2% YoY. Source: county tax records.
Cash-flow waterfall
monthlySold comps — $/sqft
last 12 mo · ≤1 miLoading sold comps…