100 Cattle Bnd · Niederwald, TX
Flood risk 1/10 · Minimal
- FEMA flood zone
- X (unshaded)
- Chance of flooding over 30 yrs
- 0.0%
- Est. flood insurance / yr
- $507 – $1,088
Fire risk 6/10 · Moderate
- Est. fire insurance / yr
- $1,222 – $2,270
Heat risk 8/10 · Major
- Hot days now (above 108°F)
- 7 days/yr
- Hot days in 30 yrs
- 22 days/yr
Wind risk 8/10 · Major
- Chance of severe wind over 30 yrs
- 80.0%
Air-quality risk 1/10 · Minimal
- Unhealthy air days now
- 0 days/yr
- Unhealthy air days in 30 yrs
- 0 days/yr
Risk factors via First Street. Map © Google.
Why this score? — see what drove the C grade
The composite is a weighted blend of 9 inputs, each scored 0–100. Each bar is that input's sub-score; the figure is the points it added to the 100-point composite (weight × sub-score).
- Cash flow +19.7/30.0
- ARV discount +14.2/15.0
- DSCR +6.2/10.0
- 1% rule +4.0/10.0
- Schools +3.5/10.0
- Livability +2.9/5.0
- Condition / age +2.5/5.0
- Rent growth +2.4/5.0
- Appreciation +0.0/10.0
$230,000
🖨 Deal sheet 📄 Offer letter ✓ Due diligence
Listing remarks MLS
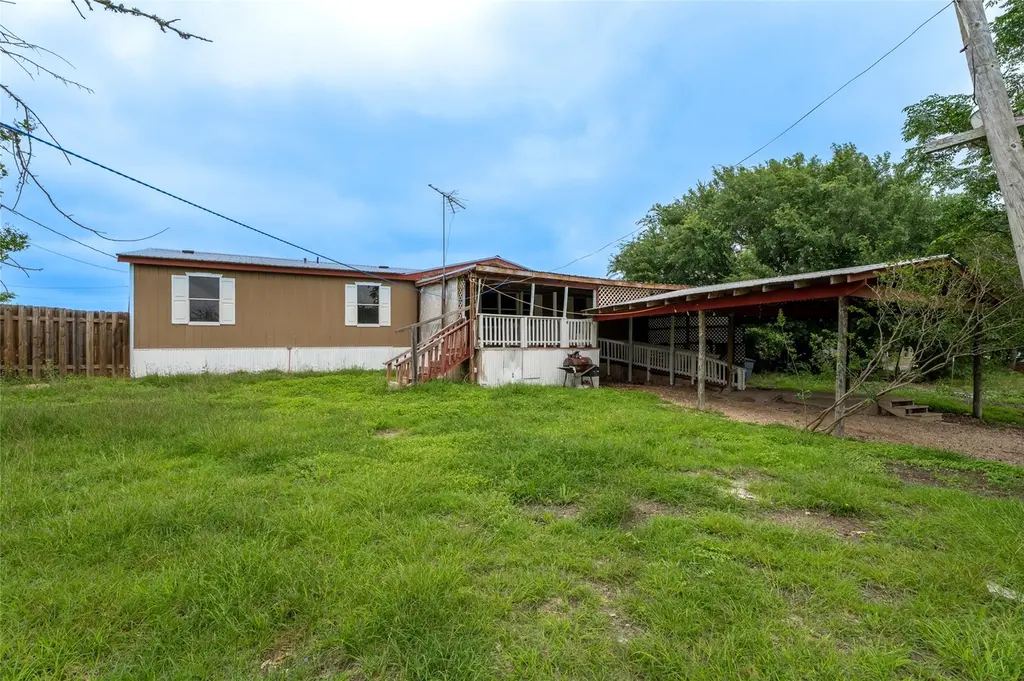
Enjoy country living in this spacious double-wide manufactured home set on 1 acre. Featuring an open-concept floor plan, 4 bedrooms, and plenty of room to grow, this property offers great value and opportunity . AC recently updated
Key facts
- Recently updated ac
- 1.06 acre lot
- 6 parking spots
Tags
Neighborhood map
What this means for you Summary
Snapshot
- This is a 4-bed/2.0-bath manufactured listed at $230k.
Deal economics
- At list price, monthly cash flow is $268 ($3k/yr) — positive.
- The deal already cash-flows at list — no discount required.
- To meet the 1% rule (rent ≥ 1% of price), the offer needs to be $207k (9.9% below list).
- Recommended offer: $207k (9.9% below list) — sets the bar for 1% rule.
- Cap rate 7.7% vs local median 4.5% in Niederwald — top-decile yield for the area; either an underpriced asset or a hidden risk that comps aren't pricing in. Stress-test before assuming the spread holds.
Location & tenants
- Location reads 58/100 on livability (#1,198 in TX) — a working-class tenant base; expect higher turnover. Strengths: cost of living A+, housing A+, employment B; Watch: schools F, crime D-, amenities F.
- Hays CISD (rural): math 35% / reading 41% proficiency, ranked #390 of 826 in TX (top 47%) — families likely to look elsewhere, expect single-tenant / working-renter base with shorter leases.
- Market conditions: Rents soft (-0.3%/yr); 1801 active listings in the ZIP; solid renter incomes; 5,270 units permitted in Hays County in 2024 (1,464 in 5+ unit buildings).
Forward outlook
- Local home prices are declining (-3.0%/yr); year-one equity from $2k of loan paydown is wiped out by about $7k of value loss. Plan a longer hold.
- Hays County population projected at +93% by 2050 — long-run rental-demand tailwind backs the buy-and-hold thesis.
Negotiation context
- It's been on market 59 days — a 3% lower offer ($223k) is reasonable based on typical stale-listing flexibility.
- 2 sale attempts since 4y ago; this cycle's ask has dropped $20k (8%) from the opening price — seller is motivated, your offer sets the floor, not the list.
Risks & watch-outs
- Climate carrying-cost: severe wind risk, 80% chance of damaging wind over 30y; major wildfire risk; extreme-heat days projected 7→22/yr by 2055 (HVAC capex compounding) — expect insurance premiums to compound above CPI over the hold.
Questions for the listing agent
- It's been on market 59 days. Have you received any prior offers? Is the seller open to a 10% concession, seller financing, or rate buy-down credit?
- Is there a deadline driving the sale (1031 exchange, divorce, estate, relocation)? That informs how much negotiation room exists.
- Schools are F-rated, which usually means shorter tenancies and higher turnover. Who's the typical renter profile here, and what's been the actual vacancy rate?
- Crime grade is D in this area — have there been break-ins, vandalism, or insurance claims at this property in the last 3 years? What carrier currently insures it and at what premium?
- What's the average days-on-market for RENTAL listings here right now (not sales)? A rising rental-DOM trend means longer vacancies and softer asking-rent achievability than the comps imply.
- What's the recent tenant-quality profile in this submarket — average credit score on applications, eviction rate, late-payment / NSF rate, and stable-employment percentage? A property-management company in the area should have these aggregated.
- How much new for-sale + rental construction is in the pipeline within 1–3 miles? Heavy new supply typically softens prices + rents 12–24 months out; constrained supply supports both.
Investment metrics
- 1% rule
- 0.90% ✗
- Cap rate
- 7.69%
- Cash-on-cash
- 5.00%
- DSCR
- 1.22
- GRM
- 9.3
CMA / ARV
- ARV (median comp)
- $270,000
- List price
- $230,000
- Delta
- -11.11%
- Verdict
- UNDERPRICED
- Comps
- 3 within 2.0 mi
Projected returns pro-forma
-3.0% appreciation · 0.0% rent growth · sell at horizon
- IRR
- -11.6%
- Equity multiple
- 0.59×
- Total profit
- $-26,365
- Equity at exit
- $34,294
- IRR
- -6.9%
- Equity multiple
- 0.61×
- Total profit
- $-24,852
- Equity at exit
- $19,886
Cash invested: $64,400 (down + closing). Projections, not guarantees.
Landlord ↔ Tenant lean methodology
- Overall (STATE)
- 87 Strongly Landlord-Friendly
- State Texas
- 87 Strongly Landlord-Friendly · R+5
- County
- — inherits STATE
- City
- — inherits STATE
ZIP-level market 78640
- Home prices YoY
- -33.8%
- Rents YoY
- -0.3%
- Active inventory
- 1801
- Price-to-rent
- 9.3×
Monthly cashflow live
- Estimated rent
- $2,072 medium interval (Pro) →
- Mortgage (P&I)
- −$1,206
- Tax from tax record
- −$67 /mo · $799/yr
- Insurance
- −$96
- HOA
- −$0
- Vacancy / Maint / Mgmt
- −$435
- Net cashflow
- $268
Break-even live
UW: 25.0% down · 7.5% · 30yr · 1.5% tax · 5.0% vac · 8.0% maint · 8.0% mgmt
Financing live
Cash to close
- Down payment
- $57,500
- Closing costs
- $6,900
- Reserves months
- —
- Total cash needed
- —
Loan-product check · same deal, 3 products live
Conventional
25% down · 7.5% · 30yr
- Down + closing
- —
- Monthly P&I
- —
- Monthly cashflow
- —
- DSCR
- —
- Eligible?
- —
Personal DTI + credit; lowest rate.
DSCR
20% down · 8.5% · 30yr
- Down + closing
- —
- Monthly P&I
- —
- Monthly cashflow
- —
- DSCR
- —
- Eligible?
- —
No personal income docs; deal must DSCR.
Hard money
10% down · 12.0% · 12mo
- Down + closing
- —
- Monthly P&I
- —
- Monthly cashflow
- —
- DSCR
- —
- Eligible?
- —
Short-term bridge; refi at stabilization.
Listing history 19 events
-
2026-06-19price $230,000 Active 59 DOM
-
2026-06-18days on market $240,000 Active 59 DOM
-
2026-06-17days on market $240,000 Active 58 DOM
-
2026-06-16days on market $240,000 Active 57 DOM
-
2026-06-15days on market $240,000 Active 56 DOM
-
2026-06-13days on market $240,000 Active 54 DOM
-
2026-06-09days on market $240,000 Active 50 DOM
-
2026-06-08days on market $240,000 Active 49 DOM
-
2026-06-07days on market $240,000 Active 48 DOM
-
2026-06-05pricedays on market $240,000 Active 45 DOM
-
2026-06-03days on market $250,000 Active 44 DOM
-
2026-06-02days on market $250,000 Active 43 DOM
-
2026-06-01days on market $250,000 Active 42 DOM
-
2026-05-31days on market $250,000 Active 41 DOM
-
2026-04-20$250,000 Active 231-char remark
Show marketing remark (231 chars)
Enjoy country living in this spacious double-wide manufactured home set on 1 acre. Featuring an open-concept floor plan, 4 bedrooms, and plenty of room to grow, this property offers great value and opportunity . AC recently updated
-
2022-12-14soldstatus Closed 145-char remark
Show marketing remark (145 chars)
Great corner lot with many smaller trees throughout property. Nice size manufactured home with a massive front exterior deck and covered carport.
-
2022-12-05historical Active Under Contract 145-char remark
Show marketing remark (145 chars)
Great corner lot with many smaller trees throughout property. Nice size manufactured home with a massive front exterior deck and covered carport.
-
2022-11-14price $245,000 145-char remark
Show marketing remark (145 chars)
Great corner lot with many smaller trees throughout property. Nice size manufactured home with a massive front exterior deck and covered carport.
-
2022-10-26$295,000 Active 145-char remark
Show marketing remark (145 chars)
Great corner lot with many smaller trees throughout property. Nice size manufactured home with a massive front exterior deck and covered carport.
ⓘ Source: listings_history table (triggers on properties + properties_extension) + one-shot
backfill from property_details.listing_events for pre-trigger history.
Tax reassessment forecast TX · Resets to sale price
- Current annual tax
- $799 · $67/mo
- Projected year-2 tax
- $4,209 · $351/mo
- Expected delta
- +$3,410/yr (+$284/mo · 426.7%)
ⓘ Screening estimate from a state-policy table — verify with the county assessor before closing.
Climate risk First Street
- Flood 1/10 Low FEMA zone X (unshaded) · 0% chance over 30 yrs
- Wildfire 6/10 Major
- Heat 8/10 Severe 7 d/yr ≥108°F today · 22 d/yr by 30 yrs out
- Wind 8/10 Severe 80% chance of damaging wind over 30 yrs
- Air quality 1/10 Low 0 unhealthy d/yr today · 0 by 30 yrs out
Nearby sold comps map
Loading sold comps map…
Walkable amenities ~0.75 mi
Loading nearby amenities…
Taxation est. · year 1
- Rental income
- $24,862
- − Mortgage interest
- −$12,884
- − Property taxes
- −$799
- − Insurance
- −$1,150
- − Repairs & maintenance
- −$1,989
- − Management
- −$1,989
- − Depreciation
- −$6,691
- Taxable loss
- −$639
- Est. tax savings @ 24.0%
- +$153
- After-tax cash flow
- $3,372/yr
For passive investors: Depreciation is non-cash, so a rental often shows a tax loss while cash-flowing — sheltering income. Rental losses are passive: they offset passive income freely, and up to $25,000/yr can offset ordinary (W-2) income if you actively participate and your MAGI is under $100k (phasing out to $0 by $150k); unused losses carry forward. On sale, claimed depreciation is recaptured at up to 25%, and gains may owe capital-gains tax (a 1031 exchange can defer both). Figures are a year-1 estimate at your 24.0% rate — not tax advice; consult a CPA.
Schools (NCES district)
- District
- Hays CISD
- NCES district ID
- 4800010
- Math proficiency
- 35% ▼ -15.00%
- Reading proficiency
- 41% ▼ -5.00%
- Median HH income
- $70,570
- Composite
- 34.78/100
- National rank
- #5118
- State rank
- #390 of 826 in TX
Livability — Niederwald
- Score
- 58/100
- State rank
- #1198
- US rank
- #20995
Category grades
Schools grade is shown separately in the Schools card above.
Census & demographics
- County
- Hays County · 280,138 people
- Metro
- Austin-Round Rock-Georgetown, TX
- Population (ZIP)
- 77,531
- Household income
- $90,075
- Rent vs Own
- Severe rent burden
- 2552.0
Population outlook (Hays County) Hauer SSP2
- Today (2025)
- 286,948 people
- By 2030
- 336,923 · +17.4%
- By 2040
- 441,894 · +54.0%
- By 2050
- 553,462 · +92.9%
- By 2075
- 838,261 · +192.1%
- By 2100
- 1,063,658 · +270.7%
Race, ethnicity, and origin ACS 2023
- Neighborhood character
- Diverse neighborhood (Simpson 0.56)
- Race & ethnicity
- Hispanic / Latino 55% White 36% Two or more races 29% Black 5% Native American 1%
- Hispanic origin (detail)
- Mexican 47% Puerto Rican 1%
- Common ancestry
- Italian 2% Slovak 2% Lithuanian 1%
- Foreign-born
- 13% · Canada
- Languages at home
- 63% English-only · Spanish 35%
Political lean MEDSL · Hays
- 2024 margin
- Lean D (+5.7) · D 52.1% · R 46.5% · Other 1.4%
- 2008→2024 swing
- +7.7pp toward D · 2008: -2.0pp · 2024: 5.7pp
- All cycles
- 2024: D+5.7 2020: D+10.8 2016: R+0.9 2012: R+10.4 2008: R+2.0
Not yet ingested
- Civics
- —
Market trends
- HPI YoY
- ▼ -92.64%
- Current HPI
- 181.7969
- Rent YoY
- ▼ -0.34%
- Metro
- Austin-Round Rock-Georgetown, TX
- State GDP YoY
- ▲ 3.95%
- F500 in state
- 110
Industry mix (Fortune 500 HQ in TX)
| Industry | F500 HQs | Revenue |
|---|---|---|
| Energy | 16 | $1,198B |
|
||
| Technology | 5 | $198B |
|
||
| Engineering / Construction | 4 | $72B |
|
||
| Energy Services | 3 | $60B |
|
||
| Utilities | 3 | $41B |
|
||
| Healthcare | 2 | $330B |
|
||
Price history
-15.3% since first listed5 events — show timeline
- 2026-04-20 Listed $250,000 Unlock MLS
- 2022-12-14 Sold (MLS) — Unlock MLS
- 2022-12-05 Contingent — Unlock MLS
- 2022-11-14 Price Changed $245,000 Unlock MLS
- 2022-10-26 Listed $295,000 Unlock MLS
Property tax history
+1.6%/yrLatest (2018): $799 · +3.5% YoY. Source: county tax records.
Cash-flow waterfall
monthlySold comps — $/sqft
last 12 mo · ≤1 miLoading sold comps…