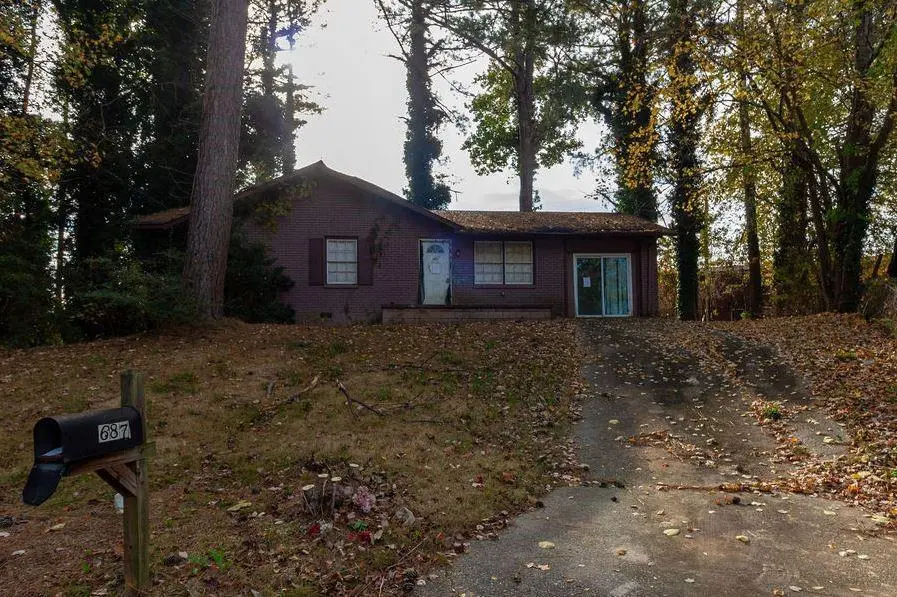
687 Utoy Ct · Jonesboro, GA
Flood risk 1/10 · Minimal
- FEMA flood zone
- X (unshaded)
- Chance of flooding over 30 yrs
- 0.0%
- Est. flood insurance / yr
- $507 – $1,088
Fire risk 3/10 · Minor
- Est. fire insurance / yr
- $963 – $1,789
Heat risk 6/10 · Moderate
- Hot days now (above 105°F)
- 7 days/yr
- Hot days in 30 yrs
- 19 days/yr
Wind risk 6/10 · Moderate
- Chance of severe wind over 30 yrs
- 27.0%
Air-quality risk 4/10 · Minor
- Unhealthy air days now
- 4 days/yr
- Unhealthy air days in 30 yrs
- 6 days/yr
Risk factors via First Street. Map © Google.
Why this score? — see what drove the B grade
The composite is a weighted blend of 9 inputs, each scored 0–100. Each bar is that input's sub-score; the figure is the points it added to the 100-point composite (weight × sub-score).
- Cash flow +29.4/30.0
- ARV discount +15.0/15.0
- DSCR +10.0/10.0
- 1% rule +8.7/10.0
- Livability +3.6/5.0
- Rent growth +3.0/5.0
- Condition / age +2.5/5.0
- Schools +1.3/10.0
- Appreciation +0.0/10.0
$119,500
🖨 Deal sheet 📄 Offer letter ✓ Due diligence
Listing remarks MLS
Flexible opportunity for both owner-occupants and investors alike. Nestled within a well-established neighborhood, this home offers convenient access to major commuter routes, everyday shopping, dining, and local essentials. A smart choice for buyers looking for a well-positioned property with long-term potential.
Key facts
- 0.29 acre lot
- 3 parking spots
- Built 1966
Neighborhood map
What this means for you Summary
Snapshot
- This is a 3-bed/1.0-bath single-family listed at $120k.
Deal economics
- At list price, monthly cash flow is $425 ($5k/yr) — positive.
- The deal already cash-flows at list — no discount required.
- Meets the 1% rule at list price ($2k rent vs $120k).
- Recommended offer: $112k (6.0% below list) — sets the bar for market timing.
- Cap rate 10.6% vs local median 5.0% in Jonesboro — top-decile yield for the area; either an underpriced asset or a hidden risk that comps aren't pricing in. Stress-test before assuming the spread holds.
Location & tenants
- Location reads 72/100 on livability (#63 in GA) — a middle-class / working-renter tenant base. Strengths: cost of living A+, housing A-; Watch: crime C-, employment D, schools F.
- Clayton County (suburban): math 11% / reading 20% proficiency, ranked #155 of 174 in GA (top 89%) — low school quality limits family demand, transient renter base, plan for 1-2y turnover; 78% free/reduced lunch — lower-income household profile, screen leases tightly.
- Market conditions: Rents rising (+2.1%/yr); 251 active listings in the ZIP; 16 comparable units currently listed for rent nearby; rentals leasing fast (median 11d on market — plan ~1-2 weeks tenant-placement turnaround); 865 units permitted in Clayton County in 2024 (448 in 5+ unit buildings).
- This rent runs 32% of the median local income ($62k/yr) — at the standard rent-burdened threshold; future hikes will face affordability resistance.
Forward outlook
- Local home prices are declining (-3.0%/yr); year-one equity from $826 of loan paydown is wiped out by about $4k of value loss. Plan a longer hold.
- Clayton County population projected at +29% by 2050 — long-run rental-demand tailwind backs the buy-and-hold thesis.
- At projected returns (-3.0% appreciation + 2.1% rent growth), your $33k cash investment doubles in ~9 years — after that, you're playing with house money.
Negotiation context
- It's been on market 87 days — a 6% lower offer ($112k) is reasonable based on typical stale-listing flexibility.
- 8 sale attempts since 18y ago; this cycle's ask has dropped $36k (23%) from the opening price — seller is motivated, your offer sets the floor, not the list.
- Current owner paid $40k; list at $120k implies a 199% gain — meaningful room to come down on a strong offer.
Risks & watch-outs
- Climate carrying-cost: major wind risk, 27% chance of damaging wind over 30y; extreme-heat days projected 7→19/yr by 2055 (HVAC capex compounding) — expect insurance premiums to compound above CPI over the hold.
Questions for the listing agent
- It's been on market 87 days. Have you received any prior offers? Is the seller open to a 6% concession, seller financing, or rate buy-down credit?
- Built in 1966 — when were the roof, HVAC, electrical panel, plumbing, and water heater last replaced?
- Why hasn't it sold? Are there any deal-killer items the seller is aware of (foundation, flood, title, zoning, code violations)?
- Is there a deadline driving the sale (1031 exchange, divorce, estate, relocation)? That informs how much negotiation room exists.
- Schools are F-rated, which usually means shorter tenancies and higher turnover. Who's the typical renter profile here, and what's been the actual vacancy rate?
- What's the average days-on-market for RENTAL listings here right now (not sales)? A rising rental-DOM trend means longer vacancies and softer asking-rent achievability than the comps imply.
- What's the recent tenant-quality profile in this submarket — average credit score on applications, eviction rate, late-payment / NSF rate, and stable-employment percentage? A property-management company in the area should have these aggregated.
- How much new for-sale + rental construction is in the pipeline within 1–3 miles? Heavy new supply typically softens prices + rents 12–24 months out; constrained supply supports both.
Investment metrics
- 1% rule
- 1.37% ✓
- Cap rate
- 10.56%
- Cash-on-cash
- 15.24%
- DSCR
- 1.68
- GRM
- 6.1
CMA / ARV
- ARV (median comp)
- $208,955
- List price
- $119,500
- Delta
- -42.81%
- Verdict
- UNDERPRICED
- Comps
- 20 within 1.0 mi
Show comp detail 3 sales within ~0.75 mi
| Address | Dist | Beds/Ba | Sqft | Sold | Price | $/sf | Match |
|---|---|---|---|---|---|---|---|
| 8469 Shiloh Ct | 0.26mi | 3/1.0 | 1,040 (+7%) | 6mo | $163,000 | $157 | 72 |
| 8590 Jonesboro Ct | 0.15mi | 3/1.0 | 1,040 (+7%) | 19mo | $170,900 | $164 | 66 |
| 8570 Kennesaw Ct | 0.23mi | 3/2.0 | 1,054 (+8%) | 23mo | $225,000 | $213 | 53 |
Match score weights: distance 35% · size 25% · config 20% · recency 20%. Top-matched comps best support the ARV.
Projected returns pro-forma
-3.0% appreciation · 2.06% rent growth · sell at horizon
- IRR
- 4.9%
- Equity multiple
- 1.19×
- Total profit
- $6,227
- Equity at exit
- $17,818
- IRR
- 13.4%
- Equity multiple
- 2.03×
- Total profit
- $34,317
- Equity at exit
- $10,332
Cash invested: $33,460 (down + closing). Projections, not guarantees.
Landlord ↔ Tenant lean methodology
- Overall (STATE)
- 90 Strongly Landlord-Friendly
- State Georgia
- 90 Strongly Landlord-Friendly · R+3
- County
- — inherits STATE
- City
- — inherits STATE
ZIP-level market 30238
- Home prices YoY
- -33.3%
- Rents YoY
- 2.1%
- Active inventory
- 251
- Price-to-rent
- 6.1×
Monthly cashflow live
- Estimated rent
- $1,635 high interval (Pro) →
- Mortgage (P&I)
- −$627
- Tax from tax record
- −$190 /mo · $2,278/yr
- Insurance
- −$50
- HOA
- −$0
- Vacancy / Maint / Mgmt
- −$343
- Net cashflow
- $425
Break-even live
UW: 25.0% down · 7.5% · 30yr · 1.5% tax · 5.0% vac · 8.0% maint · 8.0% mgmt
Financing live
Cash to close
- Down payment
- $29,875
- Closing costs
- $3,585
- Reserves months
- —
- Total cash needed
- —
Loan-product check · same deal, 3 products live
Conventional
25% down · 7.5% · 30yr
- Down + closing
- —
- Monthly P&I
- —
- Monthly cashflow
- —
- DSCR
- —
- Eligible?
- —
Personal DTI + credit; lowest rate.
DSCR
20% down · 8.5% · 30yr
- Down + closing
- —
- Monthly P&I
- —
- Monthly cashflow
- —
- DSCR
- —
- Eligible?
- —
No personal income docs; deal must DSCR.
Hard money
10% down · 12.0% · 12mo
- Down + closing
- —
- Monthly P&I
- —
- Monthly cashflow
- —
- DSCR
- —
- Eligible?
- —
Short-term bridge; refi at stabilization.
Rent comps 16 comps
| Address | Beds | Baths | Sqft | Rent | $/sqft | DOM | Units | Dist |
|---|---|---|---|---|---|---|---|---|
| 777 Jeb Stuart Dr Jonesboro, GA | 3.0 | 2.0 | 1040 | $1,700 | $1.63 | 44d | 1 | 0.25mi |
| 407 Fayetteville Rd Unit B Jonesboro, GA | 2.0 | 1.0 | 780 | $1,150 | $1.47 | 44d | 1 | 0.77mi |
| 407 Fayetteville Rd Jonesboro, GA | 2.0 | 1.0 | 896 | $1,375 | $1.53 | 24d | 1 | 0.77mi |
| 790 Dixon Rd Jonesboro, GA | 2.0 | 1.0–1.5 | 900 | $1,274 | $1.42 | 5d | 5 | 0.79mi |
| 8437 Pineland Dr Jonesboro, GA | 2.0 | 1.5 | 1031 | $1,300 | $1.26 | 10d | 1 | 0.82mi |
| 240 Flint River Rd Jonesboro, GA | 2.0–3.0 | 1.0–2.0 | 918 | $1,695 | $1.85 | 2d | 67 | 0.83mi |
| 109 North Ave Jonesboro, GA | 1.0–2.0 | 1.0 | 881 | $1,495 | $1.70 | 1d | 3 | 1.03mi |
| 1 Magnolia Cir Jonesboro, GA | 1.0–3.0 | 1.0–2.0 | 925 | $1,622 | $1.75 | 2d | 15 | 1.11mi |
| 8970 Cornell Dr Jonesboro, GA | 3.0 | 2.0 | 1040 | $1,585 | $1.52 | 44d | 1 | 1.18mi |
| 8542 Taylor Rd Riverdale, GA | 3.0 | 1.0 | 1120 | $1,435 | $1.28 | 5d | 1 | 1.25mi |
| 66 Darwin Dr Jonesboro, GA | 3.0 | 2.0 | 1118 | $1,425 | $1.27 | 4d | 1 | 1.25mi |
| 8202 Attleboro Dr Jonesboro, GA | 3.0 | 1.0 | 850 | $1,295 | $1.52 | 24d | 1 | 1.29mi |
| 8225 Attleboro Dr Jonesboro, GA | 3.0 | 2.0 | 1040 | $1,295 | $1.25 | 19d | 1 | 1.29mi |
| 100 Riverview Pl Jonesboro, GA | 1.0–3.0 | 1.0–2.0 | 1153 | $2,002 | $1.74 | 1d | 18 | 1.39mi |
| 8150 Flamingo Dr Jonesboro, GA | 3.0 | 2.0 | 1092 | $1,630 | $1.49 | 4d | 1 | 1.47mi |
| 112 Burkshire Ct Unit A Jonesboro, GA | 2.0 | 1.0 | 877 | $1,095 | $1.25 | 44d | 1 | 1.47mi |
Listing history 33 events
-
2026-06-18days on market $119,500 Active 87 DOM
-
2026-06-17days on market $119,500 Active 86 DOM
-
2026-06-16days on market $119,500 Active 85 DOM
-
2026-06-15days on market $119,500 Active 84 DOM
-
2026-06-13days on market $119,500 Active 82 DOM
-
2026-06-09days on market $119,500 Active 78 DOM
-
2026-06-08days on market $119,500 Active 77 DOM
-
2026-06-07days on market $119,500 Active 76 DOM
-
2026-06-04days on market $119,500 Active 73 DOM
-
2026-06-03days on market $119,500 Active 72 DOM
-
2026-06-02days on market $119,500 Active 71 DOM
-
2026-06-01days on market $119,500 Active 70 DOM
-
2026-05-31days on market $119,500 Active 69 DOM
-
2026-04-30price $119,500 315-char remark
Show marketing remark (315 chars)
Flexible opportunity for both owner-occupants and investors alike. Nestled within a well-established neighborhood, this home offers convenient access to major commuter routes, everyday shopping, dining, and local essentials. A smart choice for buyers looking for a well-positioned property with long-term potential.
-
2026-03-23$155,000 New 315-char remark
Show marketing remark (315 chars)
Flexible opportunity for both owner-occupants and investors alike. Nestled within a well-established neighborhood, this home offers convenient access to major commuter routes, everyday shopping, dining, and local essentials. A smart choice for buyers looking for a well-positioned property with long-term potential.
-
2026-03-23$155,000 Active 315-char remark
Show marketing remark (315 chars)
Flexible opportunity for both owner-occupants and investors alike. Nestled within a well-established neighborhood, this home offers convenient access to major commuter routes, everyday shopping, dining, and local essentials. A smart choice for buyers looking for a well-positioned property with long-term potential.
-
2026-03-17historical
-
2026-03-17historical
-
2025-12-19$160,300 Active
-
2025-12-19$160,300 New
-
2025-10-29historical
-
2025-10-29historical
-
2025-10-25$160,300 New
-
2025-10-25$160,300 Active
-
2016-05-01historical
-
2015-11-26$35,000 New
-
2011-06-18price $19,000
-
2011-02-10price $21,000
-
2009-08-06soldstatus $40,000
-
2008-11-06$38,000
-
1998-06-15soldstatus $90,000
-
1983-03-29soldstatus $37,000
ⓘ Source: listings_history table (triggers on properties + properties_extension) + one-shot
backfill from property_details.listing_events for pre-trigger history.
Tax reassessment forecast GA · Resets to sale price
- Current annual tax
- $2,278 · $190/mo
- Projected year-2 tax
- $2,278 · $190/mo
- Expected delta
- $0/yr ($0/mo · 0.0%)
ⓘ Screening estimate from a state-policy table — verify with the county assessor before closing.
Climate risk First Street
- Flood 1/10 Low FEMA zone X (unshaded) · 0% chance over 30 yrs
- Wildfire 3/10 Moderate
- Heat 6/10 Major 7 d/yr ≥105°F today · 19 d/yr by 30 yrs out
- Wind 6/10 Major 27% chance of damaging wind over 30 yrs
- Air quality 4/10 Moderate 4 unhealthy d/yr today · 6 by 30 yrs out
Nearby sold comps map
Loading sold comps map…
Walkable amenities ~0.75 mi
Loading nearby amenities…
Taxation est. · year 1
- Rental income
- $19,615
- − Mortgage interest
- −$6,694
- − Property taxes
- −$2,278
- − Insurance
- −$598
- − Repairs & maintenance
- −$1,569
- − Management
- −$1,569
- − Depreciation
- −$3,476
- Taxable income
- $3,432
- Est. tax owed @ 24.0%
- −$824
- After-tax cash flow
- $4,277/yr
For passive investors: Depreciation is non-cash, so a rental often shows a tax loss while cash-flowing — sheltering income. Rental losses are passive: they offset passive income freely, and up to $25,000/yr can offset ordinary (W-2) income if you actively participate and your MAGI is under $100k (phasing out to $0 by $150k); unused losses carry forward. On sale, claimed depreciation is recaptured at up to 25%, and gains may owe capital-gains tax (a 1031 exchange can defer both). Figures are a year-1 estimate at your 24.0% rate — not tax advice; consult a CPA.
Schools (NCES district)
- District
- Clayton County
- NCES district ID
- 1301230
- Math proficiency
- 11% ▼ -13.00%
- Reading proficiency
- 20% ▼ -9.00%
- Median HH income
- $42,266
- Composite
- 13.41/100
- National rank
- #9527
- State rank
- #155 of 174 in GA
Livability — Jonesboro
- Score
- 72/100
- State rank
- #63
- US rank
- #6030
Category grades
Schools grade is shown separately in the Schools card above.
Census & demographics
- County
- Clayton County · 230,153 people
- City population
- 93,280
- Metro
- Atlanta-Sandy Springs-Alpharetta, GA
- Population (ZIP)
- 43,191
- Household income
- $62,185
- Rent vs Own
- Severe rent burden
- 1992.0
Population outlook (Clayton County) Hauer SSP2
- Today (2025)
- 310,777 people
- By 2030
- 329,762 · +6.1%
- By 2040
- 368,052 · +18.4%
- By 2050
- 401,196 · +29.1%
- By 2075
- 472,488 · +52.0%
- By 2100
- 500,446 · +61.0%
Race, ethnicity, and origin ACS 2023
- Neighborhood character
- Predominantly Black (71%)
- Race & ethnicity
- Black 71% Hispanic / Latino 17% White 7% Two or more races 7%
- Hispanic origin (detail)
- Mexican 13% Puerto Rican 2%
- Foreign-born
- 11% · Canada, United Kingdom
- Languages at home
- 83% English-only · Spanish 14% French/Haitian/Cajun 1%
Political lean MEDSL · Clayton
- 2024 margin
- Solid D (+69.2) · D 84.3% · R 15.1%
- 2008→2024 swing
- +2.8pp toward D · 2008: 66.4pp · 2024: 69.2pp
- All cycles
- 2024: D+69.2 2020: D+70.9 2016: D+71.9 2012: D+70.1 2008: D+66.4
Not yet ingested
- Civics
- —
Market trends
- HPI YoY
- ▼ -105.48%
- Current HPI
- 211.6309
- Rent YoY
- ▲ 2.06%
- Metro
- Atlanta-Sandy Springs-Alpharetta, GA
- State GDP YoY
- ▲ 2.66%
- F500 in state
- 28
Industry mix (Fortune 500 HQ in GA)
| Industry | F500 HQs | Revenue |
|---|---|---|
| Paper / Packaging | 2 | $29B |
|
||
| Retail | 1 | $160B |
|
||
| Transportation / Logistics | 1 | $91B |
|
||
| Airlines | 1 | $62B |
|
||
| Consumer Goods | 1 | $47B |
|
||
| Utilities | 1 | $25B |
|
||
Price history
+223.0% since first listed20 events — show timeline
- 2026-04-30 Price Changed $119,500 FMLS
- 2026-04-30 Price Changed $119,500 GAMLS
- 2026-03-23 Listed $155,000 FMLS
- 2026-03-23 Listed $155,000 GAMLS
- 2026-03-17 Listing Removed — GAMLS
- 2026-03-17 Listing Removed — FMLS
- 2025-12-19 Listed $160,300 GAMLS
- 2025-12-19 Listed $160,300 FMLS
- 2025-10-29 Listing Removed — FMLS
- 2025-10-29 Listing Removed — GAMLS
- 2025-10-25 Listed $160,300 FMLS
- 2025-10-25 Listed $160,300 GAMLS
- 2016-05-01 Listing Removed — GAMLS
- 2015-11-26 Listed $35,000 GAMLS
- 2011-06-18 Price Changed $19,000 GAMLS
- 2011-02-10 Price Changed $21,000 GAMLS
- 2009-08-06 Sold (MLS) $40,000 FMLS
- 2008-11-06 Listed $38,000 FMLS
- 1998-06-15 Sold (Public Records) $90,000 Public Records
- 1983-03-29 Sold (Public Records) $37,000 Public Records
Property tax history
+4.9%/yrLatest (2025): $2,278 · +10.4% YoY. Source: county tax records.
Cash-flow waterfall
monthlySold comps — $/sqft
last 12 mo · ≤1 miLoading sold comps…