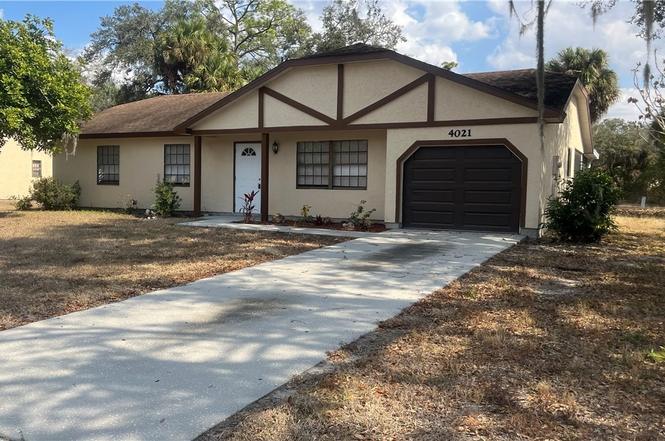
4021 Sena Ln · Port LaBelle, FL
Flood risk 1/10 · Minimal
- FEMA flood zone
- X (unshaded)
- Chance of flooding over 30 yrs
- 0.0%
- Est. flood insurance / yr
- $507 – $1,088
Fire risk 4/10 · Minor
- Est. fire insurance / yr
- $947 – $1,759
Heat risk 9/10 · Severe
- Hot days now (above 108°F)
- 7 days/yr
- Hot days in 30 yrs
- 25 days/yr
Wind risk 10/10 · Severe
- Chance of severe wind over 30 yrs
- 99.0%
Air-quality risk 2/10 · Minimal
- Unhealthy air days now
- 2 days/yr
- Unhealthy air days in 30 yrs
- 2 days/yr
Risk factors via First Street. Map © Google.
Why this score? — see what drove the C grade
The composite is a weighted blend of 9 inputs, each scored 0–100. Each bar is that input's sub-score; the figure is the points it added to the 100-point composite (weight × sub-score).
- Cash flow +17.1/30.0
- Appreciation +10.0/10.0
- ARV discount +9.8/15.0
- DSCR +5.3/10.0
- 1% rule +4.5/10.0
- Schools +3.1/10.0
- Livability +3.1/5.0
- Rent growth +2.5/5.0
- Condition / age +2.5/5.0
$232,900
🖨 Deal sheet 📄 Offer letter ✓ Due diligence
Listing remarks
THIS HOME IS IN PORT LABELLE UNIT 4, THERE IS A MANDATORY HOME OWNERS ASSOCIATION FEE $180.00 PER YEAR. Let me tell you about this Nice 3 Bedroom 2 Bath 1 car garage with screen lanai in Port Labelle Unit 4. Freshly painted on outside and inside. New shower faucets and handles, new tile in the shower in master bathroom. New toilet, cabinet, medicine cabinet and lighting. The hall bath has new water lines and fixtures tile and new bathtub, toilet, cabinet and medicine cabinet new lighting. New air conditioning system. New carpet in all the bedrooms. The appliances: New Refrigerator with Ice maker, new range and hood. The screen lanai has new screen door and screen. Has a new garage door an
Key facts
- Screen lanai
- New medicine cabinet
- New cabinet
Tags
Property features AI
Finance
- Financial info: Pets allowed
- HOA & community: Homeowners association with annual fee of $180; Community amenities: park, pool; Non-gated community
Exterior
- Parking: Attached garage; Garage door opener; Two parking spaces (one covered)
- Security: Smoke detectors
- Utilities: Public water; Public sewer; Cable available
- Home design: Single-story; Entry level: 1; Faces west; Resale property
- Construction: Stucco and wood frame construction; Shingle roof
- Exterior features: Lanai; Porch; Screened porch; Outbuilding; Community pool; Rectangular lot; Public maintained road; East exposure
Interior
- Kitchen: Range; Refrigerator; Icemaker
- Flooring: Carpet; Tile
- Bathrooms: 2 full bathrooms
- Heating & cooling: Central heating (electric); Central air conditioning (electric)
- Interior features: Sliding windows; Eat-in kitchen; Combined living and dining area; Shower only (separate shower); Unfurnished
- Laundry & utility: Washer hookup inside; Dryer hookup inside
Neighborhood map
What this means for you Summary
Snapshot
- This is a 3-bed/2.0-bath single-family listed at $233k.
Deal economics
- At list price, monthly cash flow is $162 ($2k/yr) — positive.
- The deal already cash-flows at list — no discount required.
- To meet the 1% rule (rent ≥ 1% of price), the offer needs to be $222k (4.9% below list).
- Recommended offer: $212k (9.0% below list) — sets the bar for market timing.
- Cap rate 7.1% vs local median 5.1% in Port LaBelle — top-decile yield for the area; either an underpriced asset or a hidden risk that comps aren't pricing in. Stress-test before assuming the spread holds.
Location & tenants
- Location reads 62/100 on livability (#750 in FL) — a middle-class / working-renter tenant base. Strengths: cost of living A+, housing A+; Watch: schools F, amenities F, commute F.
- Hendry (town): math 35% / reading 40% proficiency, ranked #65 of 73 in FL (top 89%) — families likely to look elsewhere, expect single-tenant / working-renter base with shorter leases; 75% free/reduced lunch — lower-income household profile, screen leases tightly.
- Market conditions: 942 active listings in the ZIP; 8 comparable units currently listed for rent nearby; rentals at typical pace (median 24d on market — plan ~3-4 weeks tenant-placement turnaround); 557 units permitted in Hendry County in 2024 (45 in 5+ unit buildings).
- At $2,216/mo this rent would consume 47% of the median local household income ($57k/yr) (locally 498% of renters already pay >50% of income on rent) — very limited rent-growth headroom before tenants either downsize or default.
Forward outlook
- In year one you build about $25k of equity ($2k loan paydown + $23k appreciation (10.0% local appreciation)).
- Hendry County population projected to shrink 7% by 2050 — rents likely to lag national; underwrite the cash flow, not the appreciation.
- At projected returns (10.0% appreciation + 3.0% rent growth), your $65k cash investment doubles in ~3 years — after that, you're playing with house money.
- By year 2, paydown + projected appreciation supports a ~$40k cash-out refi (75% LTV) — recoverable capital for the next deal without selling this one.
Negotiation context
- It's been on market 118 days — a 9% lower offer ($212k) is reasonable based on typical stale-listing flexibility.
- Current owner paid $85k; list at $233k implies a 173% gain — meaningful room to come down on a strong offer.
Risks & watch-outs
- Climate carrying-cost: severe wind risk, 99% chance of damaging wind over 30y; extreme-heat days projected 7→25/yr by 2055 (HVAC capex compounding) — expect insurance premiums to compound above CPI over the hold.
Questions for the listing agent
- It's been on market 118 days. Have you received any prior offers? Is the seller open to a 9% concession, seller financing, or rate buy-down credit?
- What does the HOA fee cover, when was the last increase, and are there any pending special assessments or reserve-fund shortfalls?
- Why hasn't it sold? Are there any deal-killer items the seller is aware of (foundation, flood, title, zoning, code violations)?
- Is there a deadline driving the sale (1031 exchange, divorce, estate, relocation)? That informs how much negotiation room exists.
- Schools are F-rated, which usually means shorter tenancies and higher turnover. Who's the typical renter profile here, and what's been the actual vacancy rate?
- What's the average days-on-market for RENTAL listings here right now (not sales)? A rising rental-DOM trend means longer vacancies and softer asking-rent achievability than the comps imply.
- What's the recent tenant-quality profile in this submarket — average credit score on applications, eviction rate, late-payment / NSF rate, and stable-employment percentage? A property-management company in the area should have these aggregated.
- How much new for-sale + rental construction is in the pipeline within 1–3 miles? Heavy new supply typically softens prices + rents 12–24 months out; constrained supply supports both.
Investment metrics
- 1% rule
- 0.95% ✗
- Cap rate
- 7.13%
- Cash-on-cash
- 2.98%
- DSCR
- 1.13
- GRM
- 8.8
CMA / ARV
- ARV (on-the-fly)
- $245,616
- Comps found
- 11
Show comp detail 11 sales within ~0.75 mi
| Address | Dist | Beds/Ba | Sqft | Sold | Price | $/sf | Match |
|---|---|---|---|---|---|---|---|
| 4013 Albany Rd | 0.11mi | 3/2.0 | 1,200 (-0%) | 6mo | $207,000 | $173 | 89 |
| 4032 Albany Rd | 0.16mi | 3/2.0 | 1,116 (-7%) | 8mo | $230,000 | $206 | 74 |
| 4004 Sena Ln | 0.10mi | 3/2.0 | 1,296 (+8%) | 11mo | $200,000 | $154 | 74 |
| 4020 E Sunflower Cir | 0.16mi | 3/2.0 | 1,100 (-9%) | 7mo | $224,000 | $204 | 72 |
| 4023 E Sunflower Cir | 0.21mi | 3/2.0 | 1,128 (-6%) | 14mo | $229,000 | $203 | 68 |
| 4039 E Sunflower Cir | 0.18mi | 3/2.0 | 1,128 (-6%) | 22mo | $230,000 | $204 | 63 |
| 7004 Beaver Cir | 0.74mi | 3/2.0 | 1,204 (0%) | 4mo | $265,000 | $220 | 62 |
| 4049 Rainbow Cir | 0.40mi | 2/2.0 (-1) | 1,262 (+5%) | 12mo | $230,000 | $182 | 58 |
| 4086 Rainbow Cir | 0.48mi | 3/2.0 | 1,271 (+6%) | 20mo | $277,500 | $218 | 52 |
| 4038 Rainbow Cir | 0.42mi | 3/2.0 | 1,377 (+14%) | 12mo | $225,000 | $163 | 46 |
| 4015 E Palomar Cir | 0.68mi | 3/2.0 | 1,129 (-6%) | 18mo | $230,000 | $204 | 43 |
Match score weights: distance 35% · size 25% · config 20% · recency 20%. Top-matched comps best support the ARV.
Projected returns pro-forma
10.0% appreciation · 3.0% rent growth · sell at horizon
- IRR
- 26.4%
- Equity multiple
- 3.10×
- Total profit
- $137,192
- Equity at exit
- $209,815
- IRR
- 23.2%
- Equity multiple
- 7.07×
- Total profit
- $395,926
- Equity at exit
- $452,473
Cash invested: $65,212 (down + closing). Projections, not guarantees.
Landlord ↔ Tenant lean methodology
- Overall (STATE)
- 87 Strongly Landlord-Friendly
- State Florida
- 87 Strongly Landlord-Friendly · R+3
- County
- — inherits STATE
- City
- — inherits STATE
ZIP-level market 33935
- Home prices YoY
- 16.3%
- Active inventory
- 942
- Price-to-rent
- 8.8×
Monthly cashflow live
- Estimated rent
- $2,216 high interval (Pro) →
- Mortgage (P&I)
- −$1,221
- Tax from tax record
- −$240 /mo · $2,878/yr
- Insurance
- −$97
- HOA
- −$30
- Vacancy / Maint / Mgmt
- −$465
- Net cashflow
- $162
Break-even live
UW: 25.0% down · 7.5% · 30yr · 1.5% tax · 5.0% vac · 8.0% maint · 8.0% mgmt
Financing live
Cash to close
- Down payment
- $58,225
- Closing costs
- $6,987
- Reserves months
- —
- Total cash needed
- —
Loan-product check · same deal, 3 products live
Conventional
25% down · 7.5% · 30yr
- Down + closing
- —
- Monthly P&I
- —
- Monthly cashflow
- —
- DSCR
- —
- Eligible?
- —
Personal DTI + credit; lowest rate.
DSCR
20% down · 8.5% · 30yr
- Down + closing
- —
- Monthly P&I
- —
- Monthly cashflow
- —
- DSCR
- —
- Eligible?
- —
No personal income docs; deal must DSCR.
Hard money
10% down · 12.0% · 12mo
- Down + closing
- —
- Monthly P&I
- —
- Monthly cashflow
- —
- DSCR
- —
- Eligible?
- —
Short-term bridge; refi at stabilization.
Rent comps 8 comps
| Address | Beds | Baths | Sqft | Rent | $/sqft | DOM | Units | Dist |
|---|---|---|---|---|---|---|---|---|
| 5029 S Rosebud Cir Labelle, FL | 3.0 | 2.0 | 1389 | $1,780 | $1.28 | 23d | 1 | 0.71mi |
| 801 SW Raintree Blvd Labelle, FL | 3.0 | 2.0 | 1285 | $1,700 | $1.32 | 23d | 1 | 1.05mi |
| 7061 Tide Cir Labelle, FL | 4.0 | 2.0 | 1500 | $1,695 | $1.13 | 23d | 1 | 1.18mi |
| 6018 Acorn Cir Labelle, FL | 3.0 | 2.0 | 1408 | $2,200 | $1.56 | 16d | 1 | 1.18mi |
| 5029 W Hummingbird Dr Labelle, FL | 3.0 | 2.0 | 1212 | $2,450 | $2.02 | 3d | 1 | 1.36mi |
| 9001 Penny Cir Labelle, FL | 3.0 | 2.0 | 1472 | $2,300 | $1.56 | 16d | 1 | 1.42mi |
| 9001 Penny Cir Labelle, FL | 3.0 | 2.0 | 1472 | $2,300 | $1.56 | 23d | 1 | 1.42mi |
| 8030 Olive Cir Labelle, FL | 4.0 | 2.0 | 1499 | $2,300 | $1.53 | 3d | 1 | 1.47mi |
HOA detail
- Monthly dues
- $30 · $360/yr
- Likely covers
- water
Listing history 20 events
-
2026-06-18days on market $232,900 Active 118 DOM
-
2026-06-17days on market $232,900 Active 117 DOM
-
2026-06-16days on market $232,900 Active 116 DOM
-
2026-06-15days on market $232,900 Active 115 DOM
-
2026-06-13days on market $232,900 Active 113 DOM
-
2026-06-13days on market $232,900 Active 112 DOM
-
2026-06-10days on market $232,900 Active 110 DOM
-
2026-06-09days on market $232,900 Active 109 DOM
-
2026-06-08days on market $232,900 Active 108 DOM
-
2026-06-07days on market $232,900 Active 107 DOM
-
2026-06-03days on market $232,900 Active 103 DOM
-
2026-06-02days on market $232,900 Active 102 DOM
-
2026-06-01days on market $232,900 Active 101 DOM
-
2026-05-31days on market $232,900 Active 100 DOM
-
2026-03-26price $232,900
-
2026-02-17$239,900 Active
-
2005-06-23soldstatus $85,300
-
2003-04-21soldstatus $75,000
-
2003-04-17soldstatus $75,000
-
2003-02-18price $78,000
ⓘ Source: listings_history table (triggers on properties + properties_extension) + one-shot
backfill from property_details.listing_events for pre-trigger history.
Tax reassessment forecast FL · Resets to sale price
- Current annual tax
- $2,878 · $240/mo
- Projected year-2 tax
- $2,878 · $240/mo
- Expected delta
- $0/yr ($0/mo · 0.0%)
ⓘ Screening estimate from a state-policy table — verify with the county assessor before closing.
Climate risk First Street
- Flood 1/10 Low FEMA zone X (unshaded) · 0% chance over 30 yrs
- Wildfire 4/10 Moderate
- Heat 9/10 Extreme 7 d/yr ≥108°F today · 25 d/yr by 30 yrs out
- Wind 10/10 Extreme 99% chance of damaging wind over 30 yrs
- Air quality 2/10 Low 2 unhealthy d/yr today · 2 by 30 yrs out
Nearby sold comps map
Loading sold comps map…
Walkable amenities ~0.75 mi
Loading nearby amenities…
Taxation est. · year 1
- Rental income
- $26,588
- − Mortgage interest
- −$13,046
- − Property taxes
- −$2,878
- − Insurance
- −$1,164
- − Repairs & maintenance
- −$2,127
- − Management
- −$2,127
- − HOA
- −$360
- − Depreciation
- −$6,775
- Taxable loss
- −$1,890
- Est. tax savings @ 24.0%
- +$454
- After-tax cash flow
- $2,399/yr
For passive investors: Depreciation is non-cash, so a rental often shows a tax loss while cash-flowing — sheltering income. Rental losses are passive: they offset passive income freely, and up to $25,000/yr can offset ordinary (W-2) income if you actively participate and your MAGI is under $100k (phasing out to $0 by $150k); unused losses carry forward. On sale, claimed depreciation is recaptured at up to 25%, and gains may owe capital-gains tax (a 1031 exchange can defer both). Figures are a year-1 estimate at your 24.0% rate — not tax advice; consult a CPA.
Schools (NCES district)
- District
- Hendry
- NCES district ID
- 1200780
- Math proficiency
- 35% ▼ -11.00%
- Reading proficiency
- 40% ▼ -4.00%
- Median HH income
- $37,043
- Composite
- 31.16/100
- National rank
- #6054
- State rank
- #65 of 73 in FL
Livability — Port LaBelle
- Score
- 62/100
- State rank
- #750
- US rank
- #16264
Category grades
Schools grade is shown separately in the Schools card above.
Census & demographics
- Census place
- Port LaBelle, FL
- County
- Hendry County · 23,186 people
- Metro
- Clewiston, FL
- Population (ZIP)
- 23,186
- Household income
- $57,009
- Rent vs Own
- Severe rent burden
- 498.0
Population outlook (Hendry County) Hauer SSP2
- Today (2025)
- 38,866 people
- By 2030
- 38,558 · -0.8%
- By 2040
- 37,743 · -2.9%
- By 2050
- 36,117 · -7.1%
- By 2075
- 30,070 · -22.6%
- By 2100
- 21,966 · -43.5%
Race, ethnicity, and origin ACS 2023
- Neighborhood character
- Majority Hispanic (56%)
- Race & ethnicity
- Hispanic / Latino 56% White 39% Two or more races 21% Black 2% Native American 2%
- Hispanic origin (detail)
- Mexican 40% Puerto Rican 3% Cuban 5%
- Common ancestry
- Lithuanian 2% Serbian 2% Slovak 1%
- Foreign-born
- 27% · Canada, Jamaica
- Languages at home
- 50% English-only · Spanish 50%
Political lean MEDSL · Hendry
- 2024 margin
- Solid R (+38.3) · D 30.4% · R 68.7%
- 2008→2024 swing
- -31.1pp toward R · 2008: -7.2pp · 2024: -38.3pp
- All cycles
- 2024: R+38.3 2020: R+23.0 2016: R+14.2 2012: R+5.9 2008: R+7.2
Not yet ingested
- Civics
- —
Market trends
- HPI YoY
- ▲ 75.20%
- Current HPI
- 537.4928
- Rent YoY
- —
- Metro
- Clewiston, FL
- State GDP YoY
- ▲ 3.28%
- F500 in state
- 36
Industry mix (Fortune 500 HQ in FL)
| Industry | F500 HQs | Revenue |
|---|---|---|
| Industrial Technology | 2 | $29B |
|
||
| Insurance | 2 | $17B |
|
||
| Retail | 1 | $60B |
|
||
| Technology Distribution | 1 | $58B |
|
||
| Homebuilding | 1 | $35B |
|
||
| Technology Manufacturing | 1 | $35B |
|
||
Price history
+198.6% since first listed6 events — show timeline
- 2026-03-26 Price Changed $232,900 FORTMLS
- 2026-02-17 Listed $239,900 FORTMLS
- 2005-06-23 Sold (Public Records) $85,300 Public Records
- 2003-04-21 Sold (Public Records) $75,000 Public Records
- 2003-04-17 Sold (MLS) $75,000 FORTMLS
- 2003-02-18 Price Changed $78,000 FORTMLS
Property tax history
+9.0%/yrLatest (2025): $2,878 · +11.6% YoY. Source: county tax records.
Cash-flow waterfall
monthlySold comps — $/sqft
last 12 mo · ≤1 miLoading sold comps…