3237 S Manor Dr #110 · Lansing, IL
Flood risk 4/10 · Minor
- FEMA flood zone
- X (unshaded)
- Chance of flooding over 30 yrs
- 0.22%
- Est. flood insurance / yr
- $507 – $1,088
Fire risk 3/10 · Minor
- Est. fire insurance / yr
- $804 – $1,492
Heat risk 3/10 · Minor
- Hot days now (above 102°F)
- 7 days/yr
- Hot days in 30 yrs
- 15 days/yr
Wind risk 2/10 · Minimal
- Chance of severe wind over 30 yrs
- 0.0%
Air-quality risk 4/10 · Minor
- Unhealthy air days now
- 5 days/yr
- Unhealthy air days in 30 yrs
- 6 days/yr
Risk factors via First Street. Map © Google.
Why this score? — see what drove the C grade
The composite is a weighted blend of 9 inputs, each scored 0–100. Each bar is that input's sub-score; the figure is the points it added to the 100-point composite (weight × sub-score).
- Cash flow +24.8/30.0
- 1% rule +9.6/10.0
- DSCR +8.1/10.0
- ARV discount +7.5/15.0
- Livability +3.7/5.0
- Rent growth +2.5/5.0
- Condition / age +2.5/5.0
- Schools +1.0/10.0
- Appreciation +0.0/10.0
$75,900
🖨 Deal sheet 📄 Offer letter ✓ Due diligence
Listing remarks MLS
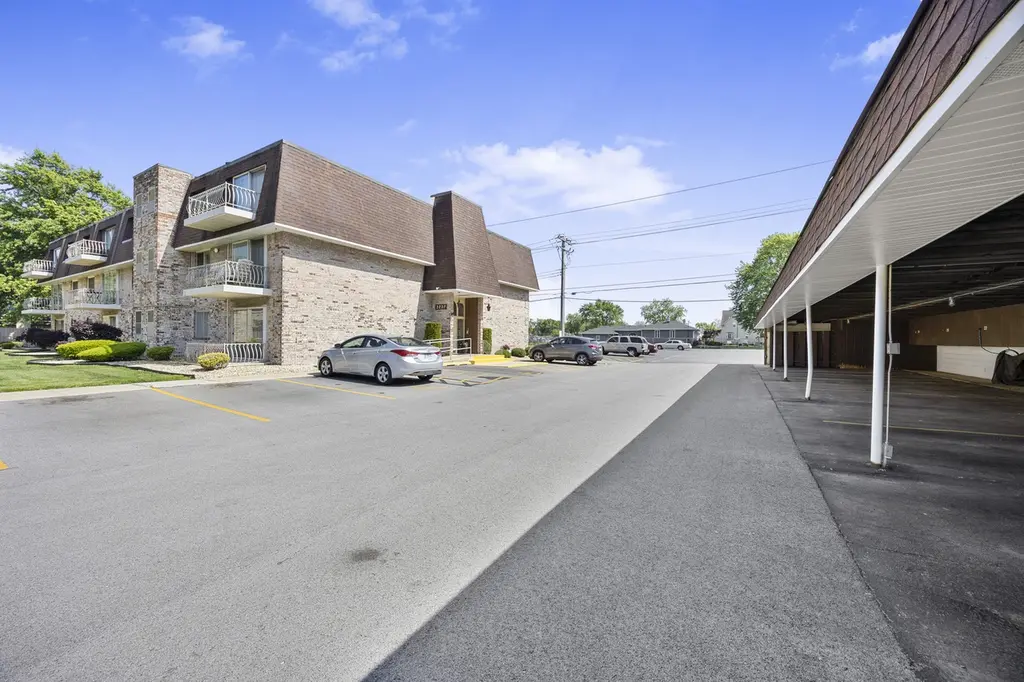
MOVE IN READY.. NO STAIRS... MAIN GROUND FLOOR....1 BEDROOM, 1 BATH CONDO IN THE BEAUTIFUL AND SOUGHT AFTER MONALDI MANOR ESTATES!! Building offers security entrance, elevator, assigned storage unit, laundry room just steps away from unit, parking and a private patio off the Living Room with Courtyard views. Close to Grocery, Hardware, Restaurant's, Banks and Specialty Shops. It offers Plenty of Guest Parking in South Parking Lot. Unit #110, Low Taxes !! THIS IS A MUST SEE !!
Key facts
- Private patio
- Security entrance
- Ample guest parking
Tags
Property features AI
Finance
- Other: 24 units in building; Living area reported by landlord/tenant/seller
- Financial info: Special service area: No
- HOA & community: Monthly association fee of $263; Association fee covers heat, water, gas, parking, insurance, exterior maintenance, lawn care, trash collection, and snow removal; Pets not allowed
Exterior
- Parking: One parking space; Unassigned parking, off-street guest parking and parking lot available; Garage faces side; Additional/other parking
- Utilities: Water source: Lake Michigan; Public sewer
- Home design: Attached single condo; End unit; Entry level 1; Disability access available
- Construction: Brick construction; Built approximately 51–60 years ago; Built before 1978
- Exterior features: Patio; Common lot/grounds
Interior
- Kitchen: Kitchen on main level (15 x 9) with ceramic tile
- Bedrooms: Master bedroom on main level (14 x 12) with carpet; Additional bedrooms (listed as Bedroom 2 and Bedroom 3)
- Flooring: Carpet in living areas and bedrooms; Ceramic tile in kitchen
- Bathrooms: One full bathroom
- Heating & cooling: Natural gas heating; Central air conditioning
- Interior features: Drapes on windows; Common laundry area
- Laundry & utility: Laundry located in common area
Neighborhood map
What this means for you Summary
Snapshot
- This is a 1-bed/1.0-bath condo listed at $76k.
Deal economics
- At list price, monthly cash flow is $161 ($2k/yr) — positive.
- The deal already cash-flows at list — no discount required.
- Meets the 1% rule at list price ($1k rent vs $76k).
- Recommended offer: $75k (1.5% below list) — sets the bar for market timing.
- Cap rate 8.8% vs local median 5.8% in Lansing — top-decile yield for the area; either an underpriced asset or a hidden risk that comps aren't pricing in. Stress-test before assuming the spread holds.
Location & tenants
- Location reads 73/100 on livability (#296 in IL) — a middle-class / working-renter tenant base. Strengths: commute A+, cost of living A+, housing A+; Watch: schools D+, crime D+, health & safety D+.
- Thornton Fractional Twp Hsd 215 (suburban): math 9% / reading 13% proficiency, ranked #563 of 620 in IL (top 91%) — low school quality limits family demand, transient renter base, plan for 1-2y turnover.
- Market conditions: 132 active listings in the ZIP; 4 comparable units currently listed for rent nearby; rentals at typical pace (median 25d on market — plan ~3-4 weeks tenant-placement turnaround); solid renter incomes; 6,272 units permitted in Cook County in 2024 (4,658 in 5+ unit buildings).
- This rent is only 18% of the median local income ($76k/yr) — well below the 30% rent-burden line; pricing power to push rent on renewal without tenant pushback.
Forward outlook
- Local home prices are declining (-3.0%/yr); year-one equity from $525 of loan paydown is wiped out by about $2k of value loss. Plan a longer hold.
Negotiation context
- It's been on market 21 days — a 2% lower offer ($75k) is reasonable based on typical stale-listing flexibility.
- 2 sale attempts since 18y ago; this cycle's ask is 22% above the opening price — seller raised mid-cycle; expect resistance to lowballs.
Risks & watch-outs
- Watch-outs: HOA is 24% of rent.
Questions for the listing agent
- Built in 1974 — when were the roof, HVAC, electrical panel, plumbing, and water heater last replaced?
- What does the HOA fee cover, when was the last increase, and are there any pending special assessments or reserve-fund shortfalls?
- Any open or pending special assessments — roof, HVAC, plumbing, elevator, façade? What's the per-unit balance and payoff schedule, and is the seller paying it off at close or rolling it to the buyer?
- Is there a deadline driving the sale (1031 exchange, divorce, estate, relocation)? That informs how much negotiation room exists.
- Schools are D-rated, which usually means shorter tenancies and higher turnover. Who's the typical renter profile here, and what's been the actual vacancy rate?
- Crime grade is D in this area — have there been break-ins, vandalism, or insurance claims at this property in the last 3 years? What carrier currently insures it and at what premium?
- What's the average days-on-market for RENTAL listings here right now (not sales)? A rising rental-DOM trend means longer vacancies and softer asking-rent achievability than the comps imply.
- What's the recent tenant-quality profile in this submarket — average credit score on applications, eviction rate, late-payment / NSF rate, and stable-employment percentage? A property-management company in the area should have these aggregated.
- How much new apartment / multifamily construction is in the pipeline within 1–3 miles? Heavy new supply (>2% of stock underway) typically softens rents 12–24 months out; light construction supports rent growth.
Investment metrics
- 1% rule
- 1.46% ✓
- Cap rate
- 8.85%
- Cash-on-cash
- 9.11%
- DSCR
- 1.41
- GRM
- 5.7
CMA / ARV
No comps found within radius.
Projected returns pro-forma
-3.0% appreciation · 3.0% rent growth · sell at horizon
- IRR
- -2.3%
- Equity multiple
- 0.91×
- Total profit
- $-1,883
- Equity at exit
- $11,317
- IRR
- 7.5%
- Equity multiple
- 1.57×
- Total profit
- $12,148
- Equity at exit
- $6,562
Cash invested: $21,252 (down + closing). Projections, not guarantees.
Landlord ↔ Tenant lean methodology
- Overall (STATE)
- 43 Moderately Tenant-Leaning
- State Illinois
- 43 Moderately Tenant-Leaning · D+7
- County
- — inherits STATE
- City
- — inherits STATE
ZIP-level market 60438
- Active inventory
- 132
- Price-to-rent
- 5.7×
Monthly cashflow live
- Estimated rent
- $1,112 medium interval (Pro) →
- Mortgage (P&I)
- −$398
- Tax from tax record
- −$24 /mo · $292/yr
- Insurance
- −$32
- HOA
- −$263
- Vacancy / Maint / Mgmt
- −$233
- Net cashflow
- $161
Break-even live
UW: 25.0% down · 7.5% · 30yr · 1.5% tax · 5.0% vac · 8.0% maint · 8.0% mgmt
Financing live
Cash to close
- Down payment
- $18,975
- Closing costs
- $2,277
- Reserves months
- —
- Total cash needed
- —
Loan-product check · same deal, 3 products live
Conventional
25% down · 7.5% · 30yr
- Down + closing
- —
- Monthly P&I
- —
- Monthly cashflow
- —
- DSCR
- —
- Eligible?
- —
Personal DTI + credit; lowest rate.
DSCR
20% down · 8.5% · 30yr
- Down + closing
- —
- Monthly P&I
- —
- Monthly cashflow
- —
- DSCR
- —
- Eligible?
- —
No personal income docs; deal must DSCR.
Hard money
10% down · 12.0% · 12mo
- Down + closing
- —
- Monthly P&I
- —
- Monthly cashflow
- —
- DSCR
- —
- Eligible?
- —
Short-term bridge; refi at stabilization.
Rent comps 4 comps
| Address | Beds | Baths | Sqft | Rent | $/sqft | DOM | Units | Dist |
|---|---|---|---|---|---|---|---|---|
| 18423 Torrence Ave Apt 3 Lansing, IL | 2.0 | 1.0 | 500 | $1,300 | $2.60 | 24d | 1 | 1.23mi |
| 18423 Torrence Ave Unit 2 Lansing, IL | 1.0 | 1.0 | 500 | $1,000 | $2.00 | 24d | 1 | 1.23mi |
| 2441 Indiana Ave Lansing, IL | 1.0 | 1.0 | 600 | $975 | $1.62 | 3d | 1 | 1.45mi |
| 2441 Indiana Ave Unit 2N Lansing, IL | 1.0 | 1.0 | 600 | $975 | $1.62 | 12d | 1 | 1.45mi |
HOA detail condo
- Monthly dues
- $263 · $3,156/yr
- Likely covers
- security
- Assessments
- None detected in remarks — confirm with the listing agent.
Listing history 3 events
-
2026-06-18days on market $75,900 Active 21 DOM
-
2026-06-18remarks 699-char remark
-
2026-06-18$75,900 Active 20 DOM
ⓘ Source: listings_history table (triggers on properties + properties_extension) + one-shot
backfill from property_details.listing_events for pre-trigger history.
Tax reassessment forecast IL · Partial reset (capped growth)
- Current annual tax
- $292 · $24/mo
- Projected year-2 tax
- $1,007 · $84/mo
- Expected delta
- +$716/yr (+$60/mo · 245.1%)
ⓘ Screening estimate from a state-policy table — verify with the county assessor before closing.
Climate risk First Street
- Flood 4/10 Moderate FEMA zone X (unshaded) · 22% chance over 30 yrs
- Wildfire 3/10 Moderate
- Heat 3/10 Moderate 7 d/yr ≥102°F today · 15 d/yr by 30 yrs out
- Wind 2/10 Low 0% chance of damaging wind over 30 yrs
- Air quality 4/10 Moderate 5 unhealthy d/yr today · 6 by 30 yrs out
Nearby sold comps map
Loading sold comps map…
Walkable amenities ~0.75 mi
Loading nearby amenities…
Taxation est. · year 1
- Rental income
- $13,343
- − Mortgage interest
- −$4,252
- − Property taxes
- −$292
- − Insurance
- −$380
- − Repairs & maintenance
- −$1,067
- − Management
- −$1,067
- − HOA
- −$3,156
- − Depreciation
- −$2,208
- Taxable income
- $921
- Est. tax owed @ 24.0%
- −$221
- After-tax cash flow
- $1,716/yr
For passive investors: Depreciation is non-cash, so a rental often shows a tax loss while cash-flowing — sheltering income. Rental losses are passive: they offset passive income freely, and up to $25,000/yr can offset ordinary (W-2) income if you actively participate and your MAGI is under $100k (phasing out to $0 by $150k); unused losses carry forward. On sale, claimed depreciation is recaptured at up to 25%, and gains may owe capital-gains tax (a 1031 exchange can defer both). Figures are a year-1 estimate at your 24.0% rate — not tax advice; consult a CPA.
Schools (NCES district)
- District
- Thornton Fractional Twp Hsd 215
- NCES district ID
- 1738940
- Math proficiency
- 9% ▼ -3.00%
- Reading proficiency
- 13% ▼ -3.00%
- Median HH income
- $48,207
- Composite
- 10.27/100
- National rank
- #9793
- State rank
- #563 of 620 in IL
Livability — Lansing
- Score
- 73/100
- State rank
- #296
- US rank
- #5698
Category grades
Schools grade is shown separately in the Schools card above.
Census & demographics
- Census place
- Lansing, IL
- County
- Cook County · 4,486,803 people
- City population
- 28,806
- Metro
- Chicago-Naperville-Elgin, IL-IN-WI
- Population (ZIP)
- 28,806
- Household income
- $75,681
- Rent vs Own
- Severe rent burden
- 830.0
Population outlook (Cook County) Hauer SSP2
- Today (2025)
- 5,347,519 people
- By 2030
- 5,357,703 · +0.2%
- By 2040
- 5,324,924 · -0.4%
- By 2050
- 5,230,762 · -2.2%
- By 2075
- 4,785,735 · -10.5%
- By 2100
- 4,188,836 · -21.7%
Race, ethnicity, and origin ACS 2023
- Neighborhood character
- Diverse neighborhood (Simpson 0.65)
- Race & ethnicity
- Black 51% White 25% Hispanic / Latino 18% Two or more races 7% Asian 2%
- Hispanic origin (detail)
- Mexican 15%
- Common ancestry
- Romanian 5% Iranian 3% Lithuanian 1%
- Foreign-born
- 10% · Canada
- Languages at home
- 83% English-only · Spanish 12% Vietnamese 1% French/Haitian/Cajun 1%
Political lean MEDSL · Cook
- 2024 margin
- Solid D (+42.0) · D 70.4% · R 28.4% · Other 1.2%
- 2008→2024 swing
- -11.4pp toward R · 2008: 53.4pp · 2024: 42.0pp
- All cycles
- 2024: D+42.0 2020: D+50.3 2016: D+53.0 2012: D+49.4 2008: D+53.4
Not yet ingested
- Civics
- —
Market trends
- HPI YoY
- ▼ -151.65%
- Current HPI
- 210.3398
- Rent YoY
- —
- Metro
- Chicago-Naperville-Elgin, IL-IN-WI
- State GDP YoY
- ▲ 1.59%
- F500 in state
- 60
Industry mix (Fortune 500 HQ in IL)
| Industry | F500 HQs | Revenue |
|---|---|---|
| Insurance | 4 | $201B |
|
||
| Consumer Goods | 4 | $87B |
|
||
| Industrial Machinery | 3 | $64B |
|
||
| Healthcare | 2 | $55B |
|
||
| Retail / Pharmacy | 1 | $148B |
|
||
| Agriculture / Food | 1 | $86B |
|
||
Price history
+89.2% since first listed9 events — show timeline
- 2023-08-11 Sold (Public Records) $70,000 Public Records
- 2023-07-14 Sold (MLS) $70,000 MRED as Distributed by MLS Grid
- 2023-07-11 Pending — MRED as Distributed by MLS Grid
- 2023-05-24 Contingent — MRED as Distributed by MLS Grid
- 2023-05-05 Listed $62,000 MRED as Distributed by MLS Grid
- 2009-02-01 Listing Removed — MRED as Distributed by MLS Grid
- 2008-01-29 Listed — MRED as Distributed by MLS Grid
- 1986-09-01 Sold (Public Records) $36,500 Public Records
- 1981-01-13 Sold (Public Records) $37,000 Public Records
Property tax history
-6.5%/yrLatest (2023): $292 · -74.7% YoY. Source: county tax records.
Cash-flow waterfall
monthlySold comps — $/sqft
last 12 mo · ≤1 miLoading sold comps…