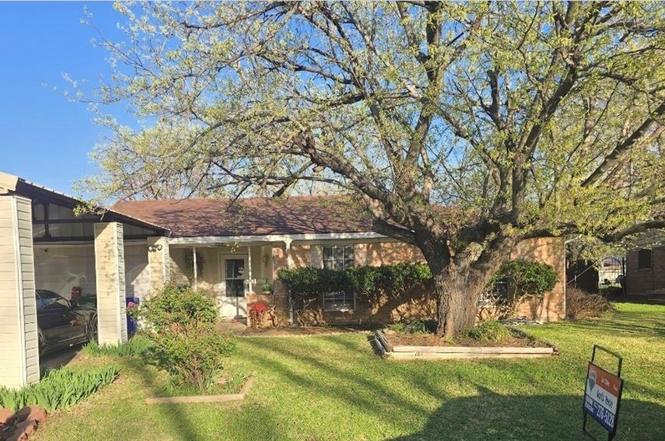
624 S Kate St · White Settlement, TX
Flood risk 1/10 · Minimal
- FEMA flood zone
- X (unshaded)
- Chance of flooding over 30 yrs
- 0.0%
- Est. flood insurance / yr
- $507 – $1,088
Fire risk 5/10 · Moderate
- Est. fire insurance / yr
- $1,222 – $2,270
Heat risk 7/10 · Major
- Hot days now (above 108°F)
- 7 days/yr
- Hot days in 30 yrs
- 23 days/yr
Wind risk 4/10 · Minor
- Chance of severe wind over 30 yrs
- 24.0%
Air-quality risk 3/10 · Minor
- Unhealthy air days now
- 3 days/yr
- Unhealthy air days in 30 yrs
- 4 days/yr
Risk factors via First Street. Map © Google.
Why this score? — see what drove the D+ grade
The composite is a weighted blend of 9 inputs, each scored 0–100. Each bar is that input's sub-score; the figure is the points it added to the 100-point composite (weight × sub-score).
- ARV discount +15.0/15.0
- Cash flow +13.1/30.0
- 1% rule +4.4/10.0
- DSCR +3.9/10.0
- Livability +3.7/5.0
- Schools +3.5/10.0
- Rent growth +2.5/5.0
- Condition / age +2.5/5.0
- Appreciation +0.0/10.0
$210,000
🖨 Deal sheet (PDF) 📄 Offer letter ✓ Due diligence
Listing remarks
This gem built in 1969 with 3 bedrooms and 2 baths offers plenty of opportunity to make it your own. Featuring original kitchen cabinetry in a galley style kitchen. Garage conversion is perfect for a game room or large family entertainment area. Living room has build in book shelves, tall ceiling, ceiling fan and wood laminate flooring. Master bedroom with ceiling fan, walk-in closet and private bath with stand up shower, Spacious backyard with mature trees, large covered patio and a large detached workshop with steel frame, metal siding, windows and concrete floor. The extra large 4 car carport is constructed of steel frame and decorative siding to match the home. This is a great opportuni
Key facts
- Garage conversion
- Walk-in closet
- Private bath
Tags
Property features AI
Finance
- Other: Mineral rights excluded
- Financial info: Accepted financing: Cash, Conventional, FHA; Listing status: Active Under Contract
- HOA & community: No association; Community curbs
Exterior
- Parking: Attached carport; 4 covered/carport spaces
- Utilities: City water; City sewer; Electricity connected; Overhead utilities
- Home design: Single-family residence; One story; Residential property
- Construction: Built in 1969; Composition/shingle roof; Slab foundation
- Exterior features: Covered patio/porch; Chain link fencing; Lot less than 0.5 acre
Interior
- Kitchen: Dishwasher; Electric oven; Electric range
- Bedrooms: Primary bedroom on level 1 (approx. 11 x 16); Second bedroom on level 1 (approx. 10 x 11); Third bedroom on level 1 (approx. 10 x 10)
- Flooring: Laminate; Tile
- Bathrooms: 2 full bathrooms
- Heating & cooling: Central heating (electric); Central air (electric)
- Interior features: Walk-in closet(s); Two living areas; Eat-in galley kitchen; Dual kitchen sinks; Built-in cabinets in living room; Room count: 8; Levels: One
- Laundry & utility: Full-size washer/dryer area; Electric dryer hookup
Neighborhood map
What this means for you Summary
Snapshot
- This is a 3-bed/2.0-bath single-family listed at $210k.
Deal economics
- At list price, monthly cash flow is $-8 ($-92/yr) — negative.
- To cash-flow at today's rent, offer at most $209k (0.6% below list).
- To meet the 1% rule (rent ≥ 1% of price), the offer needs to be $198k (5.7% below list).
- Recommended offer: $198k (5.7% below list) — sets the bar for 1% rule.
- Cap rate 6.2% vs local median 4.6% in White Settlement — top-decile yield for the area; either an underpriced asset or a hidden risk that comps aren't pricing in. Stress-test before assuming the spread holds.
Location & tenants
- Location reads 74/100 on livability (#188 in TX, #4,855 nationally) — a middle-class / working-renter tenant base. Strengths: cost of living A+, housing A+, health & safety A+; Watch: amenities D+, employment D+, commute F.
- White Settlement ISD (rural): math 35% / reading 44% proficiency, ranked #396 of 826 in TX (top 48%) — families likely to look elsewhere, expect single-tenant / working-renter base with shorter leases.
- Zoned schools: North El (math 44% / reading 45%, grade F, #1,155 of 4,322 statewide, top 29%, 766 students, 57% FRL); Brewer Middle (math 33% / reading 48%, grade F, #637 of 1,662 statewide, top 39%, 1,047 students, 63% FRL); Brewer H S (math 25% / reading 45%, grade F, #954 of 1,632 statewide, top 59%, 2,183 students, 56% FRL).
- Market conditions: Rents soft (-0.2%/yr); 553 active listings in the ZIP; 40 comparable units currently listed for rent nearby; rentals at typical pace (median 24d on market — plan ~3-4 weeks tenant-placement turnaround); solid renter incomes; 18,938 units permitted in Tarrant County in 2024 (8,336 in 5+ unit buildings).
Forward outlook
- Local home prices are declining (-3.0%/yr); year-one equity from $1k of loan paydown is wiped out by about $6k of value loss. Plan a longer hold.
- Tarrant County population projected at +41% by 2050 — long-run rental-demand tailwind backs the buy-and-hold thesis.
Negotiation context
- It's been on market 52 days — a 3% lower offer ($204k) is reasonable based on typical stale-listing flexibility.
- 2 sale attempts with the ask held roughly flat each time — persistent listings suggest the price (not the market) is what's stuck; bring a comps-based counter.
Risks & watch-outs
- Climate carrying-cost: moderate wildfire risk; extreme-heat days projected 7→23/yr by 2055 (HVAC capex compounding) — expect insurance premiums to compound above CPI over the hold.
Questions for the listing agent
- What do current leases actually rent for vs. the listed asking? Can we see a recent rent roll and the last 12 months of T-12 income?
- It's been on market 52 days. Have you received any prior offers? Is the seller open to a 6% concession, seller financing, or rate buy-down credit?
- Built in 1969 — when were the roof, HVAC, electrical panel, plumbing, and water heater last replaced?
- Is there a deadline driving the sale (1031 exchange, divorce, estate, relocation)? That informs how much negotiation room exists.
- Schools are D-rated, which usually means shorter tenancies and higher turnover. Who's the typical renter profile here, and what's been the actual vacancy rate?
- The area grade is low — what's the realistic commute time and amenity access for the typical tenant pool here? Any planned neighborhood developments (good or bad) we should know about?
- What's the average days-on-market for RENTAL listings here right now (not sales)? A rising rental-DOM trend means longer vacancies and softer asking-rent achievability than the comps imply.
- What's the recent tenant-quality profile in this submarket — average credit score on applications, eviction rate, late-payment / NSF rate, and stable-employment percentage? A property-management company in the area should have these aggregated.
- How much new for-sale + rental construction is in the pipeline within 1–3 miles? Heavy new supply typically softens prices + rents 12–24 months out; constrained supply supports both.
Investment metrics
- 1% rule
- 0.94% ✗
- Cap rate
- 6.25%
- Cash-on-cash
- -0.16%
- DSCR
- 0.99
- GRM
- 8.8
CMA / ARV
- ARV (on-the-fly)
- $329,475
- Comps found
- 12
Show comp detail 12 sales within ~0.75 mi
| Address | Dist | Beds/Ba | Sqft | Sold | Price | $/sf | Match |
|---|---|---|---|---|---|---|---|
| 624 S Kate St | 0.00mi | 3/2.0 | 1,725 (0%) | 1mo | $210,000 | $122 | 99 |
| 8814 Rockway St | 0.18mi | 4/2.0 (+1) | 1,903 (+10%) | 6mo | $385,000 | $202 | 64 |
| 627 Hallvale Dr | 0.28mi | 3/2.0 | 1,907 (+11%) | 6mo | $227,700 | $119 | 64 |
| 8811 Silver Creek Rd | 0.31mi | 4/2.0 (+1) | 1,860 (+8%) | 5mo | $390,000 | $210 | 63 |
| 8809 Silvercreek Rd | 0.31mi | 4/2.0 (+1) | 1,874 (+9%) | 6mo | $375,000 | $200 | 61 |
| 9221 White Settlement Rd | 0.70mi | 3/2.0 | 1,798 (+4%) | 4mo | $305,000 | $170 | 57 |
| 8812 Rockway St | 0.19mi | 4/2.0 (+1) | 1,965 (+14%) | 8mo | $395,000 | $201 | 56 |
| 621 Saddle Rd | 0.54mi | 3/2.0 | 1,866 (+8%) | 8mo | $329,722 | $177 | 54 |
| 733 Vaquero St | 0.61mi | 3/2.0 | 1,577 (-9%) | 4mo | $319,900 | $203 | 54 |
| 632 Comal Ave | 0.37mi | 3/2.0 | 1,489 (-14%) | 11mo | $225,000 | $151 | 50 |
| 225 West Pl | 0.68mi | 3/2.0 | 1,600 (-7%) | 9mo | $304,999 | $191 | 48 |
| 1101 Dell St | 0.42mi | 3/1.5 | 1,508 (-13%) | 11mo | $200,000 | $133 | 48 |
Match score weights: distance 35% · size 25% · config 20% · recency 20%. Top-matched comps best support the ARV.
Projected returns pro-forma
-3.0% appreciation · 0.0% rent growth · sell at horizon
- IRR
- -20.2%
- Equity multiple
- 0.32×
- Total profit
- $-40,219
- Equity at exit
- $31,312
- IRR
- -22.7%
- Equity multiple
- 0.02×
- Total profit
- $-57,659
- Equity at exit
- $18,157
Cash invested: $58,800 (down + closing). Projections, not guarantees.
Landlord ↔ Tenant lean methodology
- Overall (STATE)
- 87 Strongly Landlord-Friendly
- State Texas
- 87 Strongly Landlord-Friendly · R+5
- County
- — inherits STATE
- City
- — inherits STATE
ZIP-level market 76108
- Home prices YoY
- -32.5%
- Rents YoY
- -0.2%
- Active inventory
- 553
- Price-to-rent
- 8.8×
Monthly cashflow live
- Estimated rent
- $1,980 high interval (Pro) →
- Mortgage (P&I)
- −$1,101
- Tax from tax record
- −$383 /mo · $4,601/yr
- Insurance
- −$88
- HOA
- −$0
- Vacancy / Maint / Mgmt
- −$416
- Net cashflow
- $-8
Break-even live
Sensitivity live
| Price | -10% $111 | -5% $52 | +0% $-8 | +5% $-67 | +10% $-127 |
|---|---|---|---|---|---|
| Rent | -10% $-164 | -5% $-86 | +0% $-8 | +5% $71 | +10% $149 |
| Rate | -1.0pp $98 | -0.5pp $46 | base $-8 | +0.5pp $-62 | +1.0pp $-117 |
UW: 25.0% down · 7.5% · 30yr · 1.5% tax · 5.0% vac · 8.0% maint · 8.0% mgmt
Financing live
Cash to close
- Down payment
- $52,500
- Closing costs
- $6,300
- Reserves months
- —
- Total cash needed
- —
Loan-product check · same deal, 3 products live
Conventional
25% down · 7.5% · 30yr
- Down + closing
- —
- Monthly P&I
- —
- Monthly cashflow
- —
- DSCR
- —
- Eligible?
- —
Personal DTI + credit; lowest rate.
DSCR
20% down · 8.5% · 30yr
- Down + closing
- —
- Monthly P&I
- —
- Monthly cashflow
- —
- DSCR
- —
- Eligible?
- —
No personal income docs; deal must DSCR.
Hard money
10% down · 12.0% · 12mo
- Down + closing
- —
- Monthly P&I
- —
- Monthly cashflow
- —
- DSCR
- —
- Eligible?
- —
Short-term bridge; refi at stabilization.
Rent comps 40 comps
| Address | Beds | Baths | Sqft | Rent | $/sqft | DOM | Units | Dist |
|---|---|---|---|---|---|---|---|---|
| 8822 Spaugh Ct Fort Worth, TX | 3.0 | 3.0 | 1756 | $2,120 | $1.21 | 1d | 1 | 0.21mi |
| 212 Lanham Ct Fort Worth, TX | 2.0 | 1.0 | 1057 | $1,350 | $1.28 | 45d | 1 | 0.56mi |
| 8438 Jay St Fort Worth, TX | 3.0 | 2.5 | 1394 | $1,695 | $1.22 | 9d | 1 | 0.57mi |
| 844 Saddle Rd Fort Worth, TX | 3.0 | 2.0 | 1055 | $1,850 | $1.75 | 20d | 1 | 0.66mi |
| 8428 Raymond Ave Fort Worth, TX | 3.0 | 2.0 | 1118 | $1,795 | $1.61 | 1d | 1 | 0.68mi |
| 225 West Pl Fort Worth, TX | 3.0 | 2.0 | 1550 | $2,400 | $1.55 | 45d | 1 | 0.70mi |
| 1300 Jim Wright Fwy Unit 1357 White Settlement, TX | 2.0 | 2.0 | 1112 | $1,440 | $1.29 | 45d | 1 | 0.71mi |
| 1300 Jim Wright Fwy Unit 1337 White Settlement, TX | 2.0 | 2.0 | 1112 | $1,399 | $1.26 | 1d | 1 | 0.71mi |
| 734 Lariat Ln White Settlement, TX | 3.0 | 2.0 | 1275 | $1,750 | $1.37 | 45d | 1 | 0.76mi |
| 140 S Las Vegas Trl White Settlement, TX | 2.0 | 1.5 | 1200 | $1,299 | $1.08 | 26d | 1 | 0.83mi |
| 123 Allencrest Dr Fort Worth, TX | 3.0 | 2.0 | 1424 | $1,545 | $1.08 | 4d | 1 | 0.84mi |
| 8109 Foxfire Ln Unit D White Settlement, TX | 2.0 | 2.0 | 1100 | $1,195 | $1.09 | 24d | 1 | 0.84mi |
| 129 Allencrest Dr Fort Worth, TX | 3.0 | 2.0 | 1424 | $1,595 | $1.12 | 9d | 1 | 0.85mi |
| 238 S Las Vegas Trl White Settlement, TX | 2.0 | 1.5 | 1200 | $1,372 | $1.14 | 4d | 4 | 0.86mi |
| 405 S Las Vegas Trl Fort Worth, TX | 3.0 | 2.0 | 1160 | $1,595 | $1.38 | 20d | 1 | 0.98mi |
| 9804 Westmere Ln Fort Worth, TX | 3.0 | 2.0 | 1734 | $1,950 | $1.12 | 13d | 1 | 1.00mi |
| 1501 Westpark View Dr Fort Worth, TX | 1.0–3.0 | 1.0–2.0 | 988 | $1,909 | $1.93 | 4d | 83 | 1.02mi |
| 228 Memory Dr Fort Worth, TX | 4.0 | 2.5 | 2238 | $2,175 | $0.97 | 26d | 1 | 1.08mi |
| 9909 Peregrine Trl Fort Worth, TX | 3.0 | 2.0 | 1864 | $2,200 | $1.18 | 46d | 1 | 1.12mi |
| 9641 Olivia Dr Fort Worth, TX | 3.0 | 2.0 | 1670 | $2,025 | $1.21 | 13d | 1 | 1.13mi |
| 617 S Las Vegas Trl White Settlement, TX | 3.0 | 2.0 | 1307 | $1,585 | $1.21 | 24d | 1 | 1.18mi |
| 619 Allencrest Dr Fort Worth, TX | 3.0 | 2.0 | 1322 | $1,800 | $1.36 | 26d | 1 | 1.22mi |
| 321 Meadow Park Dr White Settlement, TX | 3.0 | 2.0 | 1400 | $1,875 | $1.34 | 45d | 1 | 1.23mi |
| 500 W Loop 820 S Fort Worth, TX | 1.0–3.0 | 1.0–2.0 | 1082 | $2,039 | $1.88 | 45d | 11 | 1.27mi |
| 9801 Plainfield Dr Fort Worth, TX | 4.0 | 3.0 | 1730 | $2,817 | $1.63 | 45d | 1 | 1.27mi |
| 9801 Plainfield Dr Unit SL9811 Fort Worth, TX | 4.0 | 2.5 | 1730 | $2,813 | $1.63 | 45d | 1 | 1.27mi |
| 9801 Plainfield Dr Unit PPD154 Fort Worth, TX | 2.0 | 2.0 | 1149 | $2,024 | $1.76 | 14d | 1 | 1.27mi |
| 9801 Plainfield Dr Unit ND300 Fort Worth, TX | 4.0 | 2.5 | 1730 | $2,499 | $1.44 | 26d | 1 | 1.27mi |
| 9801 Plainfield Dr Unit PD9815 Fort Worth, TX | 3.0 | 2.0 | 1565 | $2,606 | $1.67 | 45d | 1 | 1.27mi |
| 9800 Plainfield Dr Fort Worth, TX | 2.0–4.0 | 2.0–2.5 | 1309 | $2,456 | $1.88 | 0d | 95 | 1.29mi |
| 132 Callender Dr Fort Worth, TX | 3.0 | 2.5 | 1739 | $1,810 | $1.04 | 45d | 1 | 1.34mi |
| 9984 Lone Eagle Dr Fort Worth, TX | 3.0 | 1.5 | 1324 | $1,650 | $1.25 | 7d | 1 | 1.34mi |
| 120 Callender Dr Fort Worth, TX | 3.0 | 2.0 | 1574 | $1,767 | $1.12 | 45d | 1 | 1.35mi |
| 704 Dale Ln Unit 2121 White Settlement, TX | 2.0 | 2.0 | 1112 | $1,359 | $1.22 | 1d | 1 | 1.36mi |
| 9904 Ivy Leaf Ln Fort Worth, TX | 3.0 | 2.0 | 1697 | $2,195 | $1.29 | 45d | 1 | 1.43mi |
| 9208 Marilyn Dr Fort Worth, TX | 3.0 | 2.0 | 1735 | $2,100 | $1.21 | 5d | 1 | 1.45mi |
| 108 Prospector Ct Fort Worth, TX | 3.0 | 1.5 | 1143 | $1,695 | $1.48 | 45d | 1 | 1.45mi |
| 9224 Marilyn Dr Fort Worth, TX | 3.0 | 2.0 | 1264 | $1,750 | $1.38 | 1d | 1 | 1.45mi |
| 9304 Marilyn Ct Fort Worth, TX | 3.0 | 2.0 | 1486 | $2,100 | $1.41 | 45d | 1 | 1.46mi |
| 640 Kimbrough St Fort Worth, TX | 4.0 | 2.0 | 1394 | $1,995 | $1.43 | 20d | 1 | 1.48mi |
Listing history 5 events
-
2026-05-05status Pending
-
2026-04-25historical Active Option Contract
-
2026-04-18status Active
-
2026-04-15historical Active Option Contract
-
2026-03-12$210,000 Active
ⓘ Source: listings_history table (triggers on properties + properties_extension) + one-shot
backfill from property_details.listing_events for pre-trigger history.
Tax reassessment forecast TX · Resets to sale price
- Current annual tax
- $4,601 · $383/mo
- Projected year-2 tax
- $4,601 · $383/mo
- Expected delta
- $0/yr ($0/mo · 0.0%)
ⓘ Screening estimate from a state-policy table — verify with the county assessor before closing.
Climate risk First Street
- Flood 1/10 Low FEMA zone X (unshaded) · 0% chance over 30 yrs
- Wildfire 5/10 Major
- Heat 7/10 Severe 7 d/yr ≥108°F today · 23 d/yr by 30 yrs out
- Wind 4/10 Moderate 24% chance of damaging wind over 30 yrs
- Air quality 3/10 Moderate 3 unhealthy d/yr today · 4 by 30 yrs out
Nearby sold comps map
Loading sold comps map…
Walkable amenities ~0.75 mi
Loading nearby amenities…
Taxation est. · year 1
- Rental income
- $23,764
- − Mortgage interest
- −$11,763
- − Property taxes
- −$4,601
- − Insurance
- −$1,050
- − Repairs & maintenance
- −$1,901
- − Management
- −$1,901
- − Depreciation
- −$6,109
- Taxable loss
- −$3,561
- Est. tax savings @ 24.0%
- +$855
- After-tax cash flow
- $762/yr
For passive investors: Depreciation is non-cash, so a rental often shows a tax loss while cash-flowing — sheltering income. Rental losses are passive: they offset passive income freely, and up to $25,000/yr can offset ordinary (W-2) income if you actively participate and your MAGI is under $100k (phasing out to $0 by $150k); unused losses carry forward. On sale, claimed depreciation is recaptured at up to 25%, and gains may owe capital-gains tax (a 1031 exchange can defer both). Figures are a year-1 estimate at your 24.0% rate — not tax advice; consult a CPA.
Schools (NCES district)
- District
- White Settlement ISD
- NCES district ID
- 4845540
- Math proficiency
- 35% ▼ -10.00%
- Reading proficiency
- 44% ▼ -4.00%
- Median HH income
- $56,055
- Composite
- 34.63/100
- National rank
- #5151
- State rank
- #396 of 826 in TX
Livability — White Settlement
- Score
- 74/100
- State rank
- #188
- US rank
- #4855
Category grades
Schools grade is shown separately in the Schools card above.
Census & demographics
- Census place
- White Settlement, TX
- County
- Tarrant County · 2,033,669 people
- Metro
- Dallas-Fort Worth-Arlington, TX
- Population (ZIP)
- 45,537
- Household income
- $80,412
- Rent vs Own
- Severe rent burden
- 774.0
Population outlook (Tarrant County) Hauer SSP2
- Today (2025)
- 2,380,417 people
- By 2030
- 2,578,900 · +8.3%
- By 2040
- 2,974,995 · +25.0%
- By 2050
- 3,350,489 · +40.8%
- By 2075
- 4,216,909 · +77.2%
- By 2100
- 4,741,527 · +99.2%
Race, ethnicity, and origin ACS 2023
- Neighborhood character
- Diverse neighborhood (Simpson 0.62)
- Race & ethnicity
- White 52% Hispanic / Latino 32% Two or more races 17% Black 8% Asian 3% Native American 1%
- Hispanic origin (detail)
- Mexican 26% Puerto Rican 1%
- Common ancestry
- Slovak 2% Lithuanian 1% Romanian 1%
- Foreign-born
- 11% · Canada, Vietnam
- Languages at home
- 76% English-only · Spanish 21% Vietnamese 1% Tagalog/Filipino 1%
Political lean MEDSL · Tarrant
- 2024 margin
- Lean R (+5.1) · D 46.7% · R 51.9% · Other 1.4%
- 2008→2024 swing
- +6.6pp toward D · 2008: -11.7pp · 2024: -5.1pp
- All cycles
- 2024: R+5.1 2020: D+0.2 2016: R+8.7 2012: R+15.7 2008: R+11.7
Not yet ingested
- Civics
- —
Market trends
- HPI YoY
- ▼ -141.39%
- Current HPI
- 294.2459
- Rent YoY
- ▼ -0.18%
- Metro
- Dallas-Fort Worth-Arlington, TX
- State GDP YoY
- ▲ 3.95%
- F500 in state
- 110
Industry mix (Fortune 500 HQ in TX)
| Industry | F500 HQs | Revenue |
|---|---|---|
| Energy | 16 | $1,198B |
|
||
| Technology | 5 | $198B |
|
||
| Engineering / Construction | 4 | $72B |
|
||
| Energy Services | 3 | $60B |
|
||
| Utilities | 3 | $41B |
|
||
| Healthcare | 2 | $330B |
|
||
Price history
5 events — show timeline
- 2026-05-05 Pending — NTREIS
- 2026-04-25 Contingent — NTREIS
- 2026-04-18 Relisted — NTREIS
- 2026-04-15 Contingent — NTREIS
- 2026-03-12 Listed $210,000 NTREIS
Property tax history
+4.5%/yrLatest (2025): $4,601 · +1.2% YoY. Source: county tax records.
Cash-flow waterfall
monthlySold comps — $/sqft
last 12 mo · ≤1 miLoading sold comps…