3324 W 19th Ave #111 · Kennewick, WA
Flood risk 1/10 · Minimal
- FEMA flood zone
- —
- Chance of flooding over 30 yrs
- 0.0%
- Est. flood insurance / yr
- —
Fire risk 4/10 · Minor
- Est. fire insurance / yr
- $604 – $1,122
Heat risk 4/10 · Minor
- Hot days now (above 99°F)
- 6 days/yr
- Hot days in 30 yrs
- 13 days/yr
Wind risk 1/10 · Minimal
- Chance of severe wind over 30 yrs
- —
Air-quality risk 8/10 · Major
- Unhealthy air days now
- 14 days/yr
- Unhealthy air days in 30 yrs
- 15 days/yr
Risk factors via First Street. Map © Google.
Why this score? — see what drove the B grade
The composite is a weighted blend of 9 inputs, each scored 0–100. Each bar is that input's sub-score; the figure is the points it added to the 100-point composite (weight × sub-score).
- Cash flow +30.0/30.0
- 1% rule +10.0/10.0
- DSCR +10.0/10.0
- ARV discount +7.5/15.0
- Schools +4.6/10.0
- Condition / age +4.0/5.0
- Livability +3.9/5.0
- Rent growth +2.5/5.0
- Appreciation +0.0/10.0
$65,000
🖨 Deal sheet 📄 Offer letter ✓ Due diligence
Listing remarks MLS
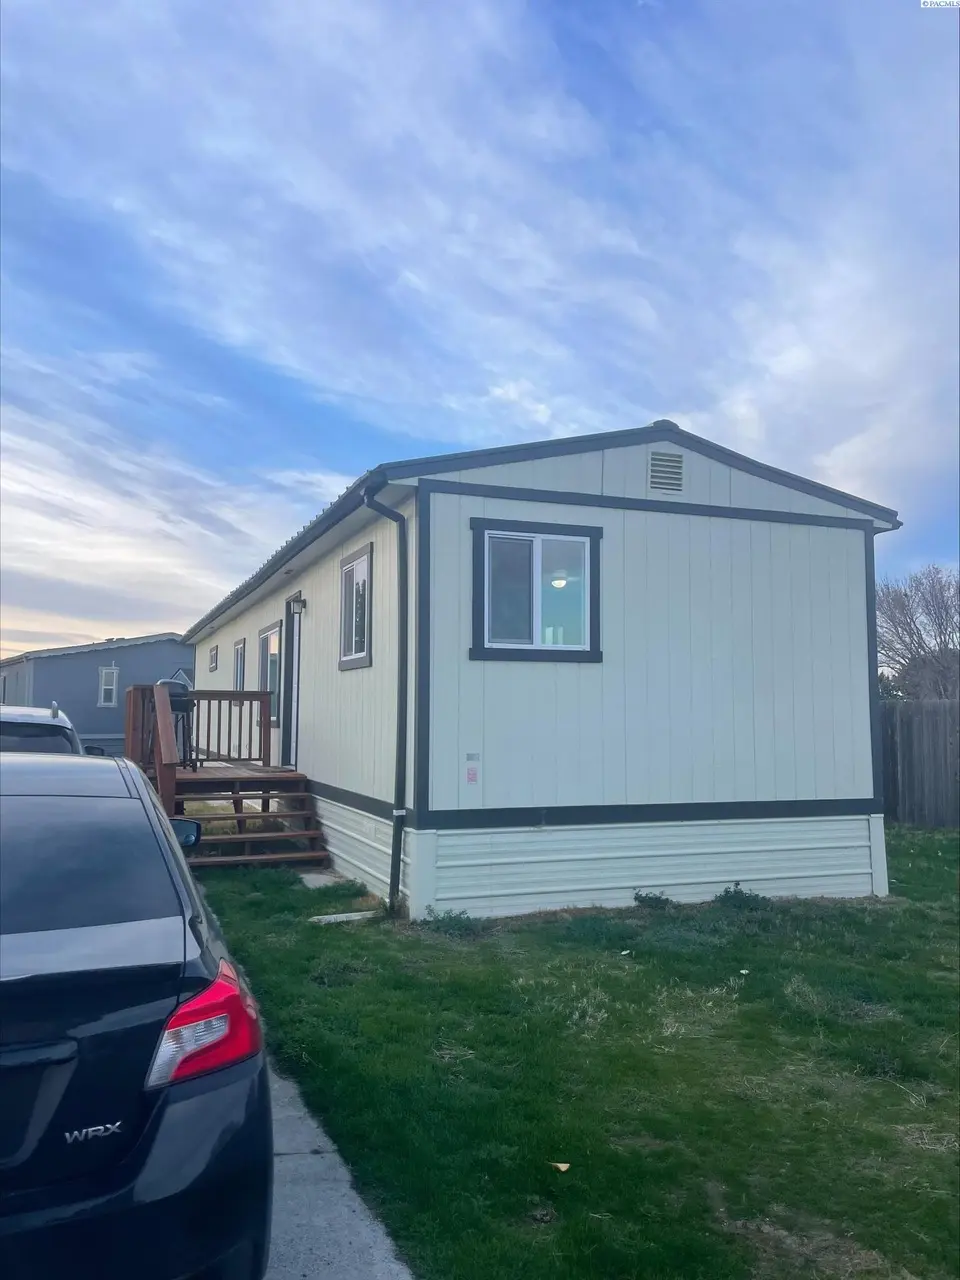
MLS# 289122 Move-in ready and beautifully reimagined! Welcome to this fully remodeled 1980 Redman Flamingo, tucked away at the end of a quiet street in the desirable Sun Meadows park. Spanning 924 sq. ft. , this home has been transformed from top to bottom with brand-new windows, stylish flooring, a pristine kitchen, and a spacious bathroom. You’ll love the roominess of the two large bedrooms and the peace of mind that comes with a fully updated space. To make your move even easier, all appliances are included! This is the perfect blend of modern comfort and peaceful living—schedule your tour today!
Key facts
- Fully remodeled
- Brand-new windows
- Spacious bathroom
Tags
Neighborhood map
What this means for you Summary
Snapshot
- This is a 2-bed/1.0-bath single-family listed at $65k. Condition is rated good.
Deal economics
- At list price, monthly cash flow is $795 ($10k/yr) — positive.
- The deal already cash-flows at list — no discount required.
- Meets the 1% rule at list price ($2k rent vs $65k).
- Recommended offer: $57k (12.0% below list) — sets the bar for market timing.
- Cap rate 21.0% vs local median 3.3% in Kennewick — top-decile yield for the area; either an underpriced asset or a hidden risk that comps aren't pricing in. Stress-test before assuming the spread holds.
Location & tenants
- Location reads 78/100 on livability (#131 in WA, #2,599 nationally) — a middle-class / working-renter tenant base. Strengths: commute A+, housing A+, health & safety A; Watch: schools D+, amenities D+, crime F.
- Kennewick School District (urban): math 43% / reading 58% proficiency, ranked #141 of 291 in WA (top 48%) — acceptable for families but not a draw, mixed tenant base, ~2y average lease.
- Market conditions: 309 active listings in the ZIP; 39 comparable units currently listed for rent nearby; rentals at typical pace (median 21d on market — plan ~3-4 weeks tenant-placement turnaround); high-income renter base; 1,532 units permitted in Benton County in 2024 (389 in 5+ unit buildings).
- This rent is only 17% of the median local income ($111k/yr) — well below the 30% rent-burden line; pricing power to push rent on renewal without tenant pushback.
Forward outlook
- Local home prices are declining (-3.0%/yr); year-one equity from $449 of loan paydown is wiped out by about $2k of value loss. Plan a longer hold.
- Benton County population projected at +32% by 2050 — long-run rental-demand tailwind backs the buy-and-hold thesis.
- At projected returns (-3.0% appreciation + 3.0% rent growth), your $18k cash investment doubles in ~3 years — after that, you're playing with house money.
Negotiation context
- It's been on market 182 days — a 12% lower offer ($57k) is reasonable based on typical stale-listing flexibility.
Questions for the listing agent
- It's been on market 182 days. Have you received any prior offers? Is the seller open to a 12% concession, seller financing, or rate buy-down credit?
- Why hasn't it sold? Are there any deal-killer items the seller is aware of (foundation, flood, title, zoning, code violations)?
- Is there a deadline driving the sale (1031 exchange, divorce, estate, relocation)? That informs how much negotiation room exists.
- Schools are D-rated, which usually means shorter tenancies and higher turnover. Who's the typical renter profile here, and what's been the actual vacancy rate?
- Crime grade is F in this area — have there been break-ins, vandalism, or insurance claims at this property in the last 3 years? What carrier currently insures it and at what premium?
- What's the average days-on-market for RENTAL listings here right now (not sales)? A rising rental-DOM trend means longer vacancies and softer asking-rent achievability than the comps imply.
- What's the recent tenant-quality profile in this submarket — average credit score on applications, eviction rate, late-payment / NSF rate, and stable-employment percentage? A property-management company in the area should have these aggregated.
- How much new for-sale + rental construction is in the pipeline within 1–3 miles? Heavy new supply typically softens prices + rents 12–24 months out; constrained supply supports both.
Investment metrics
- 1% rule
- 2.35% ✓
- Cap rate
- 20.98%
- Cash-on-cash
- 52.44%
- DSCR
- 3.33
- GRM
- 3.5
CMA / ARV
- ARV (median comp)
- $319,436
- List price
- $65,000
- Delta
- -79.65%
- Verdict
- UNDERPRICED
- Comps
- 20 within 1.0 mi
Show comp detail 1 sale within ~0.75 mi
| Address | Dist | Beds/Ba | Sqft | Sold | Price | $/sf | Match |
|---|---|---|---|---|---|---|---|
| 3510 W 10th Ave Unit D | 0.34mi | 2/1.0 | 830 (+5%) | 21mo | $1,095 | $1 | 58 |
Match score weights: distance 35% · size 25% · config 20% · recency 20%. Top-matched comps best support the ARV.
Projected returns pro-forma
-3.0% appreciation · 3.0% rent growth · sell at horizon
- IRR
- 50.4%
- Equity multiple
- 3.20×
- Total profit
- $40,127
- Equity at exit
- $9,692
- IRR
- 55.8%
- Equity multiple
- 6.50×
- Total profit
- $100,174
- Equity at exit
- $5,620
Cash invested: $18,200 (down + closing). Projections, not guarantees.
Landlord ↔ Tenant lean methodology
- Overall (STATE)
- 28 Tenant-Leaning
- State Washington
- 28 Tenant-Leaning · D+8
- County
- — inherits STATE
- City
- — inherits STATE
ZIP-level market 99338
- Active inventory
- 309
- Price-to-rent
- 3.5×
Monthly cashflow live
- Estimated rent
- $1,527 high interval (Pro) →
- Mortgage (P&I)
- −$341
- Tax from tax record
- −$43 /mo · $518/yr
- Insurance
- −$27
- HOA
- −$0
- Vacancy / Maint / Mgmt
- −$321
- Net cashflow
- $795
Break-even live
UW: 25.0% down · 7.5% · 30yr · 1.5% tax · 5.0% vac · 8.0% maint · 8.0% mgmt
Financing live
Cash to close
- Down payment
- $16,250
- Closing costs
- $1,950
- Reserves months
- —
- Total cash needed
- —
Loan-product check · same deal, 3 products live
Conventional
25% down · 7.5% · 30yr
- Down + closing
- —
- Monthly P&I
- —
- Monthly cashflow
- —
- DSCR
- —
- Eligible?
- —
Personal DTI + credit; lowest rate.
DSCR
20% down · 8.5% · 30yr
- Down + closing
- —
- Monthly P&I
- —
- Monthly cashflow
- —
- DSCR
- —
- Eligible?
- —
No personal income docs; deal must DSCR.
Hard money
10% down · 12.0% · 12mo
- Down + closing
- —
- Monthly P&I
- —
- Monthly cashflow
- —
- DSCR
- —
- Eligible?
- —
Short-term bridge; refi at stabilization.
Rent comps 39 comps
| Address | Beds | Baths | Sqft | Rent | $/sqft | DOM | Units | Dist |
|---|---|---|---|---|---|---|---|---|
| 3611 W 17th Pl Unit A Kennewick, WA | 2.0 | 1.0 | 970 | $1,495 | $1.54 | 21d | 1 | 0.29mi |
| 2652 W 15th Ave Kennewick, WA | 2.0–3.0 | 2.0 | 1152 | $1,599 | $1.39 | 13d | 5 | 0.36mi |
| 3113 W 7th Ave Unit D110 Kennewick, WA | 2.0 | 2.5 | 1000 | $1,750 | $1.75 | 13d | 1 | 0.50mi |
| 3426 W 7th Ave Unit A130 Kennewick, WA | 2.0 | 2.0 | 1000 | $1,650 | $1.65 | 43d | 1 | 0.56mi |
| 3426 W 7th Ave Kennewick, WA | 2.0 | 2.0 | 1000 | $1,600 | $1.60 | 21d | 1 | 0.56mi |
| 3708 W 6th Ave Unit B Kennewick, WA | 2.0 | 1.0 | 918 | $1,325 | $1.44 | 43d | 1 | 0.67mi |
| 455 S Morain St Kennewick, WA | 2.0 | 1.0 | 775 | $1,950 | $2.52 | 43d | 1 | 0.71mi |
| 4112 W 24th Ave Kennewick, WA | 1.0–2.0 | 1.0–2.0 | 681 | $1,875 | $2.75 | 21d | 4 | 0.72mi |
| 500 S Conway Pl Unit 500 Kennewick, WA | 2.0 | 1.0 | 950 | $1,500 | $1.58 | 43d | 1 | 0.76mi |
| 400 S Morain St #7 Kennewick, WA | 3.0 | 2.5 | 1100 | $1,500 | $1.36 | 21d | 1 | 0.78mi |
| 337 S Johnson St Unit A Kennewick, WA | 1.0 | 1.0 | 550 | $975 | $1.77 | 43d | 1 | 0.78mi |
| 337 S Johnson St Unit F Kennewick, WA | 1.0 | 1.0 | 550 | $875 | $1.59 | 21d | 1 | 0.78mi |
| 3120 W 4th Ave Kennewick, WA | 2.0 | 1.0 | 963 | $1,550 | $1.61 | 13d | 1 | 0.79mi |
| 3120 W 4th Ave Apt 120 Kennewick, WA | 2.0 | 1.0 | 963 | $1,625 | $1.69 | 13d | 1 | 0.79mi |
| 3120 W 4th Ave Unit 360 Kennewick, WA | 2.0 | 1.0 | 963 | $1,550 | $1.61 | 43d | 1 | 0.79mi |
| 325 S Johnson St Kennewick, WA | 2.0 | 1.5 | 1100 | $1,495 | $1.36 | 43d | 1 | 0.80mi |
| 513 S Anderson St Kennewick, WA | 2.0 | 1.0 | 720 | $1,495 | $2.08 | 21d | 1 | 0.83mi |
| 130 S Conway Pl Kennewick, WA | 2.0 | 1.0 | 852 | $1,299 | $1.52 | 13d | 1 | 0.94mi |
| E 6th Ave Kennewick, WA | 2.0 | 1.0 | 1100 | $1,500 | $1.36 | 43d | 1 | 0.98mi |
| 1816 W 21st Ave Unit C Kennewick, WA | 3.0 | 2.0 | 1120 | $1,495 | $1.33 | 13d | 1 | 0.98mi |
| 12 S Morain St Kennewick, WA | 1.0–3.0 | 1.0 | 604 | $1,249 | $2.07 | 13d | 3 | 1.01mi |
| 3703 W Kennewick Ave Kennewick, WA | 1.0–2.0 | 1.0 | 782 | $1,594 | $2.04 | 13d | 8 | 1.02mi |
| 119 S Conway Pl Kennewick, WA | 2.0 | 1.0 | 711 | $1,200 | $1.69 | 21d | 1 | 1.05mi |
| 1608 W 14th Ave Unit 1614 Kennewick, WA | 2.0 | 1.0 | 750 | $995 | $1.33 | 21d | 1 | 1.16mi |
| 4108 W Albany Ave Unit A-D Kennewick, WA | 2.0 | 1.5 | 945 | $1,395 | $1.48 | 43d | 1 | 1.21mi |
| 1702 W 7th Pl Unit B Kennewick, WA | 2.0 | 1.0 | 950 | $1,050 | $1.11 | 43d | 1 | 1.21mi |
| 9 N Waverly Pl Kennewick, WA | 1.0 | 1.0 | 600 | $1,222 | $2.04 | 13d | 2 | 1.22mi |
| 1618 W 7th Pl Unit A Kennewick, WA | 2.0 | 1.0 | 920 | $1,050 | $1.14 | 43d | 1 | 1.22mi |
| 200 S Union St Kennewick, WA | 2.0 | 1.0–1.5 | 860 | $1,348 | $1.57 | 13d | 2 | 1.23mi |
| 89 N Waverly Pl Apt E Kennewick, WA | 2.0 | 1.0 | 1000 | $1,250 | $1.25 | 43d | 1 | 1.26mi |
| 1619 W 5th Ave Unit A Kennewick, WA | 2.0 | 1.0 | 981 | $1,450 | $1.48 | 21d | 1 | 1.28mi |
| 1110 S Newport St Unit 1110ne B Kennewick, WA | 2.0 | 2.0 | 995 | $1,300 | $1.31 | 43d | 1 | 1.38mi |
| 505 S Olympia St Kennewick, WA | 2.0 | 1.0 | 695 | $1,525 | $2.19 | 43d | 1 | 1.43mi |
| N Johnson St Kennewick, WA | 2.0 | 1.5 | 1100 | $1,450 | $1.32 | 21d | 3 | 1.44mi |
| 2525 W Grand Ronde Ave Kennewick, WA | 2.0–3.0 | 1.0–2.0 | 1044 | $1,345 | $1.29 | 13d | 4 | 1.47mi |
| 505 S Olympia St Apt H1 Kennewick, WA | 3.0 | 1.0 | 890 | $1,675 | $1.88 | 43d | 1 | 1.48mi |
| 505 S Olympia St Apt E4 Kennewick, WA | 2.0 | 1.0 | 695 | $1,285 | $1.85 | 13d | 1 | 1.48mi |
| 505 S Olympia St Unit 1326 K3 Kennewick, WA | 3.0 | 1.0 | 945 | $1,650 | $1.75 | 21d | 1 | 1.48mi |
| 1105 W 10th Ave Kennewick, WA | 1.0–2.0 | 1.0 | 687 | $1,306 | $1.90 | 13d | 8 | 1.48mi |
Listing history 5 events
-
2026-05-06price $65,000 618-char remark
Show marketing remark (618 chars)
MLS# 289122 Move-in ready and beautifully reimagined! Welcome to this fully remodeled 1980 Redman Flamingo, tucked away at the end of a quiet street in the desirable Sun Meadows park. Spanning 924 sq. ft. , this home has been transformed from top to bottom with brand-new windows, stylish flooring, a pristine kitchen, and a spacious bathroom. You’ll love the roominess of the two large bedrooms and the peace of mind that comes with a fully updated space. To make your move even easier, all appliances are included! This is the perfect blend of modern comfort and peaceful living—schedule your tour today!
-
2026-04-17price $69,000 618-char remark
Show marketing remark (618 chars)
MLS# 289122 Move-in ready and beautifully reimagined! Welcome to this fully remodeled 1980 Redman Flamingo, tucked away at the end of a quiet street in the desirable Sun Meadows park. Spanning 924 sq. ft. , this home has been transformed from top to bottom with brand-new windows, stylish flooring, a pristine kitchen, and a spacious bathroom. You’ll love the roominess of the two large bedrooms and the peace of mind that comes with a fully updated space. To make your move even easier, all appliances are included! This is the perfect blend of modern comfort and peaceful living—schedule your tour today!
-
2026-02-18price $73,000 618-char remark
Show marketing remark (618 chars)
MLS# 289122 Move-in ready and beautifully reimagined! Welcome to this fully remodeled 1980 Redman Flamingo, tucked away at the end of a quiet street in the desirable Sun Meadows park. Spanning 924 sq. ft. , this home has been transformed from top to bottom with brand-new windows, stylish flooring, a pristine kitchen, and a spacious bathroom. You’ll love the roominess of the two large bedrooms and the peace of mind that comes with a fully updated space. To make your move even easier, all appliances are included! This is the perfect blend of modern comfort and peaceful living—schedule your tour today!
-
2026-01-13price $81,900 618-char remark
Show marketing remark (618 chars)
MLS# 289122 Move-in ready and beautifully reimagined! Welcome to this fully remodeled 1980 Redman Flamingo, tucked away at the end of a quiet street in the desirable Sun Meadows park. Spanning 924 sq. ft. , this home has been transformed from top to bottom with brand-new windows, stylish flooring, a pristine kitchen, and a spacious bathroom. You’ll love the roominess of the two large bedrooms and the peace of mind that comes with a fully updated space. To make your move even easier, all appliances are included! This is the perfect blend of modern comfort and peaceful living—schedule your tour today!
-
2025-11-26$84,900 Active 618-char remark
Show marketing remark (618 chars)
MLS# 289122 Move-in ready and beautifully reimagined! Welcome to this fully remodeled 1980 Redman Flamingo, tucked away at the end of a quiet street in the desirable Sun Meadows park. Spanning 924 sq. ft. , this home has been transformed from top to bottom with brand-new windows, stylish flooring, a pristine kitchen, and a spacious bathroom. You’ll love the roominess of the two large bedrooms and the peace of mind that comes with a fully updated space. To make your move even easier, all appliances are included! This is the perfect blend of modern comfort and peaceful living—schedule your tour today!
ⓘ Source: listings_history table (triggers on properties + properties_extension) + one-shot
backfill from property_details.listing_events for pre-trigger history.
Tax reassessment forecast WA · Resets to sale price
- Current annual tax
- $518 · $43/mo
- Projected year-2 tax
- $637 · $53/mo
- Expected delta
- +$119/yr (+$10/mo · 22.9%)
ⓘ Screening estimate from a state-policy table — verify with the county assessor before closing.
Climate risk First Street
- Flood 1/10 Low 0% chance over 30 yrs
- Wildfire 4/10 Moderate
- Heat 4/10 Moderate 6 d/yr ≥99°F today · 13 d/yr by 30 yrs out
- Wind 1/10 Low
- Air quality 8/10 Severe 14 unhealthy d/yr today · 15 by 30 yrs out
Nearby sold comps map
Loading sold comps map…
Walkable amenities ~0.75 mi
Loading nearby amenities…
Taxation est. · year 1
- Rental income
- $18,328
- − Mortgage interest
- −$3,641
- − Property taxes
- −$518
- − Insurance
- −$325
- − Repairs & maintenance
- −$1,466
- − Management
- −$1,466
- − Depreciation
- −$1,891
- Taxable income
- $9,020
- Est. tax owed @ 24.0%
- −$2,165
- After-tax cash flow
- $7,380/yr
For passive investors: Depreciation is non-cash, so a rental often shows a tax loss while cash-flowing — sheltering income. Rental losses are passive: they offset passive income freely, and up to $25,000/yr can offset ordinary (W-2) income if you actively participate and your MAGI is under $100k (phasing out to $0 by $150k); unused losses carry forward. On sale, claimed depreciation is recaptured at up to 25%, and gains may owe capital-gains tax (a 1031 exchange can defer both). Figures are a year-1 estimate at your 24.0% rate — not tax advice; consult a CPA.
Condition & rehab AI · 7 photos
This fully remodeled 1980 Redman Flamingo is move-in ready and beautifully reimagined, featuring modern updates and a spacious layout.
Value-add opportunities
- Both Painting the exterior and interior walls — Fresh paint can enhance curb appeal and interior aesthetics.
- Both Landscaping improvements — Enhanced landscaping can increase curb appeal and property value.
- Both Adding a small front porch — A front porch can improve curb appeal and provide a welcoming entrance.
Renovation cost estimate screening
Value-add ROI direction
- Both Painting the exterior and interior walls — Fresh paint can enhance curb appeal and interior aesthetics. ↑
- Both Landscaping improvements — Enhanced landscaping can increase curb appeal and property value. ↑
- Both Adding a small front porch — A front porch can improve curb appeal and provide a welcoming entrance. ↑
ⓘ Cost ranges are severity-bucket heuristics (US national rule-of-thumb). Get contractor quotes + a written scope before underwriting a rehab budget.
Schools (NCES district)
- District
- Kennewick School District
- NCES district ID
- 5303930
- Math proficiency
- 43% ▼ -1.00%
- Reading proficiency
- 58% ▬ 0.00%
- Median HH income
- $54,191
- Composite
- 45.56/100
- National rank
- #5667
- State rank
- #141 of 291 in WA
Livability — Kennewick
- Score
- 78/100
- State rank
- #131
- US rank
- #2599
Category grades
Schools grade is shown separately in the Schools card above.
Census & demographics
- Census place
- Kennewick, WA
- County
- Benton County · 186,895 people
- City population
- 104,655
- Metro
- Kennewick-Richland, WA
- Population (ZIP)
- 20,633
- Household income
- $111,042
- Rent vs Own
- Severe rent burden
- 281.0
Population outlook (Benton County) Hauer SSP2
- Today (2025)
- 219,421 people
- By 2030
- 233,813 · +6.6%
- By 2040
- 262,134 · +19.5%
- By 2050
- 290,100 · +32.2%
- By 2075
- 363,525 · +65.7%
- By 2100
- 418,667 · +90.8%
Race, ethnicity, and origin ACS 2023
- Neighborhood character
- Predominantly White (74%)
- Race & ethnicity
- White 74% Hispanic / Latino 16% Two or more races 10% Black 2% Asian 2%
- Hispanic origin (detail)
- Mexican 15%
- Common ancestry
- Portuguese 3% Slovak 3% Iranian 2%
- Foreign-born
- 9% · Canada
- Languages at home
- 83% English-only · Spanish 10% Arabic 2% Other Indo-European 1%
Political lean MEDSL · Benton
- 2024 margin
- Strong R (+21.9) · D 37.7% · R 59.6% · Other 2.7%
- 2008→2024 swing
- +4.2pp toward D · 2008: -26.1pp · 2024: -21.9pp
- All cycles
- 2024: R+21.9 2020: R+21.0 2016: R+26.6 2012: R+27.0 2008: R+26.1
Not yet ingested
- Civics
- —
Market trends
- HPI YoY
- ▼ -167.63%
- Current HPI
- 229.7474
- Rent YoY
- —
- Metro
- Kennewick-Richland, WA
- State GDP YoY
- ▲ 4.65%
- F500 in state
- 22
Industry mix (Fortune 500 HQ in WA)
| Industry | F500 HQs | Revenue |
|---|---|---|
| Retail | 2 | $269B |
|
||
| Technology / Retail | 1 | $638B |
|
||
| Technology | 1 | $245B |
|
||
| Telecommunications | 1 | $38B |
|
||
| Food / Beverage | 1 | $36B |
|
||
| Automotive / Trucks | 1 | $34B |
|
||
Price history
-23.4% since first listed5 events — show timeline
- 2026-05-06 Price Changed $65,000 PACMLS
- 2026-04-17 Price Changed $69,000 PACMLS
- 2026-02-18 Price Changed $73,000 PACMLS
- 2026-01-13 Price Changed $81,900 PACMLS
- 2025-11-26 Listed $84,900 PACMLS
Property tax history
-2.7%/yrLatest (2026): $518 · -5.7% YoY. Source: county tax records.
Cash-flow waterfall
monthlySold comps — $/sqft
last 12 mo · ≤1 miLoading sold comps…