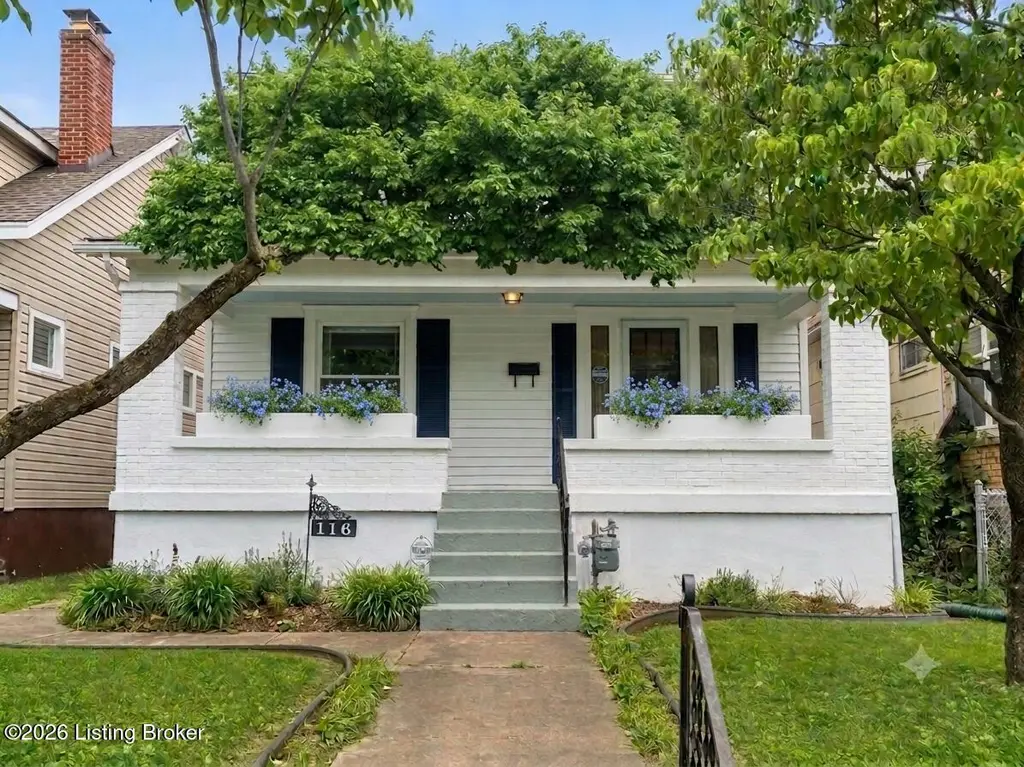
116 N 42nd St · Louisville, KY
Flood risk 1/10 · Minimal
- FEMA flood zone
- X (shaded)
- Chance of flooding over 30 yrs
- 0.0%
- Est. flood insurance / yr
- $473 – $860
Fire risk 1/10 · Minimal
- Est. fire insurance / yr
- $839 – $1,559
Heat risk 5/10 · Moderate
- Hot days now (above 104°F)
- 7 days/yr
- Hot days in 30 yrs
- 20 days/yr
Wind risk 2/10 · Minimal
- Chance of severe wind over 30 yrs
- 1.0%
Air-quality risk 2/10 · Minimal
- Unhealthy air days now
- 1 days/yr
- Unhealthy air days in 30 yrs
- 2 days/yr
Risk factors via First Street. Map © Google.
Why this score? — see what drove the D- grade
The composite is a weighted blend of 9 inputs, each scored 0–100. Each bar is that input's sub-score; the figure is the points it added to the 100-point composite (weight × sub-score).
- Appreciation +10.0/10.0
- Cash flow +9.4/30.0
- Livability +3.2/5.0
- 1% rule +2.8/10.0
- DSCR +2.6/10.0
- Rent growth +2.6/5.0
- Condition / age +2.5/5.0
- Schools +2.3/10.0
- ARV discount +0.0/15.0
$142,200
🖨 Deal sheet (PDF) 📄 Offer letter ✓ Due diligence
Listing remarks MLS
Adorable bungalow WITH BASEMENT available now! Home offers lots of curb appeal with the cozy covered front porch shaded by mature trees and tidy fenced in backyard. The interior features beautiful trim work throughout, making it a charming home. Includes updated HVAC, waterproofed basement, and finished attic space, offering a great living space upstairs. Just a little TLC will turn this house of possibilities into a gorgeous home.
Key facts
- Renovated bathroom
- Front porch
- Original features
Tags
Property features AI
Finance
- Other: Subdivision: Frazee Place
- HOA & community: No association fee
Exterior
- Utilities: Electricity connected; Natural gas available
- Home design: Single-family residence, Bungalow style; 2 stories; Built in 1930
- Construction: Shingle roof; Poured concrete foundation; Vinyl siding, wood frame, and aluminum siding construction
- Exterior features: Partial chain-link fencing; Sidewalk; Cleared, level lot; Lot dimensions approximately 30 x 123
Interior
- Kitchen: Kitchen on the first floor
- Bedrooms: 2 bedrooms total; One bedroom on the first floor; One bedroom on the second floor; First-floor primary bedroom
- Bathrooms: One full bathroom located on the first floor
- Heating & cooling: Forced air heating (natural gas); Central air conditioning
- Interior features: Unfinished basement; 8 closets; 7 total rooms; Dining room; Living room; Other room on second floor
- Laundry & utility: No first-floor laundry
Neighborhood map
What this means for you Summary
Snapshot
- This is a 2-bed/1.0-bath single-family listed at $142k.
Deal economics
- At list price, monthly cash flow is $-102 ($-1k/yr) — negative.
- To cash-flow at today's rent, offer at most $127k (10.4% below list).
- To meet the 1% rule (rent ≥ 1% of price), the offer needs to be $111k (21.6% below list).
- Recommended offer: $111k (21.6% below list) — sets the bar for 1% rule.
Location & tenants
- Location reads 63/100 on livability (#333 in KY) — a middle-class / working-renter tenant base. Strengths: cost of living A+, housing A+; Watch: employment C-, health & safety D+, crime F.
- Jefferson County (urban): math 19% / reading 35% proficiency, ranked #121 of 165 in KY (top 73%) — low school quality limits family demand, transient renter base, plan for 1-2y turnover.
- Zoned schools: King Elementary (math 2% / reading 8%, grade F, #670 of 676 statewide, top 100%, 299 students, 90% FRL); Kammerer Middle (math 21% / reading 42%, grade F, #125 of 217 statewide, top 63%, 720 students, 52% FRL); Pleasure Ridge Park High (math 16% / reading 20%, grade F, #220 of 254 statewide, top 87%, 1,517 students, 63% FRL).
- Market conditions: Rents flat; 141 active listings in the ZIP; 40 comparable units currently listed for rent nearby; rentals at typical pace (median 21d on market — plan ~3-4 weeks tenant-placement turnaround); lower-income renter base — watch delinquency; 2,836 units permitted in Jefferson County in 2024 (1,558 in 5+ unit buildings).
- This rent runs 37% of the median local income ($36k/yr) — at the standard rent-burdened threshold; future hikes will face affordability resistance.
Forward outlook
- In year one you build about $15k of equity ($983 loan paydown + $14k appreciation (10.0% local appreciation)).
- Jefferson County population projected at +13% by 2050 — modest demand growth; plan on rents tracking national, not racing it.
- By year 3, paydown + projected appreciation supports a ~$38k cash-out refi (75% LTV) — recoverable capital for the next deal without selling this one.
Negotiation context
- Only 11 days on market — expect competitive offers; lowballing is unlikely to land.
- 3 sale attempts since 5y ago with the ask held roughly flat each time — persistent listings suggest the price (not the market) is what's stuck; bring a comps-based counter.
- Current owner paid $55k; list at $142k implies a 159% gain — meaningful room to come down on a strong offer.
Risks & watch-outs
- Watch-outs: built in 1930 — expect roof / HVAC / electrical / plumbing capex.
- Climate carrying-cost: extreme-heat days projected 7→20/yr by 2055 (HVAC capex compounding) — expect insurance premiums to compound above CPI over the hold.
Questions for the listing agent
- What do current leases actually rent for vs. the listed asking? Can we see a recent rent roll and the last 12 months of T-12 income?
- Built in 1930 — when were the roof, HVAC, electrical panel, plumbing, and water heater last replaced?
- Is there a deadline driving the sale (1031 exchange, divorce, estate, relocation)? That informs how much negotiation room exists.
- Schools are D-rated, which usually means shorter tenancies and higher turnover. Who's the typical renter profile here, and what's been the actual vacancy rate?
- Crime grade is F in this area — have there been break-ins, vandalism, or insurance claims at this property in the last 3 years? What carrier currently insures it and at what premium?
- The area grade is low — what's the realistic commute time and amenity access for the typical tenant pool here? Any planned neighborhood developments (good or bad) we should know about?
- What's the average days-on-market for RENTAL listings here right now (not sales)? A rising rental-DOM trend means longer vacancies and softer asking-rent achievability than the comps imply.
- What's the recent tenant-quality profile in this submarket — average credit score on applications, eviction rate, late-payment / NSF rate, and stable-employment percentage? A property-management company in the area should have these aggregated.
- How much new for-sale + rental construction is in the pipeline within 1–3 miles? Heavy new supply typically softens prices + rents 12–24 months out; constrained supply supports both.
Investment metrics
- 1% rule
- 0.78% ✗
- Cap rate
- 5.43%
- Cash-on-cash
- -3.08%
- DSCR
- 0.86
- GRM
- 10.6
CMA / ARV
- ARV (on-the-fly)
- $99,588
- Comps found
- 12
Show comp detail 12 sales within ~0.75 mi
| Address | Dist | Beds/Ba | Sqft | Sold | Price | $/sf | Match |
|---|---|---|---|---|---|---|---|
| 356 N 43rd St | 0.21mi | 2/1.0 | 1,200 (+4%) | 1mo | $95,000 | $79 | 83 |
| 125 N 46th St | 0.25mi | 2/1.0 | 1,107 (-4%) | 6mo | $95,000 | $86 | 76 |
| 127 N 39th St | 0.26mi | 2/1.0 | 1,197 (+3%) | 8mo | $80,000 | $67 | 76 |
| 100 Boston Ct | 0.09mi | 3/1.0 (+1) | 1,080 (-7%) | 9mo | $35,000 | $32 | 72 |
| 429 N 44th St | 0.22mi | 2/1.5 | 1,268 (+10%) | 1mo | $112,000 | $88 | 71 |
| 220 N 39th St | 0.23mi | 3/2.0 (+1) | 1,240 (+7%) | 4mo | $145,000 | $117 | 65 |
| 431 Amy Ave | 0.57mi | 2/1.0 | 1,223 (+6%) | 5mo | $80,000 | $65 | 60 |
| 210 N 35th St | 0.52mi | 3/1.0 (+1) | 1,119 (-3%) | 7mo | $100,000 | $89 | 59 |
| 117 N 34th St | 0.64mi | 3/1.0 (+1) | 1,130 (-2%) | 4mo | $34,000 | $30 | 58 |
| 212 N 37th St | 0.38mi | 3/1.0 (+1) | 1,036 (-10%) | 8mo | $121,000 | $117 | 53 |
| 4109 Bank St | 0.46mi | 3/1.0 (+1) | 990 (-14%) | 3mo | $157,325 | $159 | 47 |
| 4149 W Muhammad Ali Blvd | 0.55mi | 3/1.0 (+1) | 1,327 (+15%) | 3mo | $88,000 | $66 | 42 |
Match score weights: distance 35% · size 25% · config 20% · recency 20%. Top-matched comps best support the ARV.
Projected returns pro-forma
10.0% appreciation · 0.51% rent growth · sell at horizon
- IRR
- 21.3%
- Equity multiple
- 2.71×
- Total profit
- $68,230
- Equity at exit
- $128,105
- IRR
- 18.8%
- Equity multiple
- 6.05×
- Total profit
- $201,091
- Equity at exit
- $276,263
Cash invested: $39,816 (down + closing). Projections, not guarantees.
Landlord ↔ Tenant lean methodology
- Overall (STATE)
- 83 Strongly Landlord-Friendly
- State Kentucky
- 83 Strongly Landlord-Friendly · R+16
- County
- — inherits STATE
- City
- — inherits STATE
ZIP-level market 40212
- Home prices YoY
- 11.0%
- Rents YoY
- 0.5%
- Active inventory
- 141
- Price-to-rent
- 10.6×
Monthly cashflow live
- Estimated rent
- $1,115 high interval (Pro) →
- Mortgage (P&I)
- −$746
- Tax est. 1.5%
- −$178 /mo · $2,133/yr
- Insurance
- −$59
- HOA
- −$0
- Vacancy / Maint / Mgmt
- −$234
- Net cashflow
- $-102
Break-even live
Sensitivity live
| Price | -10% $-4 | -5% $-53 | +0% $-102 | +5% $-151 | +10% $-200 |
|---|---|---|---|---|---|
| Rent | -10% $-190 | -5% $-146 | +0% $-102 | +5% $-58 | +10% $-14 |
| Rate | -1.0pp $-31 | -0.5pp $-66 | base $-102 | +0.5pp $-139 | +1.0pp $-177 |
UW: 25.0% down · 7.5% · 30yr · 1.5% tax · 5.0% vac · 8.0% maint · 8.0% mgmt
Financing live
Cash to close
- Down payment
- $35,550
- Closing costs
- $4,266
- Reserves months
- —
- Total cash needed
- —
Loan-product check · same deal, 3 products live
Conventional
25% down · 7.5% · 30yr
- Down + closing
- —
- Monthly P&I
- —
- Monthly cashflow
- —
- DSCR
- —
- Eligible?
- —
Personal DTI + credit; lowest rate.
DSCR
20% down · 8.5% · 30yr
- Down + closing
- —
- Monthly P&I
- —
- Monthly cashflow
- —
- DSCR
- —
- Eligible?
- —
No personal income docs; deal must DSCR.
Hard money
10% down · 12.0% · 12mo
- Down + closing
- —
- Monthly P&I
- —
- Monthly cashflow
- —
- DSCR
- —
- Eligible?
- —
Short-term bridge; refi at stabilization.
Rent comps 40 comps
| Address | Beds | Baths | Sqft | Rent | $/sqft | DOM | Units | Dist |
|---|---|---|---|---|---|---|---|---|
| 313 N 42nd St Louisville, KY | 3.0 | 1.0 | 900 | $1,250 | $1.39 | 5d | 1 | 0.12mi |
| 127 Boston Ct Louisville, KY | 2.0 | 1.0 | 725 | $1,100 | $1.52 | 25d | 1 | 0.17mi |
| 4143 W Market St Unit 2 Louisville, KY | 2.0 | 1.0 | 700 | $850 | $1.21 | 25d | 1 | 0.17mi |
| 4141 W Market St Unit 1 Louisville, KY | 2.0 | 1.0 | 771 | $925 | $1.20 | 4d | 1 | 0.19mi |
| 106 N 40th St Louisville, KY | 3.0 | 1.0 | 1325 | $1,220 | $0.92 | 5d | 1 | 0.20mi |
| 127 N 40th St Louisville, KY | 3.0 | 2.0 | 1500 | $1,570 | $1.05 | 5d | 1 | 0.21mi |
| 112 S 46th St Louisville, KY | 3.0 | 1.0 | 902 | $1,200 | $1.33 | 25d | 1 | 0.27mi |
| 3910 Garfield Ave Louisville, KY | 2.0 | 1.0 | 872 | $1,035 | $1.19 | 5d | 1 | 0.29mi |
| 3901 Jewell Ave Louisville, KY | 3.0 | 1.0 | 1069 | $1,140 | $1.07 | 22d | 1 | 0.30mi |
| 247 Cecil Ave Louisville, KY | 3.0 | 2.0 | 1083 | $1,305 | $1.20 | 21d | 1 | 0.34mi |
| 110 Hansbrough Pl Unit 101 Louisville, KY | 2.0 | 1.0 | 924 | $1,080 | $1.17 | 25d | 1 | 0.37mi |
| 302 Cecil Ave Louisville, KY | 2.0 | 1.0 | 984 | $1,025 | $1.04 | 17d | 1 | 0.37mi |
| 219 N 37th St Louisville, KY | 2.0 | 1.0 | 700 | $1,150 | $1.64 | 25d | 1 | 0.44mi |
| 320 N 36th St Louisville, KY | 3.0 | 1.0 | 830 | $1,225 | $1.48 | 17d | 1 | 0.47mi |
| 4020 Larkwood Ave Louisville, KY | 1.0 | 1.0 | 1446 | $785 | $0.54 | 25d | 1 | 0.50mi |
| 4018 Vermont Ave Unit 1 Louisville, KY | 2.0 | 1.0 | 700 | $699 | $1.00 | 5d | 1 | 0.65mi |
| 3819 River Park Dr Louisville, KY | 3.0 | 1.0 | 1108 | $1,090 | $0.98 | 22d | 1 | 0.74mi |
| 628 S 39th St Louisville, KY | 3.0 | 1.0 | 1448 | $1,220 | $0.84 | 17d | 1 | 0.84mi |
| 4309 Elliott Ave Unit 1 Louisville, KY | 2.0 | 1.0 | 750 | $650 | $0.87 | 5d | 1 | 0.90mi |
| 4309 Elliott Ave Unit 1 Louisville, KY | 2.0 | 1.0 | 750 | $695 | $0.93 | 25d | 1 | 0.90mi |
| 644 S 40th St Louisville, KY | 2.0 | 1.0 | 1200 | $1,500 | $1.25 | 4d | 1 | 0.90mi |
| 3421 River Park Dr Louisville, KY | 3.0 | 1.0 | 994 | $1,250 | $1.26 | 25d | 1 | 0.93mi |
| 648 S 37th St #3 Louisville, KY | 2.0 | 1.0 | 807 | $850 | $1.05 | 25d | 1 | 0.99mi |
| 2927 Rowan St Louisville, KY | 3.0 | 1.0 | 1008 | $1,205 | $1.20 | 13d | 1 | 0.99mi |
| 652 S 37th St #9 Louisville, KY | 3.0 | 1.0 | 1070 | $1,095 | $1.02 | 25d | 1 | 1.00mi |
| 2925 Slevin St Louisville, KY | 2.0 | 1.0 | 896 | $775 | $0.86 | 5d | 1 | 1.04mi |
| 3120 Bank St Unit B Louisville, KY | 2.0 | 1.0 | 750 | $795 | $1.06 | 25d | 1 | 1.07mi |
| 714 S 40th St #2 Louisville, KY | 3.0 | 1.0 | 1000 | $1,250 | $1.25 | 25d | 1 | 1.14mi |
| 509 N 31st St Louisville, KY | 2.0 | 1.0 | 800 | $725 | $0.91 | 17d | 1 | 1.15mi |
| 509 N 31st St Louisville, KY | 2.0 | 1.0 | 800 | $795 | $0.99 | 25d | 1 | 1.15mi |
| 714 S 42nd St Louisville, KY | 3.0 | 1.0 | 1078 | $1,150 | $1.07 | 17d | 1 | 1.17mi |
| 729 S 39th St Unit 1 Louisville, KY | 2.0 | 1.0 | 800 | $800 | $1.00 | 25d | 1 | 1.18mi |
| 666 Eastlawn Ave Louisville, KY | 2.0 | 1.0 | 936 | $895 | $0.96 | 17d | 1 | 1.24mi |
| 833 S 41st St Louisville, KY | 3.0 | 2.0 | 786 | $1,250 | $1.59 | 25d | 1 | 1.31mi |
| 836 S 41st St Louisville, KY | 3.0 | 1.0 | 1300 | $1,300 | $1.00 | 21d | 1 | 1.31mi |
| 823 S 38th St Louisville, KY | 3.0 | 1.0 | 1100 | $1,195 | $1.09 | 5d | 1 | 1.31mi |
| 522 N 29th St Louisville, KY | 3.0 | 1.0 | 1031 | $1,300 | $1.26 | 5d | 1 | 1.31mi |
| 803 S 35th St Louisville, KY | 3.0 | 1.0 | 1486 | $1,350 | $0.91 | 25d | 1 | 1.33mi |
| 353 N 27th St Louisville, KY | 2.0 | 1.0 | 1100 | $1,100 | $1.00 | 25d | 1 | 1.35mi |
| 701 Hazel St Unit 3 Louisville, KY | 2.0 | 1.0 | 832 | $800 | $0.96 | 12d | 1 | 1.35mi |
Listing history 7 events
-
2026-06-21days on market $142,200 Active 11 DOM
-
2026-06-18days on market $142,200 Active 8 DOM
-
2026-06-17days on market $142,200 Active 7 DOM
-
2026-06-16days on market $142,200 Active 6 DOM
-
2026-06-15days on market $142,200 Active 5 DOM
-
2026-06-13remarks 677-char remark
-
2026-06-13$142,200 Active 3 DOM
ⓘ Source: listings_history table (triggers on properties + properties_extension) + one-shot
backfill from property_details.listing_events for pre-trigger history.
Climate risk First Street
- Flood 1/10 Low FEMA zone X (shaded) · 0% chance over 30 yrs
- Wildfire 1/10 Low
- Heat 5/10 Major 7 d/yr ≥104°F today · 20 d/yr by 30 yrs out
- Wind 2/10 Low 100% chance of damaging wind over 30 yrs
- Air quality 2/10 Low 1 unhealthy d/yr today · 2 by 30 yrs out
Nearby sold comps map
Loading sold comps map…
Walkable amenities ~0.75 mi
Loading nearby amenities…
Taxation est. · year 1
- Rental income
- $13,375
- − Mortgage interest
- −$7,965
- − Property taxes
- −$2,133
- − Insurance
- −$711
- − Repairs & maintenance
- −$1,070
- − Management
- −$1,070
- − Depreciation
- −$4,137
- Taxable loss
- −$3,711
- Est. tax savings @ 24.0%
- +$891
- After-tax cash flow
- $-336/yr
For passive investors: Depreciation is non-cash, so a rental often shows a tax loss while cash-flowing — sheltering income. Rental losses are passive: they offset passive income freely, and up to $25,000/yr can offset ordinary (W-2) income if you actively participate and your MAGI is under $100k (phasing out to $0 by $150k); unused losses carry forward. On sale, claimed depreciation is recaptured at up to 25%, and gains may owe capital-gains tax (a 1031 exchange can defer both). Figures are a year-1 estimate at your 24.0% rate — not tax advice; consult a CPA.
Schools (NCES district)
- District
- Jefferson County
- NCES district ID
- 2102990
- Math proficiency
- 19% ▼ -17.00%
- Reading proficiency
- 35% ▼ -11.00%
- Median HH income
- $47,885
- Composite
- 23.45/100
- National rank
- #7884
- State rank
- #121 of 165 in KY
Livability — Louisville
- Score
- 63/100
- State rank
- #333
- US rank
- #15887
Category grades
Schools grade is shown separately in the Schools card above.
Census & demographics
- Census place
- Louisville, KY
- County
- Jefferson County · 790,184 people
- City population
- 769,292
- Metro
- Louisville/Jefferson County, KY-IN
- Population (ZIP)
- 14,661
- Household income
- $35,753
- Rent vs Own
- Severe rent burden
- 1148.0
Population outlook (Jefferson County) Hauer SSP2
- Today (2025)
- 823,112 people
- By 2030
- 849,343 · +3.2%
- By 2040
- 895,696 · +8.8%
- By 2050
- 933,630 · +13.4%
- By 2075
- 1,028,262 · +24.9%
- By 2100
- 1,072,675 · +30.3%
Race, ethnicity, and origin ACS 2023
- Neighborhood character
- Majority Black (60%)
- Race & ethnicity
- Black 60% White 37% Two or more races 2% Hispanic / Latino 1%
- Common ancestry
- Slovak 1% Lithuanian 1% Iranian 1%
- Foreign-born
- 1% · Canada
- Languages at home
- 98% English-only · Spanish 1%
Political lean MEDSL · Jefferson
- 2024 margin
- D (+16.6) · D 57.4% · R 40.9% · Other 1.7%
- 2008→2024 swing
- +4.5pp toward D · 2008: 12.0pp · 2024: 16.6pp
- All cycles
- 2024: D+16.6 2020: D+20.1 2016: D+13.3 2012: D+11.1 2008: D+12.0
Not yet ingested
- Civics
- —
Market trends
- HPI YoY
- ▲ 29.02%
- Current HPI
- 293.2624
- Rent YoY
- ▲ 0.51%
- Metro
- Louisville/Jefferson County, KY-IN
- State GDP YoY
- ▲ 1.81%
- F500 in state
- 4
Industry mix (Fortune 500 HQ in KY)
| Industry | F500 HQs | Revenue |
|---|---|---|
| Healthcare | 1 | $118B |
|
||
| Food / Beverage | 1 | $7B |
|
||
Price history
+184.4% since first listed10 events — show timeline
- 2026-06-13 Price Changed $142,200 Metro Search MLS
- 2026-06-11 Listed $142,200 Metro Search MLS
- 2026-06-11 Listing Removed — Metro Search MLS
- 2026-06-11 Listed $142,000 Metro Search MLS
- 2021-09-08 Sold (Public Records) $55,000 Public Records
- 2021-09-05 Pending — Metro Search MLS
- 2021-09-03 Sold (MLS) $55,000 Metro Search MLS
- 2021-08-23 Contingent — Metro Search MLS
- 2021-08-23 Price Changed $55,000 Metro Search MLS
- 2021-08-20 Listed $50,000 Metro Search MLS
Property tax history
-16.0%/yrLatest (2025): $74 · -33.1% YoY. Source: county tax records.
Cash-flow waterfall
monthlySold comps — $/sqft
last 12 mo · ≤1 miLoading sold comps…