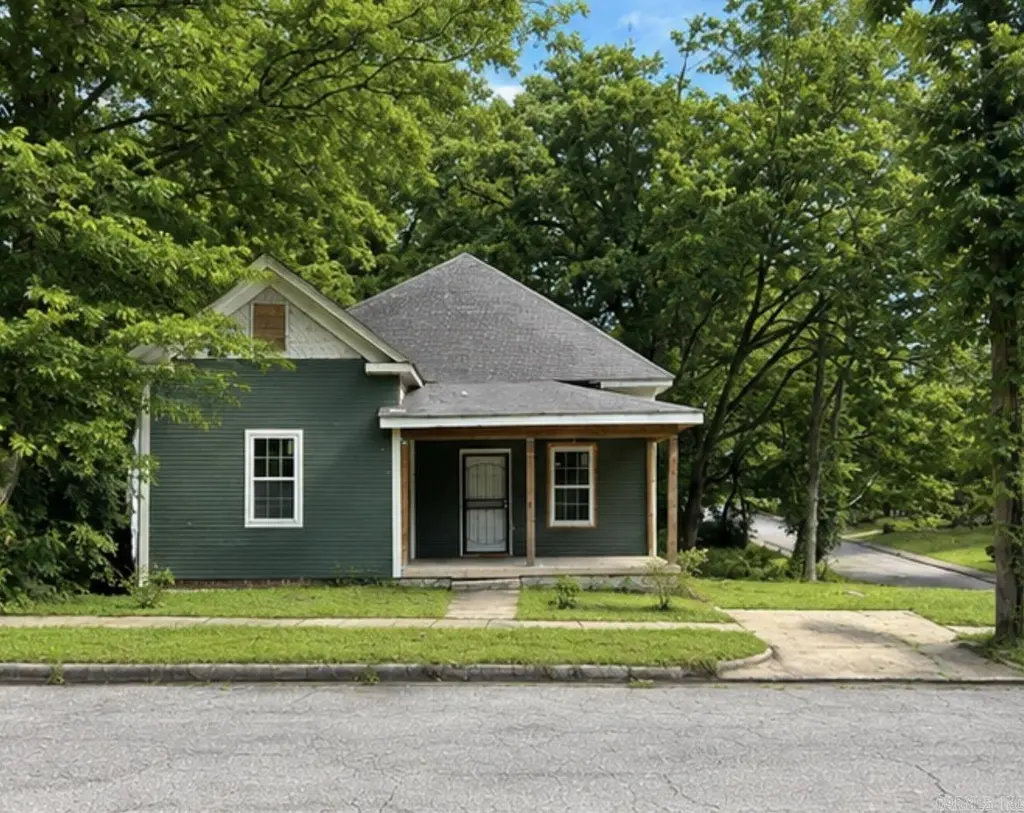
520 E Charles Bussey Ave · Little Rock, AR
Flood risk 7/10 · Major
- FEMA flood zone
- X (unshaded)
- Chance of flooding over 30 yrs
- 0.77%
- Est. flood insurance / yr
- $473 – $860
Fire risk 1/10 · Minimal
- Est. fire insurance / yr
- $1,499 – $2,785
Heat risk 7/10 · Major
- Hot days now (above 110°F)
- 7 days/yr
- Hot days in 30 yrs
- 19 days/yr
Wind risk 4/10 · Minor
- Chance of severe wind over 30 yrs
- 10.0%
Air-quality risk 2/10 · Minimal
- Unhealthy air days now
- 1 days/yr
- Unhealthy air days in 30 yrs
- 1 days/yr
Risk factors via First Street. Map © Google.
Why this score? — see what drove the C+ grade
The composite is a weighted blend of 9 inputs, each scored 0–100. Each bar is that input's sub-score; the figure is the points it added to the 100-point composite (weight × sub-score).
- Cash flow +25.9/30.0
- DSCR +8.7/10.0
- ARV discount +7.5/15.0
- 1% rule +6.5/10.0
- Livability +3.7/5.0
- Rent growth +3.3/5.0
- Condition / age +2.5/5.0
- Schools +2.1/10.0
- Appreciation +0.0/10.0
$129,000
🖨 Deal sheet 📄 Offer letter ✓ Due diligence
Listing remarks MLS
All offers must be presented with Buyer's acknowledgement that Seller has members who are AR Real Estate Brokers. No mineral, gas, or oil rights are to be conveyed. Conveyance shall be made to buyer by Special Warranty Deed. No offers accepted without earnest money!! Title insurance & survey are at buyer's expense. Sold “As Is”, No disclosure available.
Key facts
- New framing
- New plumbing
- New hvac system
Tags
Property features AI
Exterior
- Parking: Parking pad for 1 car
- Utilities: Public sewer; Public water; Municipal electric service
- Home design: Frame construction; Architectural shingle roof
- Construction: Crawl space foundation
- Exterior features: Paved road access; Level lot; Inside city limits
Interior
- Kitchen: Kitchen equipment: see remarks
- Flooring: Custom flooring (see remarks)
- Bathrooms: 2 full bathrooms
- Heating & cooling: Other heating and cooling features (see remarks)
- Interior features: Office/Study; Custom interior details (see remarks)
Neighborhood map
What this means for you Summary
Snapshot
- This is a 3-bed/1.0-bath single-family listed at $129k.
Deal economics
- At list price, monthly cash flow is $261 ($3k/yr) — positive.
- The deal already cash-flows at list — no discount required.
- Meets the 1% rule at list price ($1k rent vs $129k).
- Recommended offer: $127k (1.5% below list) — sets the bar for market timing.
- Cap rate 9.2% vs local median 4.1% in Little Rock — top-decile yield for the area; either an underpriced asset or a hidden risk that comps aren't pricing in. Stress-test before assuming the spread holds.
Location & tenants
- Location reads 73/100 on livability (#22 in AR) — a middle-class / working-renter tenant base. Strengths: commute A+, cost of living A+, housing A+; Watch: crime F.
- Little Rock School District (urban): math 23% / reading 26% proficiency, ranked #183 of 238 in AR (top 77%) — low school quality limits family demand, transient renter base, plan for 1-2y turnover; 69% free/reduced lunch — lower-income household profile, screen leases tightly.
- Market conditions: Rents rising (+3.4%/yr); 125 active listings in the ZIP; 28 comparable units currently listed for rent nearby; rentals at typical pace (median 23d on market — plan ~3-4 weeks tenant-placement turnaround); 43% of comp listings sitting > 30 days — soft ceiling on asking rent; 1,006 units permitted in Pulaski County in 2024 (0 in 5+ unit buildings).
- This rent runs 34% of the median local income ($52k/yr) — at the standard rent-burdened threshold; future hikes will face affordability resistance.
Forward outlook
- Local home prices are declining (-3.0%/yr); year-one equity from $892 of loan paydown is wiped out by about $4k of value loss. Plan a longer hold.
- Pulaski County population projected at +6% by 2050 — modest demand growth; plan on rents tracking national, not racing it.
Negotiation context
- It's been on market 27 days — a 2% lower offer ($127k) is reasonable based on typical stale-listing flexibility.
- 3 sale attempts since 19y ago with the ask held roughly flat each time — persistent listings suggest the price (not the market) is what's stuck; bring a comps-based counter.
- Current owner paid $43k; list at $129k implies a 200% gain — meaningful room to come down on a strong offer.
Risks & watch-outs
- Watch-outs: flood insurance adds $56/mo; built in 1928 — expect roof / HVAC / electrical / plumbing capex.
- Climate carrying-cost: major flood risk; extreme-heat days projected 7→19/yr by 2055 (HVAC capex compounding) — expect insurance premiums to compound above CPI over the hold.
Questions for the listing agent
- Built in 1928 — when were the roof, HVAC, electrical panel, plumbing, and water heater last replaced?
- What's the actual annual flood-insurance premium (NFIP or private), and is the property in a SFHA with mandatory coverage?
- Is there a deadline driving the sale (1031 exchange, divorce, estate, relocation)? That informs how much negotiation room exists.
- Crime grade is F in this area — have there been break-ins, vandalism, or insurance claims at this property in the last 3 years? What carrier currently insures it and at what premium?
- What's the average days-on-market for RENTAL listings here right now (not sales)? A rising rental-DOM trend means longer vacancies and softer asking-rent achievability than the comps imply.
- What's the recent tenant-quality profile in this submarket — average credit score on applications, eviction rate, late-payment / NSF rate, and stable-employment percentage? A property-management company in the area should have these aggregated.
- How much new for-sale + rental construction is in the pipeline within 1–3 miles? Heavy new supply typically softens prices + rents 12–24 months out; constrained supply supports both.
Investment metrics
- 1% rule
- 1.15% ✓
- Cap rate
- 9.24%
- Cash-on-cash
- 10.52%
- DSCR
- 1.47
- GRM
- 7.3
CMA / ARV
- ARV (on-the-fly)
- $269,204
- Comps found
- 12
Show comp detail 12 sales within ~0.75 mi
| Address | Dist | Beds/Ba | Sqft | Sold | Price | $/sf | Match |
|---|---|---|---|---|---|---|---|
| 1904 Vance St | 0.14mi | 3/2.5 | 1,600 (-1%) | 3mo | $349,000 | $218 | 84 |
| 2111 Bragg St | 0.15mi | 4/2.0 (+1) | 1,620 (+0%) | 9mo | $45,000 | $28 | 76 |
| 1314 Cumberland St | 0.43mi | 3/1.0 | 1,581 (-2%) | 5mo | $210,000 | $133 | 72 |
| 2405 Vance St | 0.34mi | 3/1.5 | 1,528 (-5%) | 11mo | $39,000 | $26 | 64 |
| 315 W 22nd St | 0.55mi | 3/2.0 | 1,717 (+6%) | 1mo | $231,925 | $135 | 58 |
| 1623 Commerce | 0.16mi | 3/2.0 | 1,400 (-13%) | 10mo | $255,000 | $182 | 58 |
| 2207 Cumberland St | 0.26mi | 3/2.0 | 1,403 (-13%) | 8mo | $365,000 | $260 | 56 |
| 1407 Hanger St | 0.66mi | 3/2.0 | 1,494 (-7%) | 2mo | $177,500 | $119 | 52 |
| 2216 Scott St | 0.35mi | 2/2.0 (-1) | 1,411 (-12%) | 8mo | $235,100 | $167 | 48 |
| 1507 Welch | 0.51mi | 3/2.0 | 1,400 (-13%) | 4mo | $255,000 | $182 | 47 |
| 2004 S Spring St | 0.57mi | 3/2.0 | 1,740 (+8%) | 11mo | $309,000 | $178 | 47 |
| 2018 Center St | 0.51mi | 2/1.0 (-1) | 1,422 (-12%) | 9mo | $170,000 | $120 | 44 |
Match score weights: distance 35% · size 25% · config 20% · recency 20%. Top-matched comps best support the ARV.
Projected returns pro-forma
-3.0% appreciation · 3.36% rent growth · sell at horizon
- IRR
- -2.7%
- Equity multiple
- 0.90×
- Total profit
- $-3,699
- Equity at exit
- $19,234
- IRR
- 7.4%
- Equity multiple
- 1.57×
- Total profit
- $20,559
- Equity at exit
- $11,154
Cash invested: $36,120 (down + closing). Projections, not guarantees.
Landlord ↔ Tenant lean methodology
- Overall (STATE)
- 92 Strongly Landlord-Friendly
- State Arkansas
- 92 Strongly Landlord-Friendly · R+14
- County
- — inherits STATE
- City
- — inherits STATE
ZIP-level market 72206
- Rents YoY
- 3.4%
- Active inventory
- 125
- Price-to-rent
- 7.3×
Monthly cashflow live
- Estimated rent
- $1,482 high interval (Pro) →
- Mortgage (P&I)
- −$676
- Tax from tax record
- −$124 /mo · $1,486/yr
- Insurance
- −$54
- Flood insurance flood zone
- −$56 /mo · $666/yr
- HOA
- −$0
- Vacancy / Maint / Mgmt
- −$311
- Net cashflow
- $261
Break-even live
UW: 25.0% down · 7.5% · 30yr · 1.5% tax · 5.0% vac · 8.0% maint · 8.0% mgmt
Financing live
Cash to close
- Down payment
- $32,250
- Closing costs
- $3,870
- Reserves months
- —
- Total cash needed
- —
Loan-product check · same deal, 3 products live
Conventional
25% down · 7.5% · 30yr
- Down + closing
- —
- Monthly P&I
- —
- Monthly cashflow
- —
- DSCR
- —
- Eligible?
- —
Personal DTI + credit; lowest rate.
DSCR
20% down · 8.5% · 30yr
- Down + closing
- —
- Monthly P&I
- —
- Monthly cashflow
- —
- DSCR
- —
- Eligible?
- —
No personal income docs; deal must DSCR.
Hard money
10% down · 12.0% · 12mo
- Down + closing
- —
- Monthly P&I
- —
- Monthly cashflow
- —
- DSCR
- —
- Eligible?
- —
Short-term bridge; refi at stabilization.
Rent comps 28 comps
| Address | Beds | Baths | Sqft | Rent | $/sqft | DOM | Units | Dist |
|---|---|---|---|---|---|---|---|---|
| 606 E 21st St Little Rock, AR | 3.0 | 2.0 | 1652 | $1,600 | $0.97 | 19d | 1 | 0.11mi |
| 201 E 17th St Little Rock, AR | 2.0 | 1.5 | 1124 | $1,550 | $1.38 | 14d | 1 | 0.28mi |
| 2318 Rock St Little Rock, AR | 2.0 | 2.0 | 1358 | $2,300 | $1.69 | 43d | 1 | 0.31mi |
| 1401 Cumberland St Little Rock, AR | 3.0 | 1.0 | 1566 | $1,295 | $0.83 | 14d | 1 | 0.36mi |
| 1401 Cumberland St Little Rock, AR | 3.0 | 1.0 | 1566 | $1,250 | $0.80 | 43d | 1 | 0.36mi |
| 1500 Center St Unit 5 Little Rock, AR | 2.0 | 1.5 | 1100 | $1,295 | $1.18 | 43d | 1 | 0.55mi |
| 2708 Rock St Little Rock, AR | 3.0 | 1.0 | 1114 | $875 | $0.79 | 21d | 1 | 0.55mi |
| 313 W 23rd St Little Rock, AR | 3.0 | 2.0 | 1134 | $925 | $0.82 | 23d | 1 | 0.56mi |
| 2323 S Spring St Little Rock, AR | 3.0 | 2.0 | 1070 | $1,100 | $1.03 | 43d | 1 | 0.59mi |
| 1004 Scott St Unit 1 Little Rock, AR | 2.0 | 1.0 | 1398 | $1,395 | $1.00 | 23d | 1 | 0.63mi |
| 1212 Center St Little Rock, AR | 2.0 | 2.0 | 1200 | $1,750 | $1.46 | 23d | 1 | 0.64mi |
| 1322 Hanger St Little Rock, AR | 4.0 | 1.0 | 1566 | $1,100 | $0.70 | 23d | 1 | 0.67mi |
| 2604 Broadway St Little Rock, AR | 4.0 | 2.0 | 1223 | $1,595 | $1.30 | 23d | 1 | 0.79mi |
| 3015 Main St Little Rock, AR | 4.0 | 2.0 | 1658 | $2,350 | $1.42 | 43d | 1 | 0.81mi |
| 2900 Center St Little Rock, AR | 3.0 | 1.0 | 1456 | $1,050 | $0.72 | 43d | 1 | 0.82mi |
| 1906 S State St Little Rock, AR | 2.0 | 2.0 | 1160 | $1,895 | $1.63 | 43d | 1 | 0.83mi |
| 1908 S State St Little Rock, AR | 2.0 | 2.0 | 1160 | $1,650 | $1.42 | 43d | 1 | 0.83mi |
| 2712 Broadway St Little Rock, AR | 3.0 | 3.0 | 2021 | $1,695 | $0.84 | 43d | 1 | 0.85mi |
| 2610 S Izard St Little Rock, AR | 3.0 | 2.0 | 1136 | $1,150 | $1.01 | 43d | 1 | 1.02mi |
| 2616 S Izard St Little Rock, AR | 4.0 | 2.0 | 1223 | $1,595 | $1.30 | 43d | 1 | 1.03mi |
| 315 Rock St Unit 1 Little Rock, AR | 2.0 | 2.0 | 1358 | $2,900 | $2.14 | 23d | 1 | 1.05mi |
| 421 W 32nd St Little Rock, AR | 4.0 | 2.0 | 1223 | $1,550 | $1.27 | 19d | 1 | 1.06mi |
| 1209 W 22nd St Little Rock, AR | 4.0 | 2.0 | 1104 | $1,850 | $1.68 | 43d | 1 | 1.13mi |
| 926 W 29th St Little Rock, AR | 3.0 | 1.0 | 1229 | $1,050 | $0.85 | 23d | 1 | 1.19mi |
| 717 W 32nd St Unit A and B Little Rock, AR | 3.0 | 2.5 | 1300 | $1,550 | $1.19 | 14d | 1 | 1.20mi |
| 115 E Markham St Little Rock, AR | 1.0–2.0 | 1.0 | 863 | $1,480 | $1.71 | 14d | 11 | 1.22mi |
| 1903 Marshall St Little Rock, AR | 3.0 | 2.0 | 1152 | $1,200 | $1.04 | 23d | 1 | 1.34mi |
| 1515 Wolfe St Little Rock, AR | 3.0 | 2.0 | 1386 | $1,100 | $0.79 | 23d | 1 | 1.47mi |
Listing history 23 events
-
2026-06-18days on market $129,000 Active 27 DOM
-
2026-06-17days on market $129,000 Active 26 DOM
-
2026-06-16days on market $129,000 Active 25 DOM
-
2026-06-15days on market $129,000 Active 24 DOM
-
2026-06-14days on market $129,000 Active 22 DOM
-
2026-06-13days on market $129,000 Active 21 DOM
-
2026-06-10days on market $129,000 Active 19 DOM
-
2026-06-09days on market $129,000 Active 18 DOM
-
2026-06-08days on market $129,000 Active 17 DOM
-
2026-06-07days on market $129,000 Active 16 DOM
-
2026-06-05days on market $129,000 Active 13 DOM
-
2026-06-03days on market $129,000 Active 12 DOM
-
2026-06-02days on market $129,000 Active 11 DOM
-
2026-06-01days on market $129,000 Active 10 DOM
-
2026-05-31days on market $129,000 Active 9 DOM
-
2026-05-31days on market $129,000 Active 8 DOM
-
2026-05-22$129,000 New Listing
-
2016-03-14soldstatus $43,000 Sold 373-char remark
Show marketing remark (373 chars)
All offers must be presented with Buyer's acknowledgement that Seller has members who are AR Real Estate Brokers. No mineral, gas, or oil rights are to be conveyed. Conveyance shall be made to buyer by Special Warranty Deed. No offers accepted without earnest money!! Title insurance & survey are at buyer's expense. Sold “As Is”, No disclosure available.
-
2016-03-10status Under Contract 373-char remark
Show marketing remark (373 chars)
All offers must be presented with Buyer's acknowledgement that Seller has members who are AR Real Estate Brokers. No mineral, gas, or oil rights are to be conveyed. Conveyance shall be made to buyer by Special Warranty Deed. No offers accepted without earnest money!! Title insurance & survey are at buyer's expense. Sold “As Is”, No disclosure available.
-
2016-03-09$43,000 New Listing 373-char remark
Show marketing remark (373 chars)
All offers must be presented with Buyer's acknowledgement that Seller has members who are AR Real Estate Brokers. No mineral, gas, or oil rights are to be conveyed. Conveyance shall be made to buyer by Special Warranty Deed. No offers accepted without earnest money!! Title insurance & survey are at buyer's expense. Sold “As Is”, No disclosure available.
-
2007-06-29soldstatus $15,000 273-char remark
Show marketing remark (273 chars)
Bank owned property. There will be no utilities turned on, no termite, no survey. Buyer accepts property in its current condition with no repairs. Cash only and proof of funds must accompany all offers no exceptions, earnest money to be a min of $ 1,000 also no exceptions.
-
2007-06-19historical 273-char remark
Show marketing remark (273 chars)
Bank owned property. There will be no utilities turned on, no termite, no survey. Buyer accepts property in its current condition with no repairs. Cash only and proof of funds must accompany all offers no exceptions, earnest money to be a min of $ 1,000 also no exceptions.
-
2007-04-20$15,000 273-char remark
Show marketing remark (273 chars)
Bank owned property. There will be no utilities turned on, no termite, no survey. Buyer accepts property in its current condition with no repairs. Cash only and proof of funds must accompany all offers no exceptions, earnest money to be a min of $ 1,000 also no exceptions.
ⓘ Source: listings_history table (triggers on properties + properties_extension) + one-shot
backfill from property_details.listing_events for pre-trigger history.
Tax reassessment forecast AR · Resets to sale price
- Current annual tax
- $1,486 · $124/mo
- Projected year-2 tax
- $1,486 · $124/mo
- Expected delta
- $0/yr ($0/mo · 0.0%)
ⓘ Screening estimate from a state-policy table — verify with the county assessor before closing.
Climate risk First Street
- Flood 7/10 Severe FEMA zone X (unshaded) · 77% chance over 30 yrs
- Wildfire 1/10 Low
- Heat 7/10 Severe 7 d/yr ≥110°F today · 19 d/yr by 30 yrs out
- Wind 4/10 Moderate 10% chance of damaging wind over 30 yrs
- Air quality 2/10 Low 1 unhealthy d/yr today · 1 by 30 yrs out
Nearby sold comps map
Loading sold comps map…
Walkable amenities ~0.75 mi
Loading nearby amenities…
Taxation est. · year 1
- Rental income
- $17,784
- − Mortgage interest
- −$7,226
- − Property taxes
- −$1,486
- − Insurance
- −$1,312
- − Repairs & maintenance
- −$1,423
- − Management
- −$1,423
- − Depreciation
- −$3,753
- Taxable income
- $1,162
- Est. tax owed @ 24.0%
- −$279
- After-tax cash flow
- $2,855/yr
For passive investors: Depreciation is non-cash, so a rental often shows a tax loss while cash-flowing — sheltering income. Rental losses are passive: they offset passive income freely, and up to $25,000/yr can offset ordinary (W-2) income if you actively participate and your MAGI is under $100k (phasing out to $0 by $150k); unused losses carry forward. On sale, claimed depreciation is recaptured at up to 25%, and gains may owe capital-gains tax (a 1031 exchange can defer both). Figures are a year-1 estimate at your 24.0% rate — not tax advice; consult a CPA.
Schools (NCES district)
- District
- Little Rock School District
- NCES district ID
- 0509000
- Math proficiency
- 23% ▼ -12.00%
- Reading proficiency
- 26% ▼ -8.00%
- Median HH income
- $43,346
- Composite
- 21.0/100
- National rank
- #8457
- State rank
- #183 of 238 in AR
Livability — Little Rock
- Score
- 73/100
- State rank
- #22
- US rank
- #5295
Category grades
Schools grade is shown separately in the Schools card above.
Census & demographics
- Census place
- Little Rock, AR
- County
- Pulaski County · 372,764 people
- City population
- 218,896
- Metro
- Little Rock-North Little Rock-Conway, AR
- Population (ZIP)
- 22,667
- Household income
- $52,132
- Rent vs Own
- Severe rent burden
- 623.0
Population outlook (Pulaski County) Hauer SSP2
- Today (2025)
- 415,378 people
- By 2030
- 423,720 · +2.0%
- By 2040
- 435,182 · +4.8%
- By 2050
- 440,904 · +6.1%
- By 2075
- 445,521 · +7.3%
- By 2100
- 419,173 · +0.9%
Race, ethnicity, and origin ACS 2023
- Neighborhood character
- Diverse neighborhood (Simpson 0.59)
- Race & ethnicity
- Black 48% White 43% Two or more races 6% Hispanic / Latino 5%
- Hispanic origin (detail)
- Mexican 4%
- Common ancestry
- Iranian 1% Italian 1% Lithuanian 1%
- Foreign-born
- 1% · Canada
- Languages at home
- 94% English-only · Spanish 5%
Political lean MEDSL · Pulaski
- 2024 margin
- Strong D (+22.1) · D 59.8% · R 37.7% · Other 2.5%
- 2008→2024 swing
- +10.6pp toward D · 2008: 11.6pp · 2024: 22.1pp
- All cycles
- 2024: D+22.1 2020: D+22.5 2016: D+17.9 2012: D+11.4 2008: D+11.6
Not yet ingested
- Civics
- —
Market trends
- HPI YoY
- ▼ -88.64%
- Current HPI
- 158.3601
- Rent YoY
- ▲ 3.36%
- Metro
- Little Rock-North Little Rock-Conway, AR
- State GDP YoY
- ▲ 3.80%
- F500 in state
- 10
Industry mix (Fortune 500 HQ in AR)
| Industry | F500 HQs | Revenue |
|---|---|---|
| Retail | 1 | $681B |
|
||
| Food / Agriculture | 1 | $53B |
|
||
| Retail / Energy | 1 | $22B |
|
||
| Transportation / Logistics | 1 | $12B |
|
||
| Energy | 1 | $4B |
|
||
Price history
+760.0% since first listed7 events — show timeline
- 2026-05-22 Listed $129,000 CARMLS
- 2016-03-14 Sold (MLS) $43,000 CARMLS
- 2016-03-10 Pending — CARMLS
- 2016-03-09 Listed $43,000 CARMLS
- 2007-06-29 Sold (MLS) $15,000 CARMLS
- 2007-06-19 Listing Removed — CARMLS
- 2007-04-20 Listed $15,000 CARMLS
Property tax history
+3.2%/yrLatest (2025): $1,486 · +0.0% YoY. Source: county tax records.
Cash-flow waterfall
monthlySold comps — $/sqft
last 12 mo · ≤1 miLoading sold comps…