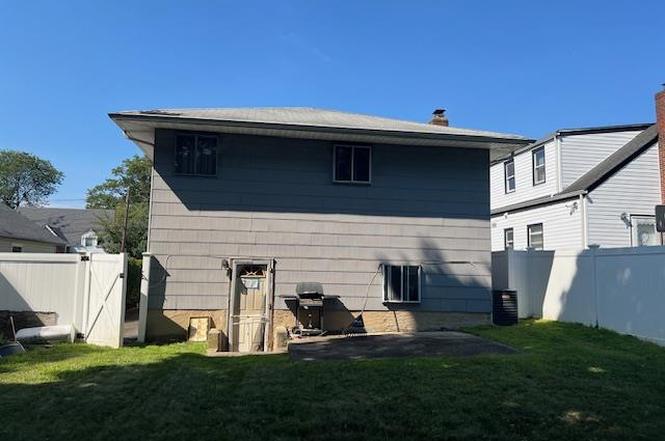
87 W Clinton Ave · Roosevelt, NY
Flood risk 1/10 · Minimal
- FEMA flood zone
- X (unshaded)
- Chance of flooding over 30 yrs
- 0.0%
- Est. flood insurance / yr
- $473 – $860
Fire risk 1/10 · Minimal
- Est. fire insurance / yr
- $691 – $1,283
Heat risk 6/10 · Moderate
- Hot days now (above 95°F)
- 7 days/yr
- Hot days in 30 yrs
- 16 days/yr
Wind risk 6/10 · Moderate
- Chance of severe wind over 30 yrs
- 58.0%
Air-quality risk 4/10 · Minor
- Unhealthy air days now
- 5 days/yr
- Unhealthy air days in 30 yrs
- 8 days/yr
Risk factors via First Street. Map © Google.
Why this score? — see what drove the D+ grade
The composite is a weighted blend of 9 inputs, each scored 0–100. Each bar is that input's sub-score; the figure is the points it added to the 100-point composite (weight × sub-score).
- ARV discount +15.0/15.0
- Cash flow +13.0/30.0
- 1% rule +4.4/10.0
- DSCR +3.9/10.0
- Livability +3.7/5.0
- Schools +3.3/10.0
- Rent growth +2.5/5.0
- Condition / age +2.5/5.0
- Appreciation +0.0/10.0
$410,000
🖨 Deal sheet 📄 Offer letter ✓ Due diligence
Listing remarks
This charming 3-bedroom, 2-bath home with a spacious fenced yard, nestled on a quiet, tree-lined street in Roosevelt. Features a private driveway and large backyard, ideal for entertaining or gardening. This well-located home offers a perfect blend of comfort and convenience—just 5 minutes from the LIRR, and close to schools, parks, shops, and major highways. Great opportunity for buyers or investors seeking value in a desirable Long Island location. Hurry this won't last!!!
Key facts
- Close to parks
- Close to schools
- Fenced yard
Tags
Neighborhood map
What this means for you Summary
Snapshot
- This is a 3-bed/1.0-bath single-family listed at $410k.
Deal economics
- At list price, monthly cash flow is $-20 ($-236/yr) — negative.
- To cash-flow at today's rent, offer at most $407k (0.8% below list).
- To meet the 1% rule (rent ≥ 1% of price), the offer needs to be $386k (5.9% below list).
- Recommended offer: $386k (5.9% below list) — sets the bar for 1% rule.
- Cap rate 6.2% vs local median 4.0% in Roosevelt — top-decile yield for the area; either an underpriced asset or a hidden risk that comps aren't pricing in. Stress-test before assuming the spread holds.
Location & tenants
- Location reads 73/100 on livability (#307 in NY) — a middle-class / working-renter tenant base. Strengths: commute A+, employment A+, housing A+; Watch: crime D+, amenities F, cost of living F.
- Roosevelt Union Free School District (suburban): math 28% / reading 45% proficiency, ranked #529 of 590 in NY (top 90%) — families likely to look elsewhere, expect single-tenant / working-renter base with shorter leases.
- Zoned schools: Centennial Avenue Elementary School (math 17% / reading 32%, grade F, #1,846 of 2,108 statewide, top 91%, 499 students, 50% FRL); Roosevelt Middle School (math 12% / reading 27%, grade F, #685 of 729 statewide, top 94%, 455 students, 0% FRL); Roosevelt High School (math 65% / reading 78%, grade B+, #698 of 1,100 statewide, top 63%, 1,075 students, 59% FRL) — zoned schools average 36% FRL vs 58% district-wide (22 pts lower); this property's tenant base skews higher-income than the district average.
- Market conditions: 52 active listings in the ZIP; 7 comparable units currently listed for rent nearby; rentals at typical pace (median 25d on market — plan ~3-4 weeks tenant-placement turnaround); 824 units permitted in Nassau County in 2024 (153 in 5+ unit buildings).
Forward outlook
- Local home prices are declining (-3.0%/yr); year-one equity from $3k of loan paydown is wiped out by about $12k of value loss. Plan a longer hold.
- Nassau County population projected at +7% by 2050 — modest demand growth; plan on rents tracking national, not racing it.
Negotiation context
- It's been on market 21 days — a 2% lower offer ($404k) is reasonable based on typical stale-listing flexibility.
Risks & watch-outs
- Climate carrying-cost: major wind risk, 58% chance of damaging wind over 30y; extreme-heat days projected 7→16/yr by 2055 (HVAC capex compounding) — expect insurance premiums to compound above CPI over the hold.
Questions for the listing agent
- What do current leases actually rent for vs. the listed asking? Can we see a recent rent roll and the last 12 months of T-12 income?
- Built in 1972 — when were the roof, HVAC, electrical panel, plumbing, and water heater last replaced?
- Is there a deadline driving the sale (1031 exchange, divorce, estate, relocation)? That informs how much negotiation room exists.
- Crime grade is D in this area — have there been break-ins, vandalism, or insurance claims at this property in the last 3 years? What carrier currently insures it and at what premium?
- The area grade is low — what's the realistic commute time and amenity access for the typical tenant pool here? Any planned neighborhood developments (good or bad) we should know about?
- What's the average days-on-market for RENTAL listings here right now (not sales)? A rising rental-DOM trend means longer vacancies and softer asking-rent achievability than the comps imply.
- What's the recent tenant-quality profile in this submarket — average credit score on applications, eviction rate, late-payment / NSF rate, and stable-employment percentage? A property-management company in the area should have these aggregated.
- How much new for-sale + rental construction is in the pipeline within 1–3 miles? Heavy new supply typically softens prices + rents 12–24 months out; constrained supply supports both.
Investment metrics
- 1% rule
- 0.94% ✗
- Cap rate
- 6.24%
- Cash-on-cash
- -0.21%
- DSCR
- 0.99
- GRM
- 8.9
CMA / ARV
- ARV (on-the-fly)
- $697,144
- Comps found
- 12
Show comp detail 12 sales within ~0.75 mi
| Address | Dist | Beds/Ba | Sqft | Sold | Price | $/sf | Match |
|---|---|---|---|---|---|---|---|
| 31 Cedar St | 0.30mi | 4/2.0 (+1) | 1,645 (-2%) | 1mo | $680,000 | $413 | 72 |
| 76 Henry St | 0.14mi | 4/2.5 (+1) | 1,565 (-7%) | 1mo | $615,000 | $393 | 69 |
| 1109 Cramer Ct | 0.21mi | 3/1.5 | 1,828 (+8%) | 8mo | $624,432 | $342 | 68 |
| 62 Alhambra Rd | 0.32mi | 3/2.0 | 1,900 (+13%) | 2mo | $384,750 | $203 | 59 |
| 3 Maple Dr | 0.63mi | 3/2.5 | 1,732 (+3%) | 7mo | $650,000 | $375 | 54 |
| 959 Cramer Ct | 0.48mi | 3/3.5 | 1,780 (+6%) | 7mo | $745,000 | $419 | 53 |
| 1515 Paul St | 0.71mi | 3/2.0 | 1,769 (+5%) | 5mo | $400,000 | $226 | 51 |
| 319 Maryland Ave | 0.75mi | 3/1.5 | 1,572 (-7%) | 5mo | $605,000 | $385 | 48 |
| 831 N William St | 0.74mi | 4/2.5 (+1) | 1,650 (-2%) | 5mo | $725,000 | $439 | 46 |
| 121 E Pennywood Ave | 0.58mi | 4/2.0 (+1) | 1,500 (-11%) | 3mo | $677,340 | $452 | 43 |
| 891 School Dr | 0.55mi | 3/2.5 | 1,451 (-14%) | 3mo | $677,000 | $467 | 42 |
| 779 Summer Ave | 0.64mi | 4/2.0 (+1) | 1,502 (-11%) | 6mo | $715,000 | $476 | 38 |
Match score weights: distance 35% · size 25% · config 20% · recency 20%. Top-matched comps best support the ARV.
Projected returns pro-forma
-3.0% appreciation · 3.0% rent growth · sell at horizon
- IRR
- -16.6%
- Equity multiple
- 0.41×
- Total profit
- $-67,488
- Equity at exit
- $61,132
- IRR
- -8.3%
- Equity multiple
- 0.48×
- Total profit
- $-59,557
- Equity at exit
- $35,449
Cash invested: $114,800 (down + closing). Projections, not guarantees.
Landlord ↔ Tenant lean methodology
- Overall (STATE)
- 15 Strongly Tenant-Friendly
- State New York
- 15 Strongly Tenant-Friendly · D+10
- County
- — inherits STATE
- City
- — inherits STATE
ZIP-level market 11575
- Active inventory
- 52
- Price-to-rent
- 8.9×
Monthly cashflow live
- Estimated rent
- $3,859 high interval (Pro) →
- Mortgage (P&I)
- −$2,150
- Tax from tax record
- −$747 /mo · $8,967/yr
- Insurance
- −$171
- HOA
- −$0
- Vacancy / Maint / Mgmt
- −$810
- Net cashflow
- $-20
Break-even live
UW: 25.0% down · 7.5% · 30yr · 1.5% tax · 5.0% vac · 8.0% maint · 8.0% mgmt
Financing live
Cash to close
- Down payment
- $102,500
- Closing costs
- $12,300
- Reserves months
- —
- Total cash needed
- —
Loan-product check · same deal, 3 products live
Conventional
25% down · 7.5% · 30yr
- Down + closing
- —
- Monthly P&I
- —
- Monthly cashflow
- —
- DSCR
- —
- Eligible?
- —
Personal DTI + credit; lowest rate.
DSCR
20% down · 8.5% · 30yr
- Down + closing
- —
- Monthly P&I
- —
- Monthly cashflow
- —
- DSCR
- —
- Eligible?
- —
No personal income docs; deal must DSCR.
Hard money
10% down · 12.0% · 12mo
- Down + closing
- —
- Monthly P&I
- —
- Monthly cashflow
- —
- DSCR
- —
- Eligible?
- —
Short-term bridge; refi at stabilization.
Rent comps 7 comps
| Address | Beds | Baths | Sqft | Rent | $/sqft | DOM | Units | Dist |
|---|---|---|---|---|---|---|---|---|
| 21 W Centennial Ave Roosevelt, NY | 3.0 | 2.0 | 1176 | $3,600 | $3.06 | 18d | 1 | 0.60mi |
| 533 Greenwich St Unit 1D Hempstead, NY | 3.0 | 2.0 | 1103 | $4,000 | $3.63 | 43d | 1 | 1.04mi |
| 650 Winthrop Dr Uniondale, NY | 3.0 | 3.0 | 1300 | $4,900 | $3.77 | 1d | 1 | 1.27mi |
| 529 Maple Ave Unit Second Floor Uniondale, NY | 3.0 | 2.0 | 1240 | $3,750 | $3.02 | 24d | 1 | 1.33mi |
| 366 Greenwich St Hempstead, NY | 3.0 | 1.5 | 1504 | $4,000 | $2.66 | 1d | 1 | 1.35mi |
| 523 Hawthorne Ave Uniondale, NY | 3.0 | 1.0 | 1328 | $3,300 | $2.48 | 24d | 1 | 1.37mi |
| 66 E Seaman Ave Freeport, NY | 3.0 | 2.5 | 1200 | $3,600 | $3.00 | 43d | 1 | 1.40mi |
Listing history 2 events
-
2025-08-13status Pending
-
2025-07-22$410,000 Active
ⓘ Source: listings_history table (triggers on properties + properties_extension) + one-shot
backfill from property_details.listing_events for pre-trigger history.
Tax reassessment forecast NY · Partial reset (capped growth)
- Current annual tax
- $8,967 · $747/mo
- Projected year-2 tax
- $8,967 · $747/mo
- Expected delta
- $0/yr ($0/mo · 0.0%)
ⓘ Screening estimate from a state-policy table — verify with the county assessor before closing.
Climate risk First Street
- Flood 1/10 Low FEMA zone X (unshaded) · 0% chance over 30 yrs
- Wildfire 1/10 Low
- Heat 6/10 Major 7 d/yr ≥95°F today · 16 d/yr by 30 yrs out
- Wind 6/10 Major 58% chance of damaging wind over 30 yrs
- Air quality 4/10 Moderate 5 unhealthy d/yr today · 8 by 30 yrs out
Nearby sold comps map
Loading sold comps map…
Walkable amenities ~0.75 mi
Loading nearby amenities…
Taxation est. · year 1
- Rental income
- $46,307
- − Mortgage interest
- −$22,966
- − Property taxes
- −$8,967
- − Insurance
- −$2,050
- − Repairs & maintenance
- −$3,705
- − Management
- −$3,705
- − Depreciation
- −$11,927
- Taxable loss
- −$7,013
- Est. tax savings @ 24.0%
- +$1,683
- After-tax cash flow
- $1,447/yr
For passive investors: Depreciation is non-cash, so a rental often shows a tax loss while cash-flowing — sheltering income. Rental losses are passive: they offset passive income freely, and up to $25,000/yr can offset ordinary (W-2) income if you actively participate and your MAGI is under $100k (phasing out to $0 by $150k); unused losses carry forward. On sale, claimed depreciation is recaptured at up to 25%, and gains may owe capital-gains tax (a 1031 exchange can defer both). Figures are a year-1 estimate at your 24.0% rate — not tax advice; consult a CPA.
Schools (NCES district)
- District
- Roosevelt Union Free School District
- NCES district ID
- 3624990
- Math proficiency
- 28% ▼ -4.00%
- Reading proficiency
- 45% ▲ 6.00%
- Median HH income
- $69,717
- Composite
- 33.41/100
- National rank
- #5472
- State rank
- #529 of 590 in NY
Livability — Roosevelt
- Score
- 73/100
- State rank
- #307
- US rank
- #5074
Category grades
Schools grade is shown separately in the Schools card above.
Census & demographics
- Census place
- Roosevelt, NY
- City population
- 19,430
- Population (ZIP)
- 19,430
Population outlook (Nassau County) Hauer SSP2
- Today (2025)
- 1,409,302 people
- By 2030
- 1,431,482 · +1.6%
- By 2040
- 1,471,607 · +4.4%
- By 2050
- 1,502,845 · +6.6%
- By 2075
- 1,575,403 · +11.8%
- By 2100
- 1,554,356 · +10.3%
Race, ethnicity, and origin ACS 2023
- Neighborhood character
- Diverse neighborhood (Simpson 0.55)
- Race & ethnicity
- Black 53% Hispanic / Latino 41% Two or more races 7% Asian 2% White 1%
- Hispanic origin (detail)
- Puerto Rican 6% Dominican 4%
- Common ancestry
- Hispanic 4%
- Foreign-born
- 36% · Canada, Jamaica, South Korea
- Languages at home
- 60% English-only · Spanish 34% French/Haitian/Cajun 4% Other Indo-European 2%
Political lean MEDSL · Nassau
- 2024 margin
- Toss-up / Even · D 47.9% · R 52.1%
- 2008→2024 swing
- -12.6pp toward R · 2008: 8.4pp · 2024: -4.2pp
- All cycles
- 2024: R+4.2 2020: D+9.5 2016: D+5.3 2012: D+6.7 2008: D+8.4
Not yet ingested
- Civics
- —
Market trends
- HPI YoY
- ▼ -368.53%
- Current HPI
- 364.7467
- Rent YoY
- —
- Metro
- —
- State GDP YoY
- ▲ 2.60%
- F500 in state
- 92
Industry mix (Fortune 500 HQ in NY)
| Industry | F500 HQs | Revenue |
|---|---|---|
| Financial Services | 10 | $950B |
|
||
| Consumer Goods | 9 | $162B |
|
||
| Insurance | 4 | $225B |
|
||
| Telecommunications | 2 | $144B |
|
||
| Pharmaceuticals | 2 | $112B |
|
||
| Media / Entertainment | 2 | $69B |
|
||
Price history
2 events — show timeline
- 2025-08-13 Pending — OneKey® MLS as Distributed by MLS Grid
- 2025-07-22 Listed $410,000 OneKey® MLS as Distributed by MLS Grid
Property tax history
+2.2%/yrLatest (2024): $8,967 · +6.0% YoY. Source: county tax records.
Cash-flow waterfall
monthlySold comps — $/sqft
last 12 mo · ≤1 miLoading sold comps…