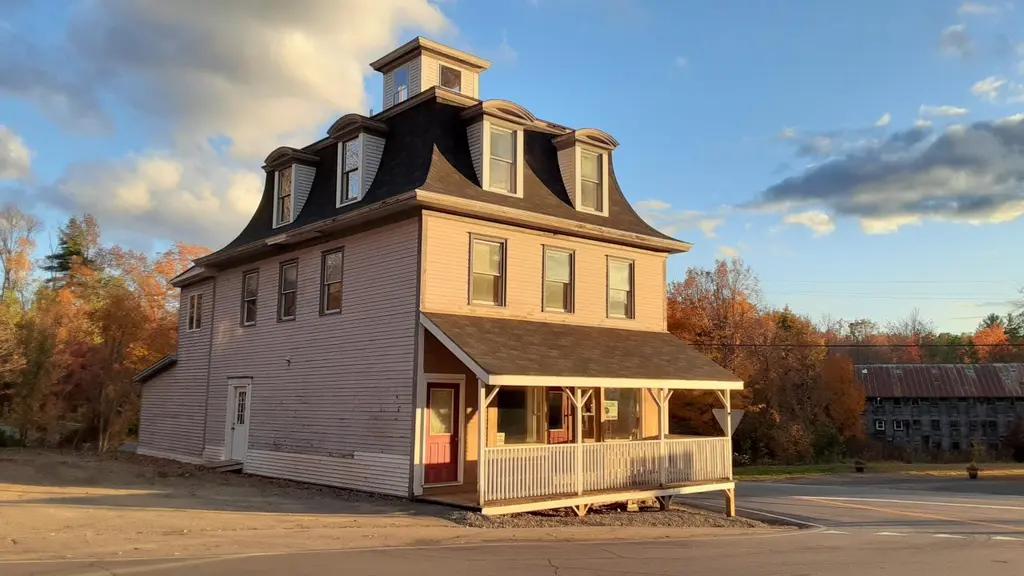
3 Center Hill Rd · Weld, ME
Flood risk 6/10 · Moderate
- FEMA flood zone
- X
- Chance of flooding over 30 yrs
- 0.7%
- Est. flood insurance / yr
- $507 – $1,088
Fire risk 1/10 · Minimal
- Est. fire insurance / yr
- $669 – $1,243
Heat risk 2/10 · Minimal
- Hot days now (above 88°F)
- 7 days/yr
- Hot days in 30 yrs
- 17 days/yr
Wind risk 3/10 · Minor
- Chance of severe wind over 30 yrs
- 6.0%
Air-quality risk 2/10 · Minimal
- Unhealthy air days now
- 1 days/yr
- Unhealthy air days in 30 yrs
- 1 days/yr
Risk factors via First Street. Map © Google.
Why this score? — see what drove the B grade
The composite is a weighted blend of 9 inputs, each scored 0–100. Each bar is that input's sub-score; the figure is the points it added to the 100-point composite (weight × sub-score).
- Cash flow +27.0/30.0
- DSCR +9.3/10.0
- ARV discount +7.5/15.0
- 1% rule +7.2/10.0
- Schools +6.7/10.0
- Appreciation +5.0/10.0
- Rent growth +2.5/5.0
- Livability +2.5/5.0
- Condition / age +2.5/5.0
$79,900
🖨 Deal sheet 📄 Offer letter ✓ Due diligence
Listing remarks MLS
Take a look at this incredible opportunity! This historic property in Weld is on the market for only 79,900. This antique Mansard building is rich in history and has tremendous potential waiting to be restored to its former glory. The first floor was originally a general store since the property was built and also served as the office for Mt. Blue State Park when it opened in 1935. The second floor features living quarters with two bedrooms, but please note that the kitchen and bathroom have been removed due to their condition and will need to be replaced. The third floor offers two additional bedrooms and a bathroom. This building has undergone numerous recent updates, including a rebuilt foundation, new sills, a new roof, updated electrical systems, and new windows. However, the property requires interior renovations and updates before it can be occupied, as there is currently no working heat on the premises. Bring your creative vision and see if this historic building inspires you to become its next steward. The possibilities here are endless! Located within a short drive to Mt Blue State Park, Webb Lake, and Tumbledown Mountain. Don't miss out on this amazing opportunity--act today!
Key facts
- Mansard building
- Rebuilt foundation
- Historic property
Tags
Property features AI
Exterior
- Parking: Paved on-site parking with 1–4 spaces
- Utilities: Private well water; Private septic (septic tank, shared septic; septic design available); Electric service with circuit breakers
- Home design: Single family residence; Multi-level; Built in 1874; Faces multiple directions (corner location)
- Construction: Wood frame with wood siding; Stone foundation; Shingle roof
- Exterior features: Porch; Corner lot; Level lot; Located in a historic district; Near shopping; Paved road access
Interior
- Flooring: Carpet; Vinyl; Wood
- Bathrooms: One half-bath
- Heating & cooling: Heating present; Electric with circuit breakers
- Interior features: Storage; 8 total rooms
Neighborhood map
What this means for you Summary
Snapshot
- This is a 2-bed/0.5-bath single-family listed at $80k.
Deal economics
- At list price, monthly cash flow is $224 ($3k/yr) — positive.
- The deal already cash-flows at list — no discount required.
- Meets the 1% rule at list price ($978 rent vs $80k).
- Recommended offer: $79k (1.5% below list) — sets the bar for market timing.
Location & tenants
- Location reads: area grade B — affects rentability + tenant quality, not the cash-flow math above.
- RSU 09 (rural): math 78% / reading 82% proficiency, ranked #88 of 112 in ME (top 79%) — strong family-tenant draw, lease renewals of 3-5y typical.
- Market conditions: 16 active listings in the ZIP; 164 units permitted in Franklin County in 2024 (0 in 5+ unit buildings).
Forward outlook
- In year one you build about $3k of equity ($552 loan paydown + $2k appreciation (3.0% local appreciation)).
- Franklin County population projected at -21% by 2050 — secular population decline; favor cash flow + early exit over multi-decade hold.
- At projected returns (3.0% appreciation + 3.0% rent growth), your $22k cash investment doubles in ~4 years — after that, you're playing with house money.
Negotiation context
- It's been on market 16 days — a 2% lower offer ($79k) is reasonable based on typical stale-listing flexibility.
- 12 sale attempts since 23y ago with the ask held roughly flat each time — persistent listings suggest the price (not the market) is what's stuck; bring a comps-based counter.
Risks & watch-outs
- Watch-outs: built in 1874 — expect roof / HVAC / electrical / plumbing capex.
- Climate carrying-cost: major flood risk — expect insurance premiums to compound above CPI over the hold.
Questions for the listing agent
- Built in 1874 — when were the roof, HVAC, electrical panel, plumbing, and water heater last replaced?
- Is there a deadline driving the sale (1031 exchange, divorce, estate, relocation)? That informs how much negotiation room exists.
- What's the average days-on-market for RENTAL listings here right now (not sales)? A rising rental-DOM trend means longer vacancies and softer asking-rent achievability than the comps imply.
- What's the recent tenant-quality profile in this submarket — average credit score on applications, eviction rate, late-payment / NSF rate, and stable-employment percentage? A property-management company in the area should have these aggregated.
- How much new for-sale + rental construction is in the pipeline within 1–3 miles? Heavy new supply typically softens prices + rents 12–24 months out; constrained supply supports both.
Investment metrics
- 1% rule
- 1.22% ✓
- Cap rate
- 9.66%
- Cash-on-cash
- 12.02%
- DSCR
- 1.53
- GRM
- 6.8
CMA / ARV
No comps found within radius.
Projected returns pro-forma
3.0% appreciation · 3.0% rent growth · sell at horizon
- IRR
- 18.8%
- Equity multiple
- 2.07×
- Total profit
- $23,906
- Equity at exit
- $35,926
- IRR
- 20.1%
- Equity multiple
- 3.91×
- Total profit
- $65,137
- Equity at exit
- $55,367
Cash invested: $22,372 (down + closing). Projections, not guarantees.
Landlord ↔ Tenant lean methodology
- Overall (STATE)
- 41 Moderately Tenant-Leaning
- State Maine
- 41 Moderately Tenant-Leaning · D+2
- County
- — inherits STATE
- City
- — inherits STATE
ZIP-level market 04285
- Active inventory
- 16
- Price-to-rent
- 6.8×
Monthly cashflow live
- Estimated rent
- $978 medium interval (Pro) →
- Mortgage (P&I)
- −$419
- Tax from tax record
- −$96 /mo · $1,151/yr
- Insurance
- −$33
- HOA
- −$0
- Vacancy / Maint / Mgmt
- −$205
- Net cashflow
- $224
Break-even live
UW: 25.0% down · 7.5% · 30yr · 1.5% tax · 5.0% vac · 8.0% maint · 8.0% mgmt
Financing live
Cash to close
- Down payment
- $19,975
- Closing costs
- $2,397
- Reserves months
- —
- Total cash needed
- —
Loan-product check · same deal, 3 products live
Conventional
25% down · 7.5% · 30yr
- Down + closing
- —
- Monthly P&I
- —
- Monthly cashflow
- —
- DSCR
- —
- Eligible?
- —
Personal DTI + credit; lowest rate.
DSCR
20% down · 8.5% · 30yr
- Down + closing
- —
- Monthly P&I
- —
- Monthly cashflow
- —
- DSCR
- —
- Eligible?
- —
No personal income docs; deal must DSCR.
Hard money
10% down · 12.0% · 12mo
- Down + closing
- —
- Monthly P&I
- —
- Monthly cashflow
- —
- DSCR
- —
- Eligible?
- —
Short-term bridge; refi at stabilization.
Listing history 12 events
-
2026-06-18days on market $79,900 Active 16 DOM
-
2026-06-17days on market $79,900 Active 15 DOM
-
2026-06-16days on market $79,900 Active 14 DOM
-
2026-06-15days on market $79,900 Active 13 DOM
-
2026-06-13days on market $79,900 Active 11 DOM
-
2026-06-12days on market $79,900 Active 10 DOM
-
2026-06-09days on market $79,900 Active 7 DOM
-
2026-06-08days on market $79,900 Active 6 DOM
-
2026-06-07days on market $79,900 Active 5 DOM
-
2026-06-07days on market $79,900 Active 4 DOM
-
2026-06-03remarks 699-char remark
-
2026-06-03$79,900 Active 1 DOM
ⓘ Source: listings_history table (triggers on properties + properties_extension) + one-shot
backfill from property_details.listing_events for pre-trigger history.
Tax reassessment forecast ME · Partial reset (capped growth)
- Current annual tax
- $1,151 · $96/mo
- Projected year-2 tax
- $1,151 · $96/mo
- Expected delta
- $0/yr ($0/mo · 0.0%)
ⓘ Screening estimate from a state-policy table — verify with the county assessor before closing.
Climate risk First Street
- Flood 6/10 Major FEMA zone X · 70% chance over 30 yrs
- Wildfire 1/10 Low
- Heat 2/10 Low 7 d/yr ≥88°F today · 17 d/yr by 30 yrs out
- Wind 3/10 Moderate 6% chance of damaging wind over 30 yrs
- Air quality 2/10 Low 1 unhealthy d/yr today · 1 by 30 yrs out
Nearby sold comps map
Loading sold comps map…
Walkable amenities ~0.75 mi
Loading nearby amenities…
Taxation est. · year 1
- Rental income
- $11,730
- − Mortgage interest
- −$4,476
- − Property taxes
- −$1,151
- − Insurance
- −$400
- − Repairs & maintenance
- −$938
- − Management
- −$938
- − Depreciation
- −$2,324
- Taxable income
- $1,503
- Est. tax owed @ 24.0%
- −$361
- After-tax cash flow
- $2,328/yr
For passive investors: Depreciation is non-cash, so a rental often shows a tax loss while cash-flowing — sheltering income. Rental losses are passive: they offset passive income freely, and up to $25,000/yr can offset ordinary (W-2) income if you actively participate and your MAGI is under $100k (phasing out to $0 by $150k); unused losses carry forward. On sale, claimed depreciation is recaptured at up to 25%, and gains may owe capital-gains tax (a 1031 exchange can defer both). Figures are a year-1 estimate at your 24.0% rate — not tax advice; consult a CPA.
Schools (NCES district)
- District
- RSU 09
- NCES district ID
- 2314809
- Math proficiency
- 78% ▲ 48.00%
- Reading proficiency
- 82% ▲ 31.00%
- Median HH income
- $40,202
- Composite
- 66.71/100
- National rank
- #409
- State rank
- #88 of 112 in ME
Livability — Weld
No livability data for this city. (Only ~50 U.S. cities are tracked.)
Census & demographics
- Population (ZIP)
- 513
Population outlook (Franklin County) Hauer SSP2
- Today (2025)
- 28,948 people
- By 2030
- 27,889 · -3.7%
- By 2040
- 25,275 · -12.7%
- By 2050
- 22,770 · -21.3%
- By 2075
- 18,980 · -34.4%
- By 2100
- 16,816 · -41.9%
Race, ethnicity, and origin ACS 2023
- Neighborhood character
- Predominantly White (99%)
- Race & ethnicity
- White 99%
- Common ancestry
- Romanian 7% Lithuanian 5% Slovak 4%
- Foreign-born
- 0% · China
- Languages at home
- 95% English-only · French/Haitian/Cajun 5%
Political lean MEDSL · Franklin
- 2024 margin
- Lean R (+8.2) · D 44.8% · R 53.0% · Other 2.2%
- 2008→2024 swing
- -28.5pp toward R · 2008: 20.3pp · 2024: -8.2pp
- All cycles
- 2024: R+8.2 2020: R+3.9 2016: R+5.5 2012: D+18.5 2008: D+20.3
Not yet ingested
- Civics
- —
Market trends
- HPI YoY
- —
- Current HPI
- —
- Rent YoY
- —
- Metro
- —
- State GDP YoY
- —
- F500 in state
- 0
Price history
+17.7% since first listed33 events — show timeline
- 2026-06-02 Listed $79,900 MREIS
- 2026-06-02 Listed $79,900 MREIS
- 2026-04-24 Delisted — MREIS
- 2026-04-01 Delisted — MREIS
- 2026-04-01 Delisted — MREIS
- 2026-02-19 Listed $79,900 MREIS
- 2026-02-19 Listed $79,900 MREIS
- 2025-12-17 Delisted — MREIS
- 2025-10-20 Listed $55,000 MREIS
- 2025-08-28 Relisted — MREIS
- 2025-08-28 Price Changed $75,000 MREIS
- 2025-07-18 Delisted — MREIS
- 2025-07-14 Price Changed $89,850 MREIS
- 2025-07-04 Price Changed $89,900 MREIS
- 2025-06-17 Price Changed $109,900 MREIS
- 2025-06-05 Price Changed $139,950 MREIS
- 2025-05-19 Listed $149,950 MREIS
- 2024-05-22 Delisted — MREIS
- 2024-05-15 Price Changed $99,000 MREIS
- 2024-04-30 Price Changed $139,950 MREIS
- 2023-12-05 Price Changed $169,900 MREIS
- 2023-09-22 Price Changed $219,000 MREIS
- 2023-09-21 Listed $249,000 MREIS
- 2023-08-15 Delisted — MREIS
- 2023-07-24 Price Changed $129,000 MREIS
- 2023-03-06 Delisted — MREIS
- 2023-03-06 Price Changed $149,950 MREIS
- 2023-03-06 Relisted — MREIS
- 2023-03-03 Listed $149,950 MREIS
- 2023-01-03 Delisted — MREIS
- 2022-10-19 Price Changed $179,950 MREIS
- 2022-09-27 Listed $199,000 MREIS
- 2003-11-17 Listed $67,900 MREIS
Property tax history
+7.3%/yrLatest (2018): $1,151 · -4.0% YoY. Source: county tax records.
Cash-flow waterfall
monthlySold comps — $/sqft
last 12 mo · ≤1 miLoading sold comps…