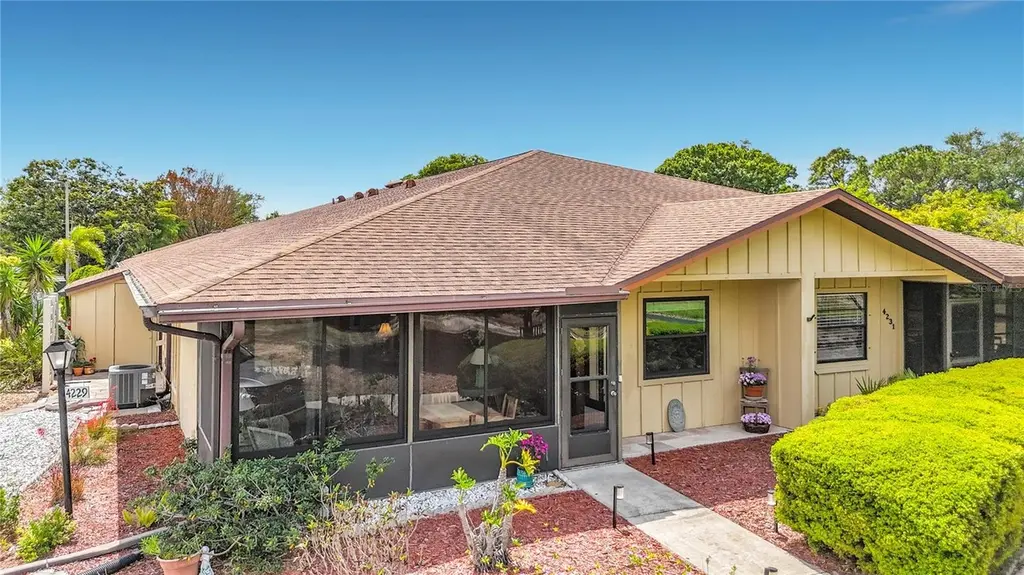
4229 66th Street Cir W #4229 · Bradenton, FL
Flood risk 1/10 · Minimal
- FEMA flood zone
- X (unshaded)
- Chance of flooding over 30 yrs
- 0.0%
- Est. flood insurance / yr
- $507 – $1,088
Fire risk 3/10 · Minor
- Est. fire insurance / yr
- $947 – $1,759
Heat risk 10/10 · Severe
- Hot days now (above 106°F)
- 7 days/yr
- Hot days in 30 yrs
- 28 days/yr
Wind risk 10/10 · Severe
- Chance of severe wind over 30 yrs
- 99.0%
Air-quality risk 3/10 · Minor
- Unhealthy air days now
- 2 days/yr
- Unhealthy air days in 30 yrs
- 2 days/yr
Risk factors via First Street. Map © Google.
Why this score? — see what drove the C grade
The composite is a weighted blend of 9 inputs, each scored 0–100. Each bar is that input's sub-score; the figure is the points it added to the 100-point composite (weight × sub-score).
- Cash flow +20.9/30.0
- 1% rule +8.1/10.0
- ARV discount +7.5/15.0
- DSCR +6.6/10.0
- Schools +4.4/10.0
- Livability +4.0/5.0
- Condition / age +2.5/5.0
- Rent growth +2.4/5.0
- Appreciation +0.0/10.0
$165,000
🖨 Deal sheet 📄 Offer letter ✓ Due diligence
Listing remarks
Hurricane windows and slider-BIKE TO ANNA MARIA BEACH-Experience refined, low-maintenance living just minutes from the world-renowned beaches of Anna Maria Island. Located in the highly sought-after 55+ community of Heritage Village, this impeccably maintained 2-bedroom, 2-bath villa offers the perfect blend of comfort, style, and coastal convenience. Situated in a non-flood zone, this residence provides valuable peace of mind along with hurricane-impact windows and door for added protection and efficiency. Inside, enjoy a bright, spacious layout with tasteful updates and a clean, move-in ready interior—ideal for both relaxed living and entertaining. Inventory in this community is ext
Key facts
- Non flood zone
- Corner unit
- $500 HOA
Tags
Property features AI
Finance
- Other: Partially furnished; Directions: Cortez Rd to 66th Street into community to building R
- Financial info: Total monthly fees $500; total annual fees $6,000; Lease restrictions apply
- HOA & community: DELLCORE association; monthly condo/HOA fee $500 (includes cable TV, internet, maintenance structure and grounds, pest control, escrow reserves fund); Association amenities include clubhouse, pool, recreation facilities, shuffleboard court, vehicle restrictions, community mailbox; Association approval required; Senior community; pets not allowed; No truck/RV/motorcycle parking; deed restrictions
Exterior
- Parking: Paved access
- Utilities: Public water; Public sewer; Public utilities
- Home design: Condominium; Residential property; One story; Faces north; Entry on first floor
- Construction: Frame construction; Shingle roof; Slab foundation; Built as part of building R
- Exterior features: Screened side porch; Patio/porch with sliding doors; Mature, Florida-friendly/native landscaping; Corner, landscaped, level and paved lot
Interior
- Kitchen: Microwave; Range; Refrigerator
- Bedrooms: 2 bedrooms
- Flooring: Ceramic tile; Linoleum
- Bathrooms: 2 full bathrooms
- Heating & cooling: Central heating (electric); Central air conditioning
- Interior features: Ceiling fans; Open floorplan; Living room/dining room combo; Insulated and thermal windows with window treatments; Sliding doors
- Laundry & utility: Laundry room; Electric water heater; Washer
Neighborhood map
What this means for you Summary
Snapshot
- This is a 2-bed/2.0-bath condo listed at $165k.
Deal economics
- At list price, monthly cash flow is $228 ($3k/yr) — positive.
- The deal already cash-flows at list — no discount required.
- Meets the 1% rule at list price ($2k rent vs $165k).
- Recommended offer: $160k (3.0% below list) — sets the bar for market timing.
- Cap rate 8.0% vs local median 3.6% in Bradenton — top-decile yield for the area; either an underpriced asset or a hidden risk that comps aren't pricing in. Stress-test before assuming the spread holds.
Location & tenants
- Location reads 81/100 on livability (#101 in FL, #1,528 nationally) — a professional / high-income tenant draw. Strengths: commute A+, cost of living A+, housing A+; Watch: employment D+, crime D, amenities F.
- Manatee (suburban): math 54% / reading 50% proficiency, ranked #26 of 73 in FL (top 36%) — acceptable for families but not a draw, mixed tenant base, ~2y average lease.
- Market conditions: Rents soft (-0.3%/yr); 510 active listings in the ZIP; 40 comparable units currently listed for rent nearby; rentals at typical pace (median 16d on market — plan ~3-4 weeks tenant-placement turnaround); solid renter incomes; 7,472 units permitted in Manatee County in 2024 (1,782 in 5+ unit buildings).
- This rent runs 32% of the median local income ($82k/yr) — at the standard rent-burdened threshold; future hikes will face affordability resistance.
Forward outlook
- Local home prices are declining (-3.0%/yr); year-one equity from $1k of loan paydown is wiped out by about $5k of value loss. Plan a longer hold.
- Manatee County population projected at +43% by 2050 — long-run rental-demand tailwind backs the buy-and-hold thesis.
Negotiation context
- It's been on market 47 days — a 3% lower offer ($160k) is reasonable based on typical stale-listing flexibility.
- Current owner paid $78k; list at $165k implies a 113% gain — meaningful room to come down on a strong offer.
Risks & watch-outs
- Watch-outs: HOA is 23% of rent.
- Climate carrying-cost: severe wind risk, 99% chance of damaging wind over 30y; extreme-heat days projected 7→28/yr by 2055 (HVAC capex compounding) — expect insurance premiums to compound above CPI over the hold.
Questions for the listing agent
- It's been on market 47 days. Have you received any prior offers? Is the seller open to a 3% concession, seller financing, or rate buy-down credit?
- What does the HOA fee cover, when was the last increase, and are there any pending special assessments or reserve-fund shortfalls?
- Any open or pending special assessments — roof, HVAC, plumbing, elevator, façade? What's the per-unit balance and payoff schedule, and is the seller paying it off at close or rolling it to the buyer?
- Is there a deadline driving the sale (1031 exchange, divorce, estate, relocation)? That informs how much negotiation room exists.
- Crime grade is D in this area — have there been break-ins, vandalism, or insurance claims at this property in the last 3 years? What carrier currently insures it and at what premium?
- What's the average days-on-market for RENTAL listings here right now (not sales)? A rising rental-DOM trend means longer vacancies and softer asking-rent achievability than the comps imply.
- What's the recent tenant-quality profile in this submarket — average credit score on applications, eviction rate, late-payment / NSF rate, and stable-employment percentage? A property-management company in the area should have these aggregated.
- How much new apartment / multifamily construction is in the pipeline within 1–3 miles? Heavy new supply (>2% of stock underway) typically softens rents 12–24 months out; light construction supports rent growth.
Investment metrics
- 1% rule
- 1.31% ✓
- Cap rate
- 7.95%
- Cash-on-cash
- 5.93%
- DSCR
- 1.26
- GRM
- 6.4
CMA / ARV
No comps found within radius.
Projected returns pro-forma
-3.0% appreciation · 0.0% rent growth · sell at horizon
- IRR
- -11.3%
- Equity multiple
- 0.60×
- Total profit
- $-18,284
- Equity at exit
- $24,602
- IRR
- -8.6%
- Equity multiple
- 0.55×
- Total profit
- $-20,679
- Equity at exit
- $14,266
Cash invested: $46,200 (down + closing). Projections, not guarantees.
Landlord ↔ Tenant lean methodology
- Overall (STATE)
- 87 Strongly Landlord-Friendly
- State Florida
- 87 Strongly Landlord-Friendly · R+3
- County
- — inherits STATE
- City
- — inherits STATE
ZIP-level market 34209
- Rents YoY
- -0.3%
- Active inventory
- 510
- Price-to-rent
- 6.4×
Monthly cashflow live
- Estimated rent
- $2,160 high interval (Pro) →
- Mortgage (P&I)
- −$865
- Tax from tax record
- −$44 /mo · $524/yr
- Insurance
- −$69
- HOA
- −$500
- Vacancy / Maint / Mgmt
- −$454
- Net cashflow
- $228
Break-even live
UW: 25.0% down · 7.5% · 30yr · 1.5% tax · 5.0% vac · 8.0% maint · 8.0% mgmt
Financing live
Cash to close
- Down payment
- $41,250
- Closing costs
- $4,950
- Reserves months
- —
- Total cash needed
- —
Loan-product check · same deal, 3 products live
Conventional
25% down · 7.5% · 30yr
- Down + closing
- —
- Monthly P&I
- —
- Monthly cashflow
- —
- DSCR
- —
- Eligible?
- —
Personal DTI + credit; lowest rate.
DSCR
20% down · 8.5% · 30yr
- Down + closing
- —
- Monthly P&I
- —
- Monthly cashflow
- —
- DSCR
- —
- Eligible?
- —
No personal income docs; deal must DSCR.
Hard money
10% down · 12.0% · 12mo
- Down + closing
- —
- Monthly P&I
- —
- Monthly cashflow
- —
- DSCR
- —
- Eligible?
- —
Short-term bridge; refi at stabilization.
Rent comps 40 comps
| Address | Beds | Baths | Sqft | Rent | $/sqft | DOM | Units | Dist |
|---|---|---|---|---|---|---|---|---|
| 4209 66th Street Cir W Bradenton, FL | 2.0 | 2.0 | 1044 | $2,900 | $2.78 | 23d | 1 | 0.01mi |
| 4161 66th Street Cir W Bradenton, FL | 2.0 | 2.0 | 1044 | $1,800 | $1.72 | 15d | 1 | 0.01mi |
| 4112 66th Street Cir W Bradenton, FL | 2.0 | 2.0 | 1100 | $1,960 | $1.78 | 19d | 1 | 0.12mi |
| 6711 45th Ave W Unit A Bradenton, FL | 2.0 | 2.0 | 1100 | $1,700 | $1.55 | 15d | 1 | 0.23mi |
| 4116 62nd St W Bradenton, FL | 2.0 | 2.0 | 840 | $1,650 | $1.96 | 3d | 1 | 0.23mi |
| 4601 66th St W Bradenton, FL | 3.0 | 1.0–2.0 | 917 | $2,065 | $2.25 | 1d | 24 | 0.26mi |
| 4501 71st St W Bradenton, FL | 1.0–2.0 | 1.0–2.0 | 850 | $1,680 | $1.98 | 1d | 28 | 0.36mi |
| 4572 Red Maple Rd #901 Bradenton, FL | 2.0 | 2.0 | 1224 | $1,600 | $1.31 | 23d | 1 | 0.36mi |
| 4063 Overture Cir Bradenton, FL | 3.0 | 2.0 | 1277 | $2,400 | $1.88 | 23d | 1 | 0.41mi |
| 4118 59th St W Bradenton, FL | 2.0 | 1.0 | 756 | $1,800 | $2.38 | 15d | 1 | 0.41mi |
| 4037 Overture Cir Unit 4037 Bradenton, FL | 3.0 | 2.0 | 1381 | $2,195 | $1.59 | 23d | 1 | 0.44mi |
| 4005 Overture Cir Unit 4005 Bradenton, FL | 3.0 | 2.0 | 1381 | $2,700 | $1.96 | 23d | 1 | 0.46mi |
| 7202 Hamilton Rd Unit 7202 Bradenton, FL | 3.0 | 2.0 | 1277 | $2,250 | $1.76 | 15d | 1 | 0.47mi |
| 5907 36th Ave Cir W #5907 Bradenton, FL | 2.0 | 2.0 | 937 | $2,800 | $2.99 | 23d | 1 | 0.49mi |
| 4196 Overture Cir Unit 4196 Bradenton, FL | 3.0 | 2.0 | 1277 | $2,300 | $1.80 | 3d | 1 | 0.50mi |
| 7333 Skybird Rd Bradenton, FL | 3.0 | 2.0 | 1277 | $3,500 | $2.74 | 23d | 1 | 0.55mi |
| 6709 35th Ave W Unit 1346494P Bradenton, FL | 3.0 | 2.0 | 1227 | $4,527 | $3.69 | 15d | 1 | 0.58mi |
| 4122 Overture Cir #533 Bradenton, FL | 3.0 | 2.0 | 1381 | $2,900 | $2.10 | 23d | 1 | 0.58mi |
| 4880 51st St W Bradenton, FL | 1.0–4.0 | 1.0–3.0 | 1019 | $1,527 | $1.50 | 3d | 11 | 0.63mi |
| 4850 51st St W Bradenton, FL | 1.0–2.0 | 1.0–2.0 | 800 | $1,750 | $2.19 | 14d | 3 | 0.64mi |
| 4850 51st St W Bradenton, FL | 1.0–2.0 | 1.0–2.0 | 800 | $1,750 | $2.19 | 3d | 2 | 0.64mi |
| 4112 Cape Vista Dr Bradenton, FL | 3.0 | 2.0 | 1450 | $3,495 | $2.41 | 23d | 1 | 0.67mi |
| 2914 64th St W Bradenton, FL | 2.0 | 2.0 | 1135 | $2,025 | $1.78 | 23d | 1 | 0.76mi |
| 4802 51st St W Bradenton, FL | 1.0–2.0 | 1.0–2.0 | 1007 | $1,950 | $1.94 | 15d | 15 | 0.76mi |
| 4802 51st St W Bradenton, FL | 1.0–2.0 | 1.0–2.0 | 1007 | $1,950 | $1.94 | 3d | 13 | 0.76mi |
| 4005 78th St W Bradenton, FL | 3.0 | 2.0 | 1000 | $1,895 | $1.90 | 3d | 1 | 0.77mi |
| 2926 63rd St W Bradenton, FL | 2.0 | 2.0 | 946 | $2,100 | $2.22 | 3d | 1 | 0.78mi |
| 5909 30th Ave W Bradenton, FL | 1.0–2.0 | 1.0–2.0 | 788 | $1,670 | $2.12 | 1d | 6 | 0.80mi |
| 4325 80th St W Bradenton, FL | 3.0 | 1.5 | 1000 | $2,200 | $2.20 | 23d | 1 | 0.87mi |
| 4210 Ironwood Cir Unit 103J Bradenton, FL | 1.0 | 1.0 | 750 | $1,800 | $2.40 | 23d | 1 | 0.93mi |
| 4110 Ironwood Cir #104 Bradenton, FL | 2.0 | 2.0 | 1152 | $1,800 | $1.56 | 23d | 1 | 0.94mi |
| 5933 28th Ave W Bradenton, FL | 1.0–2.0 | 1.0–2.0 | 945 | $2,013 | $2.13 | 1d | 6 | 0.99mi |
| 4040 Ironwood Cir Unit 404F Bradenton, FL | 2.0 | 2.0 | 1008 | $1,750 | $1.74 | 11d | 1 | 1.01mi |
| 4040 Ironwood Cir Unit 406F Bradenton, FL | 2.0 | 2.0 | 1008 | $1,675 | $1.66 | 15d | 1 | 1.01mi |
| 2724 72nd St W Unit 2010 Bradenton, FL | 2.0 | 2.0 | 942 | $1,950 | $2.07 | 2d | 1 | 1.02mi |
| 4460 Ironwood Cir Unit 406 Bradenton, FL | 1.0 | 1.0 | 750 | $1,600 | $2.13 | 21d | 1 | 1.02mi |
| 4460 Ironwood Cir Unit 406 Bradenton, FL | 1.0 | 1.0 | 750 | $1,600 | $2.13 | 1d | 1 | 1.02mi |
| 4460 Ironwood Cir Unit 501A Bradenton, FL | 1.0 | 1.5 | 840 | $2,595 | $3.09 | 23d | 1 | 1.02mi |
| 4550 47th St W Bradenton, FL | 1.0–3.0 | 1.0–2.0 | 930 | $1,800 | $1.94 | 1d | 27 | 1.05mi |
| 4240 Ironwood Cir #404 Bradenton, FL | 2.0 | 2.0 | 1008 | $2,495 | $2.48 | 23d | 1 | 1.08mi |
HOA detail condo
- Monthly dues
- $500 · $6,000/yr
- Assessments
- None detected in remarks — confirm with the listing agent.
Listing history 14 events
-
2026-06-13status $165,000 Pending 47 DOM
-
2026-06-10days on market $165,000 Active 47 DOM
-
2026-06-09days on market $165,000 Active 46 DOM
-
2026-06-08days on market $165,000 Active 45 DOM
-
2026-06-08days on market $165,000 Active 44 DOM
-
2026-06-03days on market $165,000 Active 40 DOM
-
2026-06-02days on market $165,000 Active 39 DOM
-
2026-06-01days on market $165,000 Active 38 DOM
-
2026-05-31days on market $165,000 Active 37 DOM
-
2026-05-13price $165,000
-
2026-04-24$165,900 Active
-
2002-09-24soldstatus $77,500
-
2001-05-14soldstatus $60,000
-
1984-03-01soldstatus $58,000
ⓘ Source: listings_history table (triggers on properties + properties_extension) + one-shot
backfill from property_details.listing_events for pre-trigger history.
Tax reassessment forecast FL · Resets to sale price
- Current annual tax
- $524 · $44/mo
- Projected year-2 tax
- $1,370 · $114/mo
- Expected delta
- +$845/yr (+$70/mo · 161.2%)
ⓘ Screening estimate from a state-policy table — verify with the county assessor before closing.
Climate risk First Street
- Flood 1/10 Low FEMA zone X (unshaded) · 0% chance over 30 yrs
- Wildfire 3/10 Moderate
- Heat 10/10 Extreme 7 d/yr ≥106°F today · 28 d/yr by 30 yrs out
- Wind 10/10 Extreme 99% chance of damaging wind over 30 yrs
- Air quality 3/10 Moderate 2 unhealthy d/yr today · 2 by 30 yrs out
Nearby sold comps map
Loading sold comps map…
Walkable amenities ~0.75 mi
Loading nearby amenities…
Taxation est. · year 1
- Rental income
- $25,915
- − Mortgage interest
- −$9,243
- − Property taxes
- −$524
- − Insurance
- −$825
- − Repairs & maintenance
- −$2,073
- − Management
- −$2,073
- − HOA
- −$6,000
- − Depreciation
- −$4,800
- Taxable income
- $376
- Est. tax owed @ 24.0%
- −$90
- After-tax cash flow
- $2,650/yr
For passive investors: Depreciation is non-cash, so a rental often shows a tax loss while cash-flowing — sheltering income. Rental losses are passive: they offset passive income freely, and up to $25,000/yr can offset ordinary (W-2) income if you actively participate and your MAGI is under $100k (phasing out to $0 by $150k); unused losses carry forward. On sale, claimed depreciation is recaptured at up to 25%, and gains may owe capital-gains tax (a 1031 exchange can defer both). Figures are a year-1 estimate at your 24.0% rate — not tax advice; consult a CPA.
Schools (NCES district)
- District
- Manatee
- NCES district ID
- 1201230
- Math proficiency
- 54% ▼ -6.00%
- Reading proficiency
- 50% ▼ -2.00%
- Median HH income
- $49,607
- Composite
- 44.43/100
- National rank
- #2806
- State rank
- #26 of 73 in FL
Livability — Bradenton
- Score
- 81/100
- State rank
- #101
- US rank
- #1528
Category grades
Schools grade is shown separately in the Schools card above.
Census & demographics
- Census place
- Bradenton, FL
- County
- Manatee County · 416,364 people
- City population
- 227,091
- Metro
- North Port-Sarasota-Bradenton, FL
- Population (ZIP)
- 33,224
- Household income
- $81,728
- Rent vs Own
- Severe rent burden
- 1126.0
Population outlook (Manatee County) Hauer SSP2
- Today (2025)
- 447,342 people
- By 2030
- 488,911 · +9.3%
- By 2040
- 567,934 · +27.0%
- By 2050
- 637,995 · +42.6%
- By 2075
- 781,970 · +74.8%
- By 2100
- 848,272 · +89.6%
Race, ethnicity, and origin ACS 2023
- Neighborhood character
- Predominantly White (84%)
- Race & ethnicity
- White 84% Hispanic / Latino 11% Two or more races 6% Black 2% Asian 1%
- Hispanic origin (detail)
- Puerto Rican 4% Cuban 3%
- Common ancestry
- Romanian 3% Slovak 3% Lithuanian 3%
- Foreign-born
- 9% · Canada, Jamaica, China
- Languages at home
- 90% English-only · Spanish 6% Russian/Polish/Slavic 1% Other Indo-European 1%
Political lean MEDSL · Manatee
- 2024 margin
- Strong R (+23.5) · D 37.9% · R 61.4%
- 2008→2024 swing
- -16.5pp toward R · 2008: -7.0pp · 2024: -23.5pp
- All cycles
- 2024: R+23.5 2020: R+16.1 2016: R+17.1 2012: R+12.5 2008: R+7.0
Not yet ingested
- Civics
- —
Market trends
- HPI YoY
- ▼ -360.34%
- Current HPI
- 320.0061
- Rent YoY
- ▼ -0.30%
- Metro
- North Port-Sarasota-Bradenton, FL
- State GDP YoY
- ▲ 3.28%
- F500 in state
- 36
Industry mix (Fortune 500 HQ in FL)
| Industry | F500 HQs | Revenue |
|---|---|---|
| Industrial Technology | 2 | $29B |
|
||
| Insurance | 2 | $17B |
|
||
| Retail | 1 | $60B |
|
||
| Technology Distribution | 1 | $58B |
|
||
| Homebuilding | 1 | $35B |
|
||
| Technology Manufacturing | 1 | $35B |
|
||
Price history
+184.5% since first listed5 events — show timeline
- 2026-05-13 Price Changed $165,000 Stellar MLS as Distributed by MLS Grid
- 2026-04-24 Listed $165,900 Stellar MLS as Distributed by MLS Grid
- 2002-09-24 Sold (Public Records) $77,500 Public Records
- 2001-05-14 Sold (Public Records) $60,000 Public Records
- 1984-03-01 Sold (Public Records) $58,000 Public Records
Property tax history
+1.1%/yrLatest (2025): $524 · +1.8% YoY. Source: county tax records.
Cash-flow waterfall
monthlySold comps — $/sqft
last 12 mo · ≤1 miLoading sold comps…