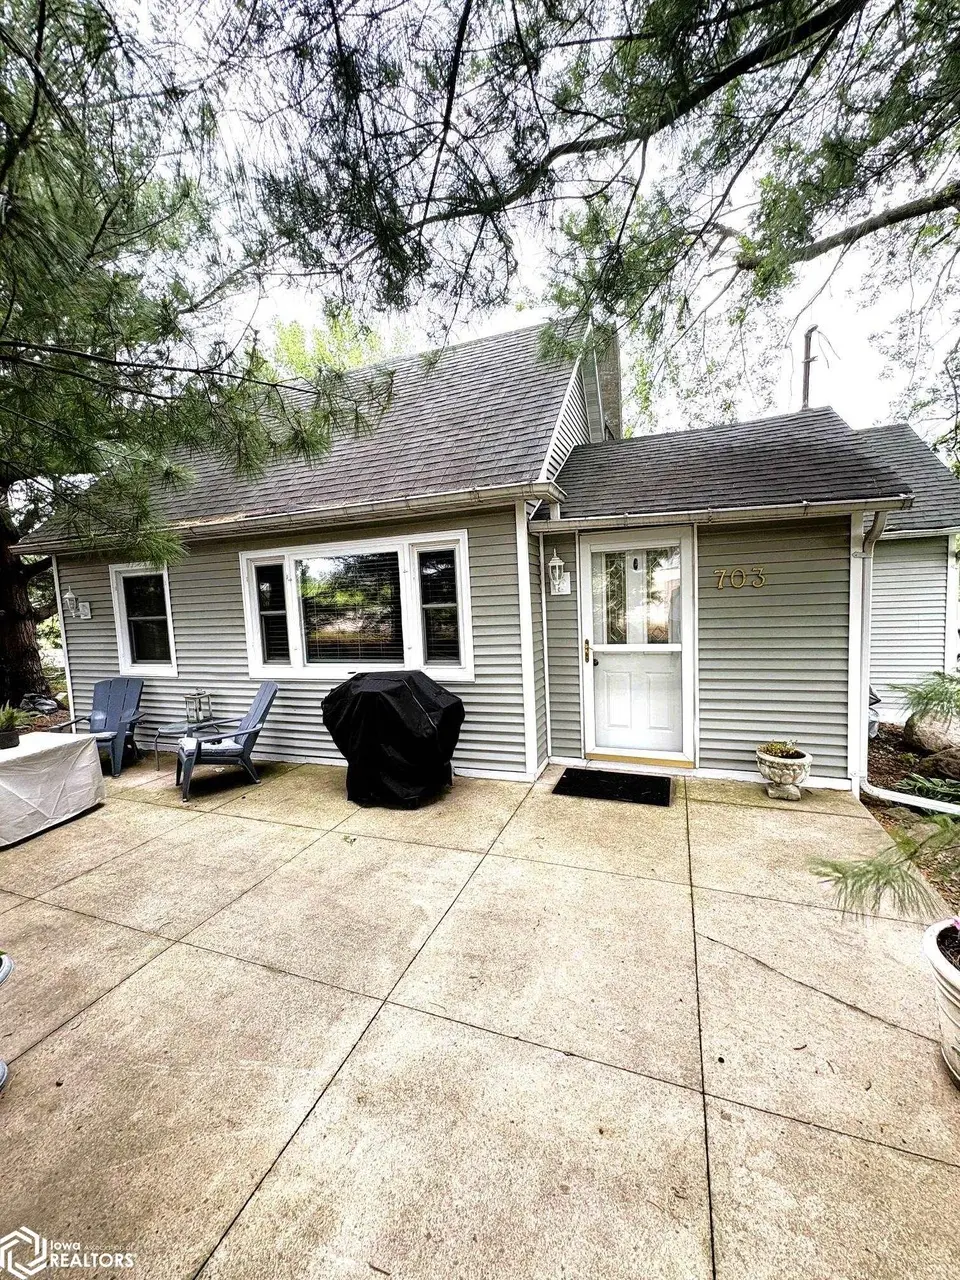
703 E Main St · Brooklyn, IA
Flood risk No data
- FEMA flood zone
- —
- Chance of flooding over 30 yrs
- —
- Est. flood insurance / yr
- —
Fire risk No data
- Est. fire insurance / yr
- —
Heat risk No data
- Hot days now (above threshold)
- —
- Hot days in 30 yrs
- —
Wind risk No data
- Chance of severe wind over 30 yrs
- —
Air-quality risk No data
- Unhealthy air days now
- —
- Unhealthy air days in 30 yrs
- —
Risk factors via First Street. Map © Google.
Why this score? — see what drove the D+ grade
The composite is a weighted blend of 9 inputs, each scored 0–100. Each bar is that input's sub-score; the figure is the points it added to the 100-point composite (weight × sub-score).
- ARV discount +10.9/15.0
- Appreciation +9.3/10.0
- Cash flow +8.8/30.0
- Schools +6.2/10.0
- Livability +3.3/5.0
- Rent growth +2.5/5.0
- Condition / age +2.5/5.0
- DSCR +2.4/10.0
- 1% rule +1.9/10.0
$124,900
🖨 Deal sheet (PDF) 📄 Offer letter ✓ Due diligence
Listing remarks MLS
703 E. Main St, Brooklyn, IA 52211 is a cute good cents home. Well maintained! Nice kitchen, dining room, living room, two bedrooms and a full bath. Great place to start! Owner has made many updates to the property, come on and take a look! 24 hours notice please
Key facts
- Full basement
- Storage shed
- Outdoor space
Tags
Property features AI
Exterior
- Parking: Concrete parking
- Utilities: Circuit breaker electric service; Public sewer
- Home design: Single family residence; Residential property
- Construction: Frame construction; Vinyl siding
- Exterior features: Shingle roof; Storage structure; City street frontage; Publicly maintained road
Interior
- Kitchen: Microwave; Exhaust fan; Dishwasher
- Flooring: Carpet; Laminate; Vinyl
- Bathrooms: 1 full bathroom
- Heating & cooling: Forced air heating; Central air conditioning
- Interior features: Microwave; Exhaust fan; Dishwasher; Electric water heater; Basement
- Laundry & utility: Washer; Dryer
Neighborhood map
What this means for you Summary
Snapshot
- This is a 2-bed/1.0-bath single-family listed at $125k.
Deal economics
- At list price, monthly cash flow is $-102 ($-1k/yr) — negative.
- To cash-flow at today's rent, offer at most $107k (14.4% below list).
- To meet the 1% rule (rent ≥ 1% of price), the offer needs to be $86k (31.1% below list).
- Recommended offer: $86k (31.1% below list) — sets the bar for 1% rule.
Location & tenants
- Location reads 66/100 on livability (#509 in IA) — a middle-class / working-renter tenant base. Strengths: crime A+, cost of living A+, housing A+; Watch: employment D+, amenities F, commute F.
- Brooklyn-Guernsey-Malcom Community School District (rural): math 72% / reading 74% proficiency, ranked #101 of 289 in IA (top 35%) — strong family-tenant draw, lease renewals of 3-5y typical.
- Zoned schools: Brooklyn-Guernsey-Malcom Elementary School (math 82% / reading 82%, grade A+, #44 of 616 statewide, top 9%, 296 students, 34% FRL); Brooklyn-Guernsey-Malcom Jr-Sr High School (math 64% / reading 68%, grade B, #200 of 336 statewide, top 60%, 265 students, 35% FRL).
- Market conditions: 58 active listings in the ZIP; 27 units permitted in Poweshiek County in 2024 (0 in 5+ unit buildings).
Forward outlook
- In year one you build about $12k of equity ($864 loan paydown + $11k appreciation (8.6% local appreciation)).
- Poweshiek County population projected to shrink 3% by 2050 — rents likely to lag national; underwrite the cash flow, not the appreciation.
- By year 4, paydown + projected appreciation supports a ~$40k cash-out refi (75% LTV) — recoverable capital for the next deal without selling this one.
Negotiation context
- It's been on market 35 days — a 3% lower offer ($121k) is reasonable based on typical stale-listing flexibility.
- 3 sale attempts since 12y ago with the ask held roughly flat each time — persistent listings suggest the price (not the market) is what's stuck; bring a comps-based counter.
- Current owner paid $62k; list at $125k implies a 101% gain — meaningful room to come down on a strong offer.
Risks & watch-outs
- Watch-outs: built in 1900 — expect roof / HVAC / electrical / plumbing capex.
Questions for the listing agent
- What do current leases actually rent for vs. the listed asking? Can we see a recent rent roll and the last 12 months of T-12 income?
- It's been on market 35 days. Have you received any prior offers? Is the seller open to a 31% concession, seller financing, or rate buy-down credit?
- Built in 1900 — when were the roof, HVAC, electrical panel, plumbing, and water heater last replaced?
- Is there a deadline driving the sale (1031 exchange, divorce, estate, relocation)? That informs how much negotiation room exists.
- Schools are A-rated — typically a magnet for longer-tenancy family renters. What's the average tenant stay here, and is there a school-zone premium baked into asking?
- The area grade is low — what's the realistic commute time and amenity access for the typical tenant pool here? Any planned neighborhood developments (good or bad) we should know about?
- What's the average days-on-market for RENTAL listings here right now (not sales)? A rising rental-DOM trend means longer vacancies and softer asking-rent achievability than the comps imply.
- What's the recent tenant-quality profile in this submarket — average credit score on applications, eviction rate, late-payment / NSF rate, and stable-employment percentage? A property-management company in the area should have these aggregated.
- How much new for-sale + rental construction is in the pipeline within 1–3 miles? Heavy new supply typically softens prices + rents 12–24 months out; constrained supply supports both.
Investment metrics
- 1% rule
- 0.69% ✗
- Cap rate
- 5.32%
- Cash-on-cash
- -3.49%
- DSCR
- 0.84
- GRM
- 12.1
CMA / ARV
- ARV (on-the-fly)
- $135,096
- Comps found
- 4
Show comp detail 4 sales within ~0.75 mi
| Address | Dist | Beds/Ba | Sqft | Sold | Price | $/sf | Match |
|---|---|---|---|---|---|---|---|
| 511 Middle St | 0.15mi | 2/1.0 | 900 (+4%) | 9mo | $62,000 | $69 | 79 |
| 807 Park Ave | 0.42mi | 3/1.0 (+1) | 880 (+2%) | 6mo | $137,000 | $156 | 68 |
| 410 Sunset Dr | 0.47mi | 2/1.0 | 832 (-4%) | 7mo | $140,000 | $168 | 66 |
| 215 Linden Ct | 0.66mi | 2/1.5 | 988 (+14%) | 9mo | $140,000 | $142 | 36 |
Match score weights: distance 35% · size 25% · config 20% · recency 20%. Top-matched comps best support the ARV.
Projected returns pro-forma
8.56% appreciation · 3.0% rent growth · sell at horizon
- IRR
- 18.6%
- Equity multiple
- 2.41×
- Total profit
- $49,452
- Equity at exit
- $99,696
- IRR
- 17.4%
- Equity multiple
- 5.25×
- Total profit
- $148,559
- Equity at exit
- $202,665
Cash invested: $34,972 (down + closing). Projections, not guarantees.
Landlord ↔ Tenant lean methodology
- Overall (STATE)
- 83 Strongly Landlord-Friendly
- State Iowa
- 83 Strongly Landlord-Friendly · R+6
- County
- — inherits STATE
- City
- — inherits STATE
ZIP-level market 52211
- Home prices YoY
- 2.6%
- Active inventory
- 58
- Price-to-rent
- 12.1×
Monthly cashflow live
- Estimated rent
- $860 medium interval (Pro) →
- Mortgage (P&I)
- −$655
- Tax from tax record
- −$74 /mo · $890/yr
- Insurance
- −$52
- HOA
- −$0
- Vacancy / Maint / Mgmt
- −$181
- Net cashflow
- $-102
Break-even live
Sensitivity live
| Price | -10% $-31 | -5% $-66 | +0% $-102 | +5% $-137 | +10% $-172 |
|---|---|---|---|---|---|
| Rent | -10% $-170 | -5% $-136 | +0% $-102 | +5% $-68 | +10% $-34 |
| Rate | -1.0pp $-39 | -0.5pp $-70 | base $-102 | +0.5pp $-134 | +1.0pp $-167 |
UW: 25.0% down · 7.5% · 30yr · 1.5% tax · 5.0% vac · 8.0% maint · 8.0% mgmt
Financing live
Cash to close
- Down payment
- $31,225
- Closing costs
- $3,747
- Reserves months
- —
- Total cash needed
- —
Loan-product check · same deal, 3 products live
Conventional
25% down · 7.5% · 30yr
- Down + closing
- —
- Monthly P&I
- —
- Monthly cashflow
- —
- DSCR
- —
- Eligible?
- —
Personal DTI + credit; lowest rate.
DSCR
20% down · 8.5% · 30yr
- Down + closing
- —
- Monthly P&I
- —
- Monthly cashflow
- —
- DSCR
- —
- Eligible?
- —
No personal income docs; deal must DSCR.
Hard money
10% down · 12.0% · 12mo
- Down + closing
- —
- Monthly P&I
- —
- Monthly cashflow
- —
- DSCR
- —
- Eligible?
- —
Short-term bridge; refi at stabilization.
Listing history 21 events
-
2026-06-21days on market $124,900 Active 35 DOM
-
2026-06-21days on market $124,900 Active 34 DOM
-
2026-06-18days on market $124,900 Active 32 DOM
-
2026-06-17days on market $124,900 Active 31 DOM
-
2026-06-16days on market $124,900 Active 30 DOM
-
2026-06-15days on market $124,900 Active 29 DOM
-
2026-06-13statusdays on market $124,900 Active 27 DOM
-
2026-06-12days on market $124,900 Active Under Contract 26 DOM
-
2026-06-09days on market $124,900 Active Under Contract 23 DOM
-
2026-06-08days on market $124,900 Active Under Contract 22 DOM
-
2026-06-07days on market $124,900 Active Under Contract 21 DOM
-
2026-06-07days on market $124,900 Active Under Contract 20 DOM
-
2026-06-04days on market $124,900 Active Under Contract 17 DOM
-
2026-06-02days on market $124,900 Active Under Contract 16 DOM
-
2026-06-01days on market $124,900 Active Under Contract 15 DOM
-
2026-05-31days on market $124,900 Active Under Contract 14 DOM
-
2026-05-31days on market $124,900 Active Under Contract 13 DOM
-
2026-05-17$124,900 Active
-
2014-12-29soldstatus $62,000
-
2014-12-19soldstatus $62,000 263-char remark
Show marketing remark (263 chars)
703 E. Main St, Brooklyn, IA 52211 is a cute good cents home. Well maintained! Nice kitchen, dining room, living room, two bedrooms and a full bath. Great place to start! Owner has made many updates to the property, come on and take a look! 24 hours notice please
-
2014-06-10$68,400 263-char remark
Show marketing remark (263 chars)
703 E. Main St, Brooklyn, IA 52211 is a cute good cents home. Well maintained! Nice kitchen, dining room, living room, two bedrooms and a full bath. Great place to start! Owner has made many updates to the property, come on and take a look! 24 hours notice please
ⓘ Source: listings_history table (triggers on properties + properties_extension) + one-shot
backfill from property_details.listing_events for pre-trigger history.
Tax reassessment forecast IA · Partial reset (capped growth)
- Current annual tax
- $890 · $74/mo
- Projected year-2 tax
- $1,425 · $119/mo
- Expected delta
- +$535/yr (+$45/mo · 60.2%)
ⓘ Screening estimate from a state-policy table — verify with the county assessor before closing.
Nearby sold comps map
Loading sold comps map…
Walkable amenities ~0.75 mi
Loading nearby amenities…
Taxation est. · year 1
- Rental income
- $10,321
- − Mortgage interest
- −$6,996
- − Property taxes
- −$890
- − Insurance
- −$624
- − Repairs & maintenance
- −$826
- − Management
- −$826
- − Depreciation
- −$3,633
- Taxable loss
- −$3,475
- Est. tax savings @ 24.0%
- +$834
- After-tax cash flow
- $-387/yr
For passive investors: Depreciation is non-cash, so a rental often shows a tax loss while cash-flowing — sheltering income. Rental losses are passive: they offset passive income freely, and up to $25,000/yr can offset ordinary (W-2) income if you actively participate and your MAGI is under $100k (phasing out to $0 by $150k); unused losses carry forward. On sale, claimed depreciation is recaptured at up to 25%, and gains may owe capital-gains tax (a 1031 exchange can defer both). Figures are a year-1 estimate at your 24.0% rate — not tax advice; consult a CPA.
Schools (NCES district)
- District
- Brooklyn-Guernsey-Malcom Community School District
- NCES district ID
- 1905490
- Math proficiency
- 72% ▼ -4.00%
- Reading proficiency
- 74% ▲ 2.00%
- Median HH income
- $49,307
- Composite
- 61.79/100
- National rank
- #734
- State rank
- #101 of 289 in IA
Livability — Brooklyn
- Score
- 66/100
- State rank
- #509
- US rank
- #11267
Category grades
Schools grade is shown separately in the Schools card above.
Census & demographics
- Census place
- Brooklyn, IA
- Population (ZIP)
- 2,671
Population outlook (Poweshiek County) Hauer SSP2
- Today (2025)
- 18,601 people
- By 2030
- 18,342 · -1.4%
- By 2040
- 17,944 · -3.5%
- By 2050
- 18,029 · -3.1%
- By 2075
- 19,945 · +7.2%
- By 2100
- 22,637 · +21.7%
Race, ethnicity, and origin ACS 2023
- Neighborhood character
- Predominantly White (98%)
- Race & ethnicity
- White 98% Hispanic / Latino 2%
- Common ancestry
- English 4% Slovak 3% Iranian 2%
- Foreign-born
- 2% · Canada
- Languages at home
- 98% English-only · Spanish 1%
Political lean MEDSL · Poweshiek
- 2024 margin
- R (+17.0) · D 40.8% · R 57.8% · Other 1.5%
- 2008→2024 swing
- -28.7pp toward R · 2008: 11.8pp · 2024: -17.0pp
- All cycles
- 2024: R+17.0 2020: R+13.3 2016: R+6.8 2012: D+9.1 2008: D+11.8
Not yet ingested
- Civics
- —
Market trends
- HPI YoY
- ▲ 8.56%
- Current HPI
- 332.4308
- Rent YoY
- —
- Metro
- —
- State GDP YoY
- ▲ 2.48%
- F500 in state
- 4
Industry mix (Fortune 500 HQ in IA)
| Industry | F500 HQs | Revenue |
|---|---|---|
| Financial Services | 1 | $16B |
|
||
| Retail / Convenience | 1 | $15B |
|
||
Price history
+82.6% since first listed6 events — show timeline
- 2026-06-13 Relisted — IAR
- 2026-05-27 Contingent — IAR
- 2026-05-17 Listed $124,900 IAR
- 2014-12-29 Sold (Public Records) $62,000 Public Records
- 2014-12-19 Sold (MLS) $62,000 IAR
- 2014-06-10 Listed $68,400 IAR
Property tax history
+1.3%/yrLatest (2025): $890 · -29.5% YoY. Source: county tax records.
Cash-flow waterfall
monthlySold comps — $/sqft
last 12 mo · ≤1 miLoading sold comps…