1600 Mc Minn Ave · Mount Pleasant, TX
Flood risk 1/10 · Minimal
- FEMA flood zone
- X (unshaded)
- Chance of flooding over 30 yrs
- 0.0%
- Est. flood insurance / yr
- $507 – $1,088
Fire risk 5/10 · Moderate
- Est. fire insurance / yr
- $1,222 – $2,270
Heat risk 7/10 · Major
- Hot days now (above 112°F)
- 7 days/yr
- Hot days in 30 yrs
- 22 days/yr
Wind risk 6/10 · Moderate
- Chance of severe wind over 30 yrs
- 27.0%
Air-quality risk 2/10 · Minimal
- Unhealthy air days now
- 0 days/yr
- Unhealthy air days in 30 yrs
- 1 days/yr
Risk factors via First Street. Map © Google.
Why this score? — see what drove the D+ grade
The composite is a weighted blend of 9 inputs, each scored 0–100. Each bar is that input's sub-score; the figure is the points it added to the 100-point composite (weight × sub-score).
- ARV discount +15.0/15.0
- Cash flow +12.7/30.0
- Livability +3.9/5.0
- DSCR +3.8/10.0
- 1% rule +3.7/10.0
- Schools +3.7/10.0
- Rent growth +2.5/5.0
- Condition / age +2.5/5.0
- Appreciation +0.0/10.0
$190,000
🖨 Deal sheet 📄 Offer letter ✓ Due diligence
Listing remarks
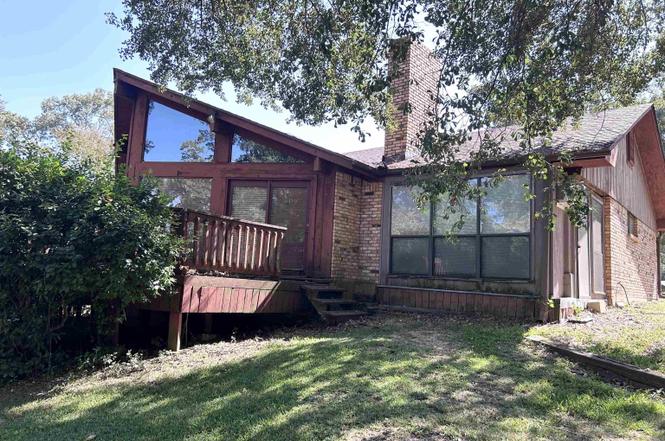
Welcome home to this beautiful and spacious 3-bedroom, 2.5-bath property nestled in one of Mt. Pleasant’s most peaceful neighborhoods. Surrounded by mature trees and scenic views, this home offers a perfect blend of comfort and tranquility. Inside, you’ll find a roomy layout ideal for family living or entertaining guests. The carport provides convenient parking, while the large yard creates a serene outdoor retreat for relaxing or hosting gatherings. Enjoy the charm of this quiet street while still being just minutes from local schools, shopping, and dining. A true gem in a great location — come experience the peaceful lifestyle this home has to offer!
Key facts
- Built 1977
- Listed 26 days
Neighborhood map
What this means for you Summary
Snapshot
- This is a 3-bed/2.5-bath single-family listed at $190k.
Deal economics
- At list price, monthly cash flow is $-20 ($-238/yr) — negative.
- To cash-flow at today's rent, offer at most $186k (1.8% below list).
- To meet the 1% rule (rent ≥ 1% of price), the offer needs to be $166k (12.5% below list).
- Recommended offer: $166k (12.5% below list) — sets the bar for 1% rule.
- Cap rate 6.2% vs local median 3.5% in Mount Pleasant — top-decile yield for the area; either an underpriced asset or a hidden risk that comps aren't pricing in. Stress-test before assuming the spread holds.
Location & tenants
- Location reads 77/100 on livability (#81 in TX, #2,808 nationally) — a middle-class / working-renter tenant base. Strengths: cost of living A+, housing A+, health & safety A+; Watch: employment C-, amenities D-, commute F.
- Mount Pleasant ISD (town): math 45% / reading 44% proficiency, ranked #291 of 826 in TX (top 35%) — families likely to look elsewhere, expect single-tenant / working-renter base with shorter leases; 74% free/reduced lunch — lower-income household profile, screen leases tightly.
- Zoned schools: E C Brice El (math 47% / reading 52%, grade D, #865 of 4,322 statewide, top 21%, 460 students, 80% FRL); Mount Pleasant J H (math 40% / reading 45%, grade D-, #553 of 1,662 statewide, top 34%, 760 students, 81% FRL); Mount Pleasant H S (math 68% / reading 54%, grade C+, #258 of 1,632 statewide, top 16%, 1,521 students, 79% FRL).
- Market conditions: 382 active listings in the ZIP; 1 comparable units currently listed for rent nearby; 47 units permitted in Titus County in 2024 (10 in 5+ unit buildings).
- This rent runs 36% of the median local income ($56k/yr) — at the standard rent-burdened threshold; future hikes will face affordability resistance.
Forward outlook
- Local home prices are declining (-3.0%/yr); year-one equity from $1k of loan paydown is wiped out by about $6k of value loss. Plan a longer hold.
Negotiation context
- It's been on market 26 days — a 2% lower offer ($187k) is reasonable based on typical stale-listing flexibility.
- 2 sale attempts with the ask held roughly flat each time — persistent listings suggest the price (not the market) is what's stuck; bring a comps-based counter.
Risks & watch-outs
- Climate carrying-cost: major wind risk, 27% chance of damaging wind over 30y; moderate wildfire risk; extreme-heat days projected 7→22/yr by 2055 (HVAC capex compounding) — expect insurance premiums to compound above CPI over the hold.
Questions for the listing agent
- What do current leases actually rent for vs. the listed asking? Can we see a recent rent roll and the last 12 months of T-12 income?
- Built in 1977 — when were the roof, HVAC, electrical panel, plumbing, and water heater last replaced?
- Is there a deadline driving the sale (1031 exchange, divorce, estate, relocation)? That informs how much negotiation room exists.
- Schools are D-rated, which usually means shorter tenancies and higher turnover. Who's the typical renter profile here, and what's been the actual vacancy rate?
- The area grade is low — what's the realistic commute time and amenity access for the typical tenant pool here? Any planned neighborhood developments (good or bad) we should know about?
- What's the average days-on-market for RENTAL listings here right now (not sales)? A rising rental-DOM trend means longer vacancies and softer asking-rent achievability than the comps imply.
- What's the recent tenant-quality profile in this submarket — average credit score on applications, eviction rate, late-payment / NSF rate, and stable-employment percentage? A property-management company in the area should have these aggregated.
- How much new for-sale + rental construction is in the pipeline within 1–3 miles? Heavy new supply typically softens prices + rents 12–24 months out; constrained supply supports both.
Investment metrics
- 1% rule
- 0.87% ✗
- Cap rate
- 6.17%
- Cash-on-cash
- -0.45%
- DSCR
- 0.98
- GRM
- 9.5
CMA / ARV
- ARV (on-the-fly)
- $234,060
- Comps found
- 9
Show comp detail 9 sales within ~0.75 mi
| Address | Dist | Beds/Ba | Sqft | Sold | Price | $/sf | Match |
|---|---|---|---|---|---|---|---|
| 307 E Magnolia Dr | 0.09mi | 4/2.0 (+1) | 1,672 (+1%) | 20mo | $219,000 | $131 | 71 |
| 108 Redbud | 0.28mi | 4/2.0 (+1) | 1,795 (+8%) | 1mo | $199,000 | $111 | 65 |
| 1215 S Lide Ave | 0.41mi | 3/2.0 | 1,596 (-4%) | 12mo | $259,900 | $163 | 63 |
| 412 Walnut St | 0.27mi | 3/2.0 | 1,736 (+5%) | 20mo | $245,000 | $141 | 61 |
| 1424 Larkin Ave | 0.20mi | 2/2.0 (-1) | 1,558 (-6%) | 17mo | $250,000 | $160 | 59 |
| 402 Dellwood Dr | 0.50mi | 3/1.0 | 1,544 (-7%) | 16mo | $220,000 | $142 | 46 |
| 1308 Stephens Ave | 0.71mi | 4/2.0 (+1) | 1,584 (-5%) | 11mo | $219,900 | $139 | 43 |
| 710 Florey | 0.75mi | 3/2.0 | 1,562 (-6%) | 21mo | $229,000 | $147 | 36 |
| 202 Mackinnon St | 0.70mi | 3/2.0 | 1,890 (+14%) | 20mo | $205,000 | $108 | 26 |
Match score weights: distance 35% · size 25% · config 20% · recency 20%. Top-matched comps best support the ARV.
Projected returns pro-forma
-3.0% appreciation · 3.0% rent growth · sell at horizon
- IRR
- -17.0%
- Equity multiple
- 0.40×
- Total profit
- $-32,013
- Equity at exit
- $28,330
- IRR
- -8.9%
- Equity multiple
- 0.45×
- Total profit
- $-29,350
- Equity at exit
- $16,428
Cash invested: $53,200 (down + closing). Projections, not guarantees.
Landlord ↔ Tenant lean methodology
- Overall (STATE)
- 87 Strongly Landlord-Friendly
- State Texas
- 87 Strongly Landlord-Friendly · R+5
- County
- — inherits STATE
- City
- — inherits STATE
ZIP-level market 75455
- Home prices YoY
- -27.0%
- Active inventory
- 382
- Price-to-rent
- 9.5×
Monthly cashflow live
- Estimated rent
- $1,662 medium interval (Pro) →
- Mortgage (P&I)
- −$996
- Tax from tax record
- −$257 /mo · $3,089/yr
- Insurance
- −$79
- HOA
- −$0
- Vacancy / Maint / Mgmt
- −$349
- Net cashflow
- $-20
Break-even live
UW: 25.0% down · 7.5% · 30yr · 1.5% tax · 5.0% vac · 8.0% maint · 8.0% mgmt
Financing live
Cash to close
- Down payment
- $47,500
- Closing costs
- $5,700
- Reserves months
- —
- Total cash needed
- —
Loan-product check · same deal, 3 products live
Conventional
25% down · 7.5% · 30yr
- Down + closing
- —
- Monthly P&I
- —
- Monthly cashflow
- —
- DSCR
- —
- Eligible?
- —
Personal DTI + credit; lowest rate.
DSCR
20% down · 8.5% · 30yr
- Down + closing
- —
- Monthly P&I
- —
- Monthly cashflow
- —
- DSCR
- —
- Eligible?
- —
No personal income docs; deal must DSCR.
Hard money
10% down · 12.0% · 12mo
- Down + closing
- —
- Monthly P&I
- —
- Monthly cashflow
- —
- DSCR
- —
- Eligible?
- —
Short-term bridge; refi at stabilization.
Rent comps 1 comps
| Address | Beds | Baths | Sqft | Rent | $/sqft | DOM | Units | Dist |
|---|---|---|---|---|---|---|---|---|
| 111 W Holland St Mount Pleasant, TX | 3.0 | 1.0 | 1608 | $1,800 | $1.12 | 20d | 1 | 0.66mi |
Listing history 5 events
-
2026-04-14soldstatus
-
2026-02-15status Pending
-
2026-01-20status Active
-
2025-10-14historical
-
2025-10-13$190,000
ⓘ Source: listings_history table (triggers on properties + properties_extension) + one-shot
backfill from property_details.listing_events for pre-trigger history.
Tax reassessment forecast TX · Resets to sale price
- Current annual tax
- $3,089 · $257/mo
- Projected year-2 tax
- $3,477 · $290/mo
- Expected delta
- +$388/yr (+$32/mo · 12.5%)
ⓘ Screening estimate from a state-policy table — verify with the county assessor before closing.
Climate risk First Street
- Flood 1/10 Low FEMA zone X (unshaded) · 0% chance over 30 yrs
- Wildfire 5/10 Major
- Heat 7/10 Severe 7 d/yr ≥112°F today · 22 d/yr by 30 yrs out
- Wind 6/10 Major 27% chance of damaging wind over 30 yrs
- Air quality 2/10 Low 0 unhealthy d/yr today · 1 by 30 yrs out
Nearby sold comps map
Loading sold comps map…
Walkable amenities ~0.75 mi
Loading nearby amenities…
Taxation est. · year 1
- Rental income
- $19,947
- − Mortgage interest
- −$10,643
- − Property taxes
- −$3,089
- − Insurance
- −$950
- − Repairs & maintenance
- −$1,596
- − Management
- −$1,596
- − Depreciation
- −$5,527
- Taxable loss
- −$3,454
- Est. tax savings @ 24.0%
- +$829
- After-tax cash flow
- $591/yr
For passive investors: Depreciation is non-cash, so a rental often shows a tax loss while cash-flowing — sheltering income. Rental losses are passive: they offset passive income freely, and up to $25,000/yr can offset ordinary (W-2) income if you actively participate and your MAGI is under $100k (phasing out to $0 by $150k); unused losses carry forward. On sale, claimed depreciation is recaptured at up to 25%, and gains may owe capital-gains tax (a 1031 exchange can defer both). Figures are a year-1 estimate at your 24.0% rate — not tax advice; consult a CPA.
Schools (NCES district)
- District
- Mount Pleasant ISD
- NCES district ID
- 4831760
- Math proficiency
- 45% ▼ -7.00%
- Reading proficiency
- 44% ▲ 2.00%
- Median HH income
- $40,642
- Composite
- 37.35/100
- National rank
- #4437
- State rank
- #291 of 826 in TX
Livability — Mount Pleasant
- Score
- 77/100
- State rank
- #81
- US rank
- #2808
Category grades
Schools grade is shown separately in the Schools card above.
Census & demographics
- Census place
- Mount Pleasant, TX
- County
- Titus County · 26,903 people
- City population
- 26,903
- Metro
- Mount Pleasant, TX
- Population (ZIP)
- 26,903
- Household income
- $56,163
- Rent vs Own
- Severe rent burden
- 758.0
Population outlook (Titus County) Hauer SSP2
- Today (2025)
- 33,205 people
- By 2030
- 33,187 · -0.1%
- By 2040
- 32,931 · -0.8%
- By 2050
- 32,231 · -2.9%
- By 2075
- 29,507 · -11.1%
- By 2100
- 25,369 · -23.6%
Race, ethnicity, and origin ACS 2023
- Neighborhood character
- Diverse neighborhood (Simpson 0.61)
- Race & ethnicity
- Hispanic / Latino 45% White 42% Two or more races 15% Black 10% Asian 1%
- Hispanic origin (detail)
- Mexican 42%
- Common ancestry
- Lithuanian 1% Slovak 1% Italian 1%
- Foreign-born
- 18% · Canada, Vietnam
- Languages at home
- 61% English-only · Spanish 37% Vietnamese 1%
Political lean MEDSL · Titus
- 2024 margin
- Solid R (+54.7) · D 22.3% · R 77.0%
- 2008→2024 swing
- -23.5pp toward R · 2008: -31.2pp · 2024: -54.7pp
- All cycles
- 2024: R+54.7 2020: R+44.7 2016: R+42.1 2012: R+39.0 2008: R+31.2
Not yet ingested
- Civics
- —
Market trends
- HPI YoY
- ▼ -79.66%
- Current HPI
- 215.4205
- Rent YoY
- —
- Metro
- Mount Pleasant, TX
- State GDP YoY
- ▲ 3.95%
- F500 in state
- 110
Industry mix (Fortune 500 HQ in TX)
| Industry | F500 HQs | Revenue |
|---|---|---|
| Energy | 16 | $1,198B |
|
||
| Technology | 5 | $198B |
|
||
| Engineering / Construction | 4 | $72B |
|
||
| Energy Services | 3 | $60B |
|
||
| Utilities | 3 | $41B |
|
||
| Healthcare | 2 | $330B |
|
||
Price history
5 events — show timeline
- 2026-04-14 Sold (Public Records) — Public Records
- 2026-02-15 Pending — GTAR
- 2026-01-20 Relisted — GTAR
- 2025-10-14 Delisted — GTAR
- 2025-10-13 Listed $190,000 GTAR
Property tax history
+4.4%/yrLatest (2025): $3,089 · +13.2% YoY. Source: county tax records.
Cash-flow waterfall
monthlySold comps — $/sqft
last 12 mo · ≤1 miLoading sold comps…