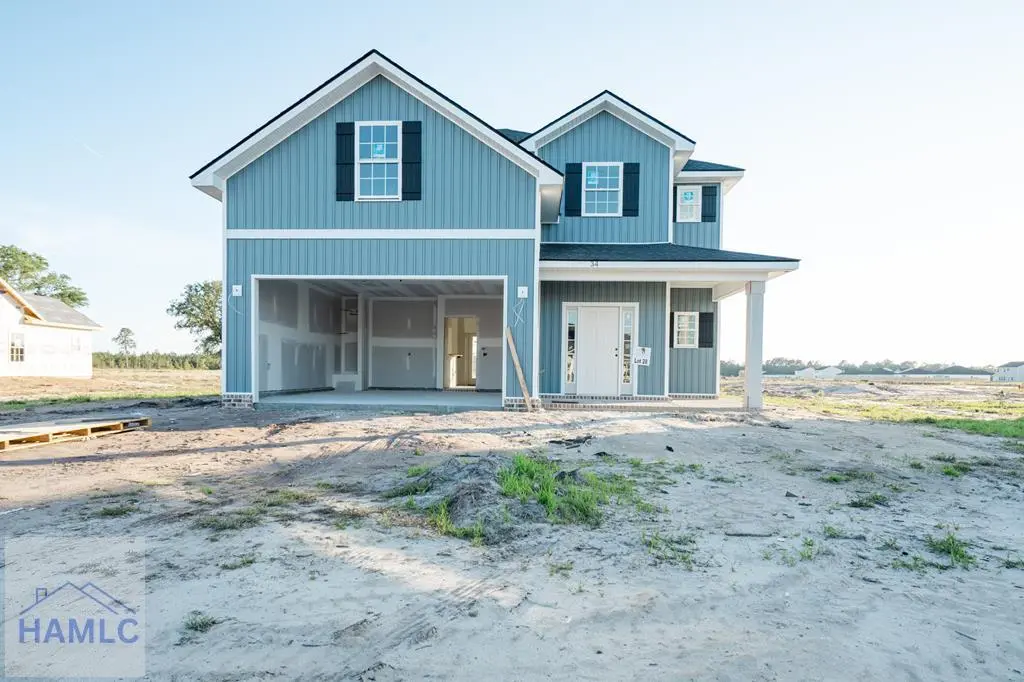
34 Blue Gill Ln · Ludowici, GA
Flood risk 1/10 · Minimal
- FEMA flood zone
- X (unshaded)
- Chance of flooding over 30 yrs
- 0.0%
- Est. flood insurance / yr
- $507 – $1,088
Fire risk 7/10 · Major
- Est. fire insurance / yr
- $963 – $1,789
Heat risk 8/10 · Major
- Hot days now (above 109°F)
- 7 days/yr
- Hot days in 30 yrs
- 18 days/yr
Wind risk 8/10 · Major
- Chance of severe wind over 30 yrs
- 99.0%
Air-quality risk 2/10 · Minimal
- Unhealthy air days now
- 2 days/yr
- Unhealthy air days in 30 yrs
- 2 days/yr
Risk factors via First Street. Map © Google.
Why this score? — see what drove the D- grade
The composite is a weighted blend of 9 inputs, each scored 0–100. Each bar is that input's sub-score; the figure is the points it added to the 100-point composite (weight × sub-score).
- Cash flow +9.1/30.0
- Appreciation +5.6/10.0
- ARV discount +4.2/15.0
- Livability +3.6/5.0
- 1% rule +2.9/10.0
- DSCR +2.5/10.0
- Rent growth +2.5/5.0
- Condition / age +2.5/5.0
- Schools +2.3/10.0
$309,900
🖨 Deal sheet 📄 Offer letter ✓ Due diligence
Listing remarks
Scheduled completion is June 30th, 2026. Nestled in the heart of Ludowici, Georgia, The Cottages at Lanier Ridge offers a welcoming community of new homes. Designed with comfort, quality, and convenience in mind. Thoughtful planning and modern design come together to create a neighborhood that feels both connected and private, with community street lighting providing safety and peace of mind. This four-bedroom cutie is the Katie plan. We think you'll love the layout and the gorgeous materials used to create this stunning home. Interior decorating is made easy with 9-foot ceiling throughout the first floor, a designer lighting package, and luxury vinyl plank flooring in main living areas. Th
Key facts
- Custom cabinets
- 9 foot ceiling
- Granite countertops
Tags
Property features AI
Finance
- HOA & community: Homeowners association with annual fee of $468 (about $39/month); Subdivision: Cottages At Lanier; Community sidewalks
Exterior
- Parking: 2 total parking spaces; 2 covered spaces; 2-car garage
- Security: Smoke detector(s)
- Utilities: Septic tank
- Home design: Single family residence; Two stories; Under construction
- Construction: Vinyl siding and wood siding; Frame construction; Spray foam insulation; Shingle roof; Slab foundation; Built in 2026 (under construction)
- Exterior features: Landscaped yard; Irrigation equipment; Other exterior features; Other fencing
Interior
- Kitchen: Electric oven; Electric range; Microwave; Range hood
- Flooring: Vinyl
- Bathrooms: 2 full bathrooms; 1 half bathroom
- Heating & cooling: Central heating; Central air
- Interior features: Built-in features; Kitchen island; Pantry; Recessed lighting; High ceilings; Smoke detector(s)
- Laundry & utility: Washer hookup; Electric water heater
Neighborhood map
What this means for you Summary
Snapshot
- This is a 4-bed/2.5-bath single-family listed at $310k.
Deal economics
- At list price, monthly cash flow is $-238 ($-3k/yr) — negative.
- To cash-flow at today's rent, offer at most $275k (11.1% below list).
- To meet the 1% rule (rent ≥ 1% of price), the offer needs to be $246k (20.6% below list).
- Recommended offer: $246k (20.6% below list) — sets the bar for 1% rule.
Location & tenants
- Location reads 72/100 on livability (#74 in GA) — a middle-class / working-renter tenant base. Strengths: cost of living A+, health & safety A+, crime A; Watch: schools D, employment D, amenities F.
- Long County (rural): math 26% / reading 26% proficiency, ranked #115 of 174 in GA (top 66%) — low school quality limits family demand, transient renter base, plan for 1-2y turnover; 61% free/reduced lunch — lower-income household profile, screen leases tightly.
- Market conditions: 409 active listings in the ZIP; 2 comparable units currently listed for rent nearby; 298 units permitted in Long County in 2024 (0 in 5+ unit buildings).
- This rent runs 39% of the median local income ($75k/yr) — at the standard rent-burdened threshold; future hikes will face affordability resistance.
Forward outlook
- In year one you build about $6k of equity ($2k loan paydown + $4k appreciation (1.2% local appreciation)).
- Long County population projected at +72% by 2050 — long-run rental-demand tailwind backs the buy-and-hold thesis.
- By year 6, paydown + projected appreciation supports a ~$32k cash-out refi (75% LTV) — recoverable capital for the next deal without selling this one.
Negotiation context
- It's been on market 32 days — a 3% lower offer ($301k) is reasonable based on typical stale-listing flexibility.
Risks & watch-outs
- Climate carrying-cost: severe wind risk, 99% chance of damaging wind over 30y; major wildfire risk; extreme-heat days projected 7→18/yr by 2055 (HVAC capex compounding) — expect insurance premiums to compound above CPI over the hold.
Questions for the listing agent
- What do current leases actually rent for vs. the listed asking? Can we see a recent rent roll and the last 12 months of T-12 income?
- It's been on market 32 days. Have you received any prior offers? Is the seller open to a 21% concession, seller financing, or rate buy-down credit?
- What does the HOA fee cover, when was the last increase, and are there any pending special assessments or reserve-fund shortfalls?
- Is there a deadline driving the sale (1031 exchange, divorce, estate, relocation)? That informs how much negotiation room exists.
- Schools are D-rated, which usually means shorter tenancies and higher turnover. Who's the typical renter profile here, and what's been the actual vacancy rate?
- The area grade is low — what's the realistic commute time and amenity access for the typical tenant pool here? Any planned neighborhood developments (good or bad) we should know about?
- What's the average days-on-market for RENTAL listings here right now (not sales)? A rising rental-DOM trend means longer vacancies and softer asking-rent achievability than the comps imply.
- What's the recent tenant-quality profile in this submarket — average credit score on applications, eviction rate, late-payment / NSF rate, and stable-employment percentage? A property-management company in the area should have these aggregated.
- How much new for-sale + rental construction is in the pipeline within 1–3 miles? Heavy new supply typically softens prices + rents 12–24 months out; constrained supply supports both.
Investment metrics
- 1% rule
- 0.79% ✗
- Cap rate
- 5.37%
- Cash-on-cash
- -3.29%
- DSCR
- 0.85
- GRM
- 10.5
CMA / ARV
- ARV (on-the-fly)
- $288,444
- Comps found
- 12
Show comp detail 12 sales within ~0.75 mi
| Address | Dist | Beds/Ba | Sqft | Sold | Price | $/sf | Match |
|---|---|---|---|---|---|---|---|
| 627 Doctor's Creek Rd NE | 0.16mi | 4/2.5 | 1,810 (-2%) | 2mo | $282,750 | $156 | 87 |
| 591 Doctor's Creek Rd NE | 0.21mi | 4/2.5 | 1,810 (-2%) | 3mo | $281,850 | $156 | 84 |
| 665 Doctor's Creek Rd NE | 0.16mi | 4/2.0 | 1,926 (+4%) | 1mo | $320,910 | $167 | 83 |
| 509 Doctor's Creek Rd NE | 0.21mi | 4/2.5 | 2,002 (+8%) | 4mo | $299,775 | $150 | 74 |
| 612 Doctor's Creek Rd NE | 0.16mi | 4/2.0 | 1,620 (-12%) | 2mo | $281,325 | $174 | 68 |
| 535 Doctor's Creek Rd NE | 0.21mi | 4/2.5 | 2,065 (+12%) | 4mo | $288,625 | $140 | 68 |
| 453 Lanier Rd NE | 0.37mi | 4/2.0 | 1,926 (+4%) | 9mo | $304,425 | $158 | 67 |
| 14 Pintail Ct NE | 0.34mi | 4/2.5 | 2,065 (+12%) | 9mo | $293,425 | $142 | 57 |
| 95 Doctor's Creek Rd NE | 0.37mi | 4/2.5 | 2,065 (+12%) | 9mo | $294,375 | $143 | 56 |
| 68 Pintail Ct NE | 0.41mi | 4/2.5 | 2,065 (+12%) | 7mo | $308,925 | $150 | 56 |
| 55 Pintail Ct NE | 0.38mi | 4/2.0 | 1,620 (-12%) | 8mo | $276,625 | $171 | 53 |
| 10 Rimes Ave Ave SE | 0.69mi | 4/2.5 | 2,072 (+12%) | 0mo | $293,900 | $142 | 47 |
Match score weights: distance 35% · size 25% · config 20% · recency 20%. Top-matched comps best support the ARV.
Projected returns pro-forma
1.16% appreciation · 3.0% rent growth · sell at horizon
- IRR
- -1.6%
- Equity multiple
- 0.92×
- Total profit
- $-6,882
- Equity at exit
- $108,359
- IRR
- 3.3%
- Equity multiple
- 1.41×
- Total profit
- $35,931
- Equity at exit
- $146,003
Cash invested: $86,772 (down + closing). Projections, not guarantees.
Landlord ↔ Tenant lean methodology
- Overall (STATE)
- 90 Strongly Landlord-Friendly
- State Georgia
- 90 Strongly Landlord-Friendly · R+3
- County
- — inherits STATE
- City
- — inherits STATE
ZIP-level market 31316
- Home prices YoY
- 0.6%
- Active inventory
- 409
- Price-to-rent
- 10.5×
Monthly cashflow live
- Estimated rent
- $2,459 medium interval (Pro) →
- Mortgage (P&I)
- −$1,625
- Tax est. 1.5%
- −$387 /mo · $4,648/yr
- Insurance
- −$129
- HOA
- −$39
- Vacancy / Maint / Mgmt
- −$516
- Net cashflow
- $-238
Break-even live
UW: 25.0% down · 7.5% · 30yr · 1.5% tax · 5.0% vac · 8.0% maint · 8.0% mgmt
Financing live
Cash to close
- Down payment
- $77,475
- Closing costs
- $9,297
- Reserves months
- —
- Total cash needed
- —
Loan-product check · same deal, 3 products live
Conventional
25% down · 7.5% · 30yr
- Down + closing
- —
- Monthly P&I
- —
- Monthly cashflow
- —
- DSCR
- —
- Eligible?
- —
Personal DTI + credit; lowest rate.
DSCR
20% down · 8.5% · 30yr
- Down + closing
- —
- Monthly P&I
- —
- Monthly cashflow
- —
- DSCR
- —
- Eligible?
- —
No personal income docs; deal must DSCR.
Hard money
10% down · 12.0% · 12mo
- Down + closing
- —
- Monthly P&I
- —
- Monthly cashflow
- —
- DSCR
- —
- Eligible?
- —
Short-term bridge; refi at stabilization.
Rent comps 2 comps
| Address | Beds | Baths | Sqft | Rent | $/sqft | DOM | Units | Dist |
|---|---|---|---|---|---|---|---|---|
| 15 Clark St Ludowici, GA | 3.0 | 2.0 | 1497 | $1,995 | $1.33 | 43d | 1 | 0.87mi |
| 59 Forest St NE Ludowici, GA | 4.0 | 2.0 | 1800 | $1,900 | $1.06 | 43d | 1 | 1.33mi |
HOA detail
- Monthly dues
- $39 · $468/yr
Listing history 18 events
-
2026-06-19days on market $309,900 Active 32 DOM
-
2026-06-18days on market $309,900 Active 31 DOM
-
2026-06-17days on market $309,900 Active 30 DOM
-
2026-06-16days on market $309,900 Active 29 DOM
-
2026-06-15days on market $309,900 Active 28 DOM
-
2026-06-14days on market $309,900 Active 26 DOM
-
2026-06-13days on market $309,900 Active 25 DOM
-
2026-06-10days on market $309,900 Active 23 DOM
-
2026-06-09days on market $309,900 Active 22 DOM
-
2026-06-08days on market $309,900 Active 21 DOM
-
2026-06-07days on market $309,900 Active 20 DOM
-
2026-06-05days on market $309,900 Active 17 DOM
-
2026-06-03days on market $309,900 Active 16 DOM
-
2026-06-02days on market $309,900 Active 15 DOM
-
2026-06-01days on market $309,900 Active 14 DOM
-
2026-05-31days on market $309,900 Active 13 DOM
-
2026-05-30days on market $309,900 Active 12 DOM
-
2026-04-28$309,900 Active
ⓘ Source: listings_history table (triggers on properties + properties_extension) + one-shot
backfill from property_details.listing_events for pre-trigger history.
Climate risk First Street
- Flood 1/10 Low FEMA zone X (unshaded) · 0% chance over 30 yrs
- Wildfire 7/10 Severe
- Heat 8/10 Severe 7 d/yr ≥109°F today · 18 d/yr by 30 yrs out
- Wind 8/10 Severe 99% chance of damaging wind over 30 yrs
- Air quality 2/10 Low 2 unhealthy d/yr today · 2 by 30 yrs out
Nearby sold comps map
Loading sold comps map…
Walkable amenities ~0.75 mi
Loading nearby amenities…
Taxation est. · year 1
- Rental income
- $29,511
- − Mortgage interest
- −$17,359
- − Property taxes
- −$4,648
- − Insurance
- −$1,550
- − Repairs & maintenance
- −$2,361
- − Management
- −$2,361
- − HOA
- −$468
- − Depreciation
- −$9,015
- Taxable loss
- −$8,251
- Est. tax savings @ 24.0%
- +$1,980
- After-tax cash flow
- $-874/yr
For passive investors: Depreciation is non-cash, so a rental often shows a tax loss while cash-flowing — sheltering income. Rental losses are passive: they offset passive income freely, and up to $25,000/yr can offset ordinary (W-2) income if you actively participate and your MAGI is under $100k (phasing out to $0 by $150k); unused losses carry forward. On sale, claimed depreciation is recaptured at up to 25%, and gains may owe capital-gains tax (a 1031 exchange can defer both). Figures are a year-1 estimate at your 24.0% rate — not tax advice; consult a CPA.
Schools (NCES district)
- District
- Long County
- NCES district ID
- 1303360
- Math proficiency
- 26% ▼ -14.00%
- Reading proficiency
- 26% ▼ -13.00%
- Median HH income
- $45,958
- Composite
- 22.51/100
- National rank
- #8090
- State rank
- #115 of 174 in GA
Livability — Ludowici
- Score
- 72/100
- State rank
- #74
- US rank
- #6449
Category grades
Schools grade is shown separately in the Schools card above.
Census & demographics
- County
- Long County · 13,812 people
- City population
- 13,812
- Metro
- Hinesville, GA
- Population (ZIP)
- 13,812
- Household income
- $74,766
- Rent vs Own
- Severe rent burden
- 109.0
Population outlook (Long County) Hauer SSP2
- Today (2025)
- 24,669 people
- By 2030
- 28,223 · +14.4%
- By 2040
- 35,430 · +43.6%
- By 2050
- 42,403 · +71.9%
- By 2075
- 56,996 · +131.0%
- By 2100
- 64,185 · +160.2%
Race, ethnicity, and origin ACS 2023
- Neighborhood character
- Diverse neighborhood (Simpson 0.56)
- Race & ethnicity
- White 61% Black 23% Hispanic / Latino 8% Two or more races 8%
- Hispanic origin (detail)
- Mexican 2% Puerto Rican 5%
- Common ancestry
- Serbian 1% Italian 1% Romanian 1%
- Foreign-born
- 3% · Canada
- Languages at home
- 92% English-only · Spanish 6% Other Asian/Pacific 1% German/W. Germanic 1%
Political lean MEDSL · Long
- 2024 margin
- Strong R (+29.5) · D 35.1% · R 64.6%
- 2008→2024 swing
- -5.4pp toward R · 2008: -24.1pp · 2024: -29.5pp
- All cycles
- 2024: R+29.5 2020: R+26.4 2016: R+30.8 2012: R+22.9 2008: R+24.1
Not yet ingested
- Civics
- —
Market trends
- HPI YoY
- ▲ 1.16%
- Current HPI
- 195.2978
- Rent YoY
- —
- Metro
- Hinesville, GA
- State GDP YoY
- ▲ 2.66%
- F500 in state
- 28
Industry mix (Fortune 500 HQ in GA)
| Industry | F500 HQs | Revenue |
|---|---|---|
| Paper / Packaging | 2 | $29B |
|
||
| Retail | 1 | $160B |
|
||
| Transportation / Logistics | 1 | $91B |
|
||
| Airlines | 1 | $62B |
|
||
| Consumer Goods | 1 | $47B |
|
||
| Utilities | 1 | $25B |
|
||
Price history
1 event — show timeline
- 2026-04-28 Listed $309,900 HABR
Cash-flow waterfall
monthlySold comps — $/sqft
last 12 mo · ≤1 miLoading sold comps…