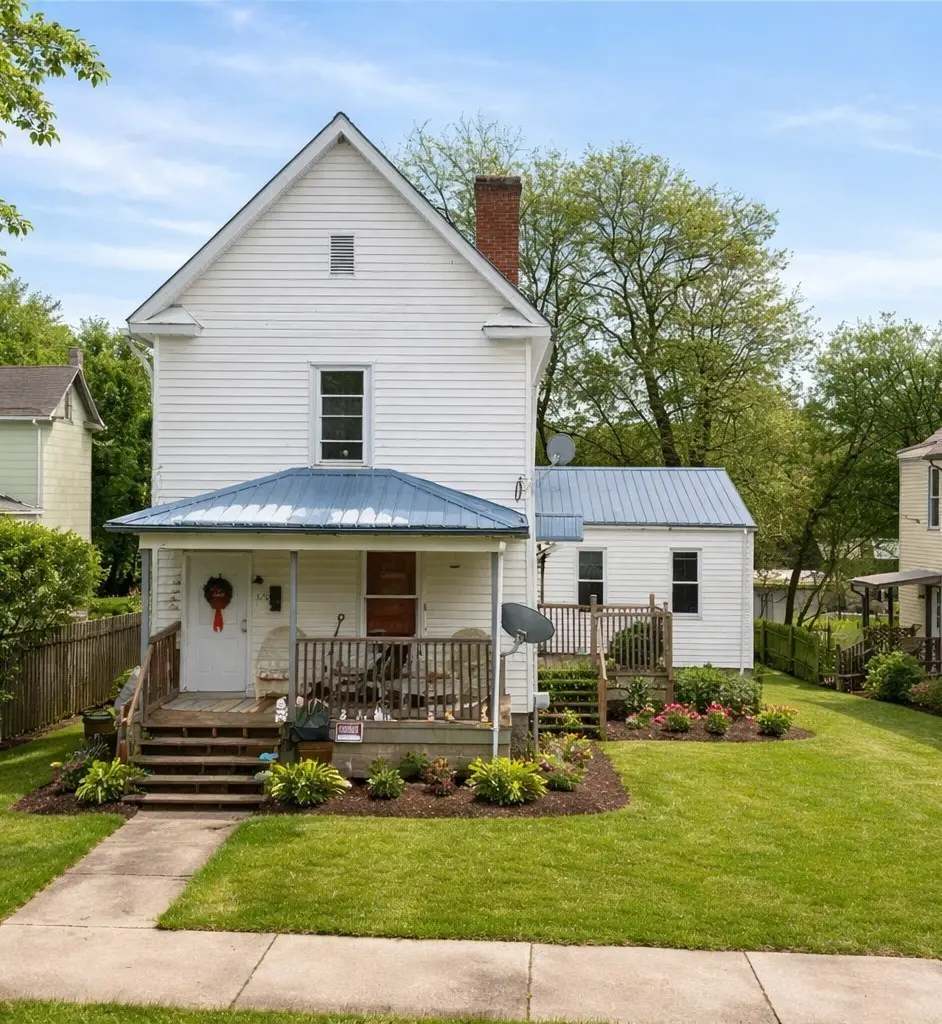
 Duplex
327 & 329 Howard St · Butler, PA
Flood risk 1/10 · Minimal
- FEMA flood zone
- X (unshaded)
- Chance of flooding over 30 yrs
- 0.0%
- Est. flood insurance / yr
- $507 – $1,088
Fire risk 1/10 · Minimal
- Est. fire insurance / yr
- $511 – $949
Heat risk 3/10 · Minor
- Hot days now (above 95°F)
- 7 days/yr
- Hot days in 30 yrs
- 18 days/yr
Wind risk 1/10 · Minimal
- Chance of severe wind over 30 yrs
- 0.0%
Air-quality risk 3/10 · Minor
- Unhealthy air days now
- 2 days/yr
- Unhealthy air days in 30 yrs
- 4 days/yr
Risk factors via First Street. Map © Google.
Why this score? — see what drove the B+ grade
The composite is a weighted blend of 9 inputs, each scored 0–100. Each bar is that input's sub-score; the figure is the points it added to the 100-point composite (weight × sub-score).
- Cash flow +30.0/30.0
- ARV discount +13.5/15.0
- DSCR +10.0/10.0
- 1% rule +9.0/10.0
- Rent growth +5.0/5.0
- Schools +4.3/10.0
- Livability +3.6/5.0
- Condition / age +2.2/5.0
- Appreciation +0.0/10.0
$135,000
🖨 Deal sheet 📄 Offer letter ✓ Due diligence
Multi-family units
County records classify this as Multi-Family (2-4 Unit). Listing-text estimate: 2 units. confirmed
Listing remarks MLS
320 W. Birch St. is a fully occupied duplex located in Butler. The property is 100% occupied and consistently leased, generating $4800.00 in quarterly rental income, or $19,200.00 annually. With a strong and reliable income stream, the duplex produces an approximate Net Operating Income (NOI) of $16,957.46 per year. Its central location and stable tenancy make this a solid investment opportunity with dependable cash flow.
Key facts
- 3,876 sq ft lot
- Built 1916
- Listed 171 days
Neighborhood map
What this means for you Summary
Snapshot
- This is a 2 × 2-bed/1-bath units multifamily listed at $135k. Condition is rated fair.
Deal economics
- At list price, monthly cash flow is $560 ($7k/yr) — positive. Per door: $280/mo.
- The deal already cash-flows at list — no discount required.
- Meets the 1% rule at list price ($2k rent vs $135k).
- Recommended offer: $119k (12.0% below list) — sets the bar for market timing.
- Cap rate 11.3% vs local median 3.8% in Butler — top-decile yield for the area; either an underpriced asset or a hidden risk that comps aren't pricing in. Stress-test before assuming the spread holds.
Location & tenants
- Location reads 71/100 on livability (#705 in PA) — a middle-class / working-renter tenant base. Strengths: cost of living A+, health & safety A+, schools A-; Watch: crime D-, amenities F, commute F.
- Butler Area SD (town): math 41% / reading 59% proficiency, ranked #181 of 539 in PA (top 34%) — acceptable for families but not a draw, mixed tenant base, ~2y average lease.
- Market conditions: Rents rising fast (+20.4%/yr); 206 active listings in the ZIP; 36 comparable units currently listed for rent nearby; rentals at typical pace (median 24d on market — plan ~3-4 weeks tenant-placement turnaround); 44% of comp listings sitting > 30 days — soft ceiling on asking rent; 987 units permitted in Butler County in 2024 (0 in 5+ unit buildings).
- This rent runs 36% of the median local income ($64k/yr) — at the standard rent-burdened threshold; future hikes will face affordability resistance.
Forward outlook
- Local home prices are declining (-3.0%/yr); year-one equity from $933 of loan paydown is wiped out by about $4k of value loss. Plan a longer hold.
- Butler County population projected to shrink 5% by 2050 — rents likely to lag national; underwrite the cash flow, not the appreciation.
- At projected returns (-3.0% appreciation + 8.0% rent growth), your $38k cash investment doubles in ~6 years — after that, you're playing with house money.
Negotiation context
- It's been on market 171 days — a 12% lower offer ($119k) is reasonable based on typical stale-listing flexibility.
- 2 sale attempts since 23y ago; this cycle's ask has dropped $15k (10%) from the opening price — seller is motivated, your offer sets the floor, not the list.
- Current owner paid $64k; list at $135k implies a 111% gain — meaningful room to come down on a strong offer.
Risks & watch-outs
- Watch-outs: built in 1916 — expect roof / HVAC / electrical / plumbing capex.
Questions for the listing agent
- It's been on market 171 days. Have you received any prior offers? Is the seller open to a 12% concession, seller financing, or rate buy-down credit?
- Can we see the unit-by-unit rent roll, current vacancy, and any below-market leases? What's the average tenancy length?
- What capital expenditures (roof, boiler, parking lot, exteriors) have been made in the last 5 years, and what's planned in the next 2?
- Have any recent inspections been done? Can we get a copy of the seller's disclosures and any deferred-maintenance estimates?
- Built in 1916 — when were the roof, HVAC, electrical panel, plumbing, and water heater last replaced?
- Why hasn't it sold? Are there any deal-killer items the seller is aware of (foundation, flood, title, zoning, code violations)?
- Is there a deadline driving the sale (1031 exchange, divorce, estate, relocation)? That informs how much negotiation room exists.
- Schools are A-rated — typically a magnet for longer-tenancy family renters. What's the average tenant stay here, and is there a school-zone premium baked into asking?
- Crime grade is D in this area — have there been break-ins, vandalism, or insurance claims at this property in the last 3 years? What carrier currently insures it and at what premium?
- What's the average days-on-market for RENTAL listings here right now (not sales)? A rising rental-DOM trend means longer vacancies and softer asking-rent achievability than the comps imply.
- What's the recent tenant-quality profile in this submarket — average credit score on applications, eviction rate, late-payment / NSF rate, and stable-employment percentage? A property-management company in the area should have these aggregated.
- How much new apartment / multifamily construction is in the pipeline within 1–3 miles? Heavy new supply (>2% of stock underway) typically softens rents 12–24 months out; light construction supports rent growth.
Investment metrics
- 1% rule
- 1.40% ✓
- Cap rate
- 11.27%
- Cash-on-cash
- 17.78%
- DSCR
- 1.79
- GRM
- 6.0
CMA / ARV
- ARV (median comp)
- $155,958
- List price
- $135,000
- Delta
- -13.44%
- Verdict
- UNDERPRICED
- Comps
- 1 within 2.0 mi
Show comp detail 12 sales within ~0.75 mi
| Address | Dist | Beds/Ba | Sqft | Sold | Price | $/sf | Match |
|---|---|---|---|---|---|---|---|
| 322 E Locust St | 0.18mi | 2/2.0 | — | 2mo | $90,000 | — | 77 |
| 401 N Mckean St | 0.18mi | 5/2.0 | — | 7mo | $145,000 | — | 73 |
| 312 Spruce St | 0.26mi | 3/2.0 | — | 8mo | $150,000 | — | 69 |
| 209 211 College St | 0.35mi | 7/3.0 | — | 5mo | $69,500 | — | 67 |
| 201 2nd St | 0.40mi | 4/2.0 | — | 2mo | $58,000 | — | 67 |
| 468 E Jefferson St | 0.38mi | —/— | — | 4mo | $66,501 | — | 67 |
| 303 & 305 2nd St | 0.35mi | 7/3.5 | — | 8mo | $194,900 | — | 65 |
| 528 Carbon St | 0.49mi | 3/3.0 | — | 2mo | $54,000 | — | 63 |
| 134 S Main St | 0.41mi | 16/7.0 | — | 7mo | $399,900 | — | 62 |
| 236 W Brady St | 0.47mi | 4/2.0 | — | 6mo | $111,000 | — | 61 |
| 332 S Main St | 0.62mi | 4/3.0 | — | 7mo | $189,900 | — | 52 |
| 518 W Penn St | 0.69mi | 2/2.0 | — | 4mo | $55,000 | — | 52 |
Match score weights: distance 35% · size 25% · config 20% · recency 20%. Top-matched comps best support the ARV.
Projected returns pro-forma
-3.0% appreciation · 8.0% rent growth · sell at horizon
- IRR
- 14.8%
- Equity multiple
- 1.63×
- Total profit
- $23,817
- Equity at exit
- $20,129
- IRR
- 27.0%
- Equity multiple
- 3.97×
- Total profit
- $112,254
- Equity at exit
- $11,672
Cash invested: $37,800 (down + closing). Projections, not guarantees.
Landlord ↔ Tenant lean methodology
- Overall (STATE)
- 62 Landlord-Friendly
- State Pennsylvania
- 62 Landlord-Friendly · EVEN
- County
- — inherits STATE
- City
- — inherits STATE
ZIP-level market 16001
- Home prices YoY
- -31.7%
- Rents YoY
- 20.4%
- Active inventory
- 206
- Price-to-rent
- 11.9×
Monthly cashflow live
- Estimated rent
- $1,890 high interval (Pro) →
- Mortgage (P&I)
- −$708
- Tax est. 1.5%
- −$169 /mo · $2,025/yr
- Insurance
- −$56
- HOA
- −$0
- Vacancy / Maint / Mgmt
- −$397
- Net cashflow
- $560
Break-even live
2-unit breakdown (identical units grouped — click to expand)
| Units | Beds | Baths | Est. rent |
|---|---|---|---|
| 2× units | 2 | 1 | $1,890 |
| #1 | 2 | 1 | $945 |
| #2 | 2 | 1 | $945 |
| Total (2 units) | $1,890 | ||
UW: 25.0% down · 7.5% · 30yr · 1.5% tax · 5.0% vac · 8.0% maint · 8.0% mgmt
Financing live
Cash to close
- Down payment
- $33,750
- Closing costs
- $4,050
- Reserves months
- —
- Total cash needed
- —
Loan-product check · same deal, 3 products live
Conventional
25% down · 7.5% · 30yr
- Down + closing
- —
- Monthly P&I
- —
- Monthly cashflow
- —
- DSCR
- —
- Eligible?
- —
Personal DTI + credit; lowest rate.
DSCR
20% down · 8.5% · 30yr
- Down + closing
- —
- Monthly P&I
- —
- Monthly cashflow
- —
- DSCR
- —
- Eligible?
- —
No personal income docs; deal must DSCR.
Hard money
10% down · 12.0% · 12mo
- Down + closing
- —
- Monthly P&I
- —
- Monthly cashflow
- —
- DSCR
- —
- Eligible?
- —
Short-term bridge; refi at stabilization.
Rent comps 36 comps
| Address | Beds | Baths | Sqft | Rent | $/sqft | DOM | Units | Dist |
|---|---|---|---|---|---|---|---|---|
| 208 E Walnut St Butler, PA | 3.0 | 1.5 | 1297 | $1,050 | $0.81 | 23d | 1 | 0.19mi |
| 179 N Elm St Unit A Butler, PA | 1.0 | 1.0 | — | $750 | — | 43d | 1 | 0.19mi |
| 712 E Brady St Unit Rear Butler, PA | 1.0 | 1.0 | — | $950 | — | 43d | 1 | 0.24mi |
| 530 N Main St Butler, PA | 2.0 | 2.0 | 1052 | $1,088 | $1.03 | 1d | 2 | 0.34mi |
| 420 E Jefferson St Apt 2 Butler, PA | 2.0 | 1.0 | — | $715 | — | 23d | 1 | 0.35mi |
| 600 N Main St Butler, PA | 1.0 | 1.0 | 564 | $715 | $1.27 | 43d | 1 | 0.35mi |
| 600 N Main St Unit T 15 Butler, PA | 1.0 | 1.0 | 564 | $725 | $1.29 | 12d | 1 | 0.35mi |
| 315 N Washington St Unit 25 Butler, PA | 2.0 | 1.0 | — | $980 | — | 43d | 1 | 0.36mi |
| 1 Lumar Vlg Butler, PA | 2.0 | 1.0 | — | $799 | — | 1d | 1 | 0.37mi |
| 298 Lumar Dr Unit 1 Butler, PA | 2.0 | 1.0 | — | $950 | — | 23d | 1 | 0.37mi |
| 137 N Main St Unit D Butler, PA | 2.0 | 1.0 | — | $1,075 | — | 16d | 1 | 0.39mi |
| 455 E Jefferson St Butler, PA | 3.0 | 1.0 | — | $1,150 | — | 43d | 1 | 0.40mi |
| 120 S Washington St Unit A Butler, PA | 2.0 | 1.0 | — | $1,200 | — | 43d | 1 | 0.55mi |
| 327 W Brady St Unit 2 Butler, PA | 2.0 | 1.0 | 900 | $850 | $0.94 | 21d | 1 | 0.56mi |
| 331 W North St Butler, PA | 2.0 | 2.0 | — | $945 | — | 23d | 1 | 0.60mi |
| 125 N Chestnut St Unit 1/2 Butler, PA | 3.0 | 1.0 | — | $1,095 | — | 43d | 1 | 0.61mi |
| 313 Wilson Ave Butler, PA | 3.0 | 1.0 | 894 | $1,005 | $1.12 | 16d | 1 | 0.69mi |
| 404 W Cunningham St Butler, PA | 2.0 | 1.0 | 800 | $850 | $1.06 | 43d | 1 | 0.69mi |
| 303 Wilson Ave Unit Wilson-313 Butler, PA | 3.0 | 1.0 | 894 | $1,005 | $1.12 | 16d | 1 | 0.69mi |
| 115 Spring St #1 Butler, PA | 2.0 | 1.0 | 800 | $800 | $1.00 | 43d | 1 | 0.70mi |
| 529 Federal St Unit 2 Butler, PA | 2.0 | 1.0 | 900 | $850 | $0.94 | 43d | 1 | 0.72mi |
| 414 S Washington St Butler, PA | 3.0 | 1.0 | 3000 | $1,672 | $0.56 | 12d | 1 | 0.75mi |
| 404 Center Ave Butler, PA | 2.0 | 1.0 | — | $995 | — | 43d | 1 | 0.80mi |
| 404 Center Ave Unit 5 Butler, PA | 2.0 | 1.0 | — | $995 | — | 16d | 1 | 0.80mi |
| 400 W Wayne St Butler, PA | 2.0 | 1.0 | — | $950 | — | 7d | 1 | 0.82mi |
| 340 Virginia Ave Unit 3 Butler, PA | 3.0 | 1.0 | 3792 | $899 | $0.24 | 10d | 1 | 0.84mi |
| 113 Morton Ave Butler, PA | 2.0 | 1.0 | — | $995 | — | 43d | 1 | 0.92mi |
| 4th Ave Butler, PA | 2.0 | 1.0 | — | $950 | — | 43d | 1 | 0.93mi |
| 604 Center Ave Butler, PA | 2.0 | 1.0 | — | $1,200 | — | 43d | 1 | 0.94mi |
| 37 Hickory St Butler, PA | 2.0 | 1.0 | 760 | $800 | $1.05 | 4d | 1 | 0.94mi |
| 1 South St Unit BC-37 Butler, PA | 2.0 | 1.0 | 760 | $800 | $1.05 | 4d | 1 | 0.97mi |
| 415 Brown Ave Butler, PA | 3.0 | 2.5 | 1640 | $1,500 | $0.91 | 12d | 1 | 0.98mi |
| 715 New Castle St Butler, PA | 3.0 | 1.0 | — | $950 | — | 23d | 1 | 1.00mi |
| 305 American Ave Butler, PA | 2.0 | 1.0 | 986 | $995 | $1.01 | 43d | 1 | 1.08mi |
| 105 Chicora Rd Unit 57 Butler, PA | 1.0 | 1.0 | 450 | $750 | $1.67 | 16d | 1 | 1.09mi |
| 570 Kendall Ave Unit 575 Lyndora, PA | 3.0 | 1.0 | — | $1,250 | — | 43d | 1 | 1.38mi |
Listing history 17 events
-
2026-06-18days on market $135,000 Active 171 DOM
-
2026-06-17days on market $135,000 Active 170 DOM
-
2026-06-16days on market $135,000 Active 169 DOM
-
2026-06-15days on market $135,000 Active 168 DOM
-
2026-06-13days on market $135,000 Active 166 DOM
-
2026-06-13days on market $135,000 Active 165 DOM
-
2026-06-09days on market $135,000 Active 162 DOM
-
2026-06-08days on market $135,000 Active 161 DOM
-
2026-06-07days on market $135,000 Active 160 DOM
-
2026-06-03days on market $135,000 Active 156 DOM
-
2026-06-02days on market $135,000 Active 155 DOM
-
2026-06-01days on market $135,000 Active 154 DOM
-
2026-05-31days on market $135,000 Active 153 DOM
-
2026-03-18price $135,000 425-char remark
Show marketing remark (425 chars)
320 W. Birch St. is a fully occupied duplex located in Butler. The property is 100% occupied and consistently leased, generating $4800.00 in quarterly rental income, or $19,200.00 annually. With a strong and reliable income stream, the duplex produces an approximate Net Operating Income (NOI) of $16,957.46 per year. Its central location and stable tenancy make this a solid investment opportunity with dependable cash flow.
-
2025-12-28$150,000 Active 425-char remark
Show marketing remark (425 chars)
320 W. Birch St. is a fully occupied duplex located in Butler. The property is 100% occupied and consistently leased, generating $4800.00 in quarterly rental income, or $19,200.00 annually. With a strong and reliable income stream, the duplex produces an approximate Net Operating Income (NOI) of $16,957.46 per year. Its central location and stable tenancy make this a solid investment opportunity with dependable cash flow.
-
2004-03-31soldstatus $64,000 177-char remark
Show marketing remark (177 chars)
Tenant works 11pm-7am, pls b considerate :) utilities separate except sewer. New window & siding in 1993 & insulated at that time, Owner financing will be considered
-
2003-10-28$64,900 177-char remark
Show marketing remark (177 chars)
Tenant works 11pm-7am, pls b considerate :) utilities separate except sewer. New window & siding in 1993 & insulated at that time, Owner financing will be considered
ⓘ Source: listings_history table (triggers on properties + properties_extension) + one-shot
backfill from property_details.listing_events for pre-trigger history.
Climate risk First Street
- Flood 1/10 Low FEMA zone X (unshaded) · 0% chance over 30 yrs
- Wildfire 1/10 Low
- Heat 3/10 Moderate 7 d/yr ≥95°F today · 18 d/yr by 30 yrs out
- Wind 1/10 Low 0% chance of damaging wind over 30 yrs
- Air quality 3/10 Moderate 2 unhealthy d/yr today · 4 by 30 yrs out
Nearby sold comps map
Loading sold comps map…
Walkable amenities ~0.75 mi
Loading nearby amenities…
Taxation est. · year 1
- Rental income
- $22,680
- − Mortgage interest
- −$7,562
- − Property taxes
- −$2,025
- − Insurance
- −$675
- − Repairs & maintenance
- −$1,814
- − Management
- −$1,814
- − Depreciation
- −$3,927
- Taxable income
- $4,862
- Est. tax owed @ 24.0%
- −$1,167
- After-tax cash flow
- $5,555/yr
For passive investors: Depreciation is non-cash, so a rental often shows a tax loss while cash-flowing — sheltering income. Rental losses are passive: they offset passive income freely, and up to $25,000/yr can offset ordinary (W-2) income if you actively participate and your MAGI is under $100k (phasing out to $0 by $150k); unused losses carry forward. On sale, claimed depreciation is recaptured at up to 25%, and gains may owe capital-gains tax (a 1031 exchange can defer both). Figures are a year-1 estimate at your 24.0% rate — not tax advice; consult a CPA.
Condition & rehab AI · 1 photo
This multi-family property requires significant repairs and maintenance to restore it to a livable condition. Immediate attention to structural issues and aesthetics is crucial for both resale and rental value.
Repairs flagged
- Major Exposed framing and debris in the kitchen and bathroom — Structural damage
- Major Metal roof with visible damage — Structural damage
- Major Exposed flooring in the kitchen and bathroom — Structural damage
- Major Exposed walls and debris — Structural damage
- Major Exposed HVAC and mechanical components — Structural damage
- Major Overgrown and unkempt landscaping — Aesthetics
Value-add opportunities
- Both Painting the exterior and interior — Enhances curb appeal and interior aesthetics
- Both Landscaping and yard maintenance — Improves curb appeal and enhances property value
- Both Reframing and debris removal — Restores structural integrity and enhances safety
- Both Roof repair — Ensures structural integrity and protects against weather damage
- Both HVAC and mechanical repairs — Improves comfort and energy efficiency
Renovation cost estimate screening
| Repair item | Severity | Est. cost |
|---|---|---|
| Exposed framing and debris in the kitchen and bathroom · Structural damage | Major | $15,000–50,000 |
| Metal roof with visible damage · Structural damage | Major | $15,000–50,000 |
| Exposed flooring in the kitchen and bathroom · Structural damage | Major | $15,000–50,000 |
| Exposed walls and debris · Structural damage | Major | $15,000–50,000 |
| Exposed HVAC and mechanical components · Structural damage | Major | $15,000–50,000 |
| Overgrown and unkempt landscaping · Aesthetics | Major | $15,000–50,000 |
| Total estimated repair cost · 6 items | $90,000–300,000 |
Value-add ROI direction
- Both Painting the exterior and interior — Enhances curb appeal and interior aesthetics ↑
- Both Landscaping and yard maintenance — Improves curb appeal and enhances property value ↑
- Both Reframing and debris removal — Restores structural integrity and enhances safety ↑
- Both Roof repair — Ensures structural integrity and protects against weather damage ↑
- Both HVAC and mechanical repairs — Improves comfort and energy efficiency ↑
ⓘ Cost ranges are severity-bucket heuristics (US national rule-of-thumb). Get contractor quotes + a written scope before underwriting a rehab budget.
Schools (NCES district)
- District
- Butler Area SD
- NCES district ID
- 4204590
- Math proficiency
- 41% ▼ -11.00%
- Reading proficiency
- 59% ▼ -10.00%
- Median HH income
- $49,348
- Composite
- 42.65/100
- National rank
- #3180
- State rank
- #181 of 539 in PA
Livability — Butler
- Score
- 71/100
- State rank
- #705
- US rank
- #6951
Category grades
Schools grade is shown separately in the Schools card above.
Census & demographics
- Census place
- Butler, PA
- County
- Butler County · 73,107 people
- City population
- 39,234
- Metro
- Pittsburgh, PA
- Population (ZIP)
- 39,234
- Household income
- $63,635
- Rent vs Own
- Severe rent burden
- 1441.0
Population outlook (Butler County) Hauer SSP2
- Today (2025)
- 190,777 people
- By 2030
- 191,476 · +0.4%
- By 2040
- 189,474 · -0.7%
- By 2050
- 182,050 · -4.6%
- By 2075
- 159,526 · -16.4%
- By 2100
- 129,028 · -32.4%
Race, ethnicity, and origin ACS 2023
- Neighborhood character
- Predominantly White (92%)
- Race & ethnicity
- White 92% Two or more races 4% Hispanic / Latino 2% Black 1%
- Common ancestry
- Romanian 8% Serbian 4% Slovak 2%
- Foreign-born
- 1% · Canada
- Languages at home
- 98% English-only · Spanish 1%
Political lean MEDSL · Butler
- 2024 margin
- Solid R (+32.2) · D 33.5% · R 65.7%
- 2008→2024 swing
- -4.8pp toward R · 2008: -27.4pp · 2024: -32.2pp
- All cycles
- 2024: R+32.2 2020: R+32.5 2016: R+37.5 2012: R+34.9 2008: R+27.4
Not yet ingested
- Civics
- —
Market trends
- HPI YoY
- ▼ -103.40%
- Current HPI
- 222.4445
- Rent YoY
- ▲ 20.36%
- Metro
- Pittsburgh, PA
- State GDP YoY
- ▲ 1.68%
- F500 in state
- 34
Industry mix (Fortune 500 HQ in PA)
| Industry | F500 HQs | Revenue |
|---|---|---|
| Healthcare | 2 | $309B |
|
||
| Insurance | 2 | $27B |
|
||
| Telecommunications / Media | 1 | $124B |
|
||
| Industrial Distribution | 1 | $22B |
|
||
| Financial Services | 1 | $20B |
|
||
| Chemicals / Materials | 1 | $18B |
|
||
Price history
+108.0% since first listed4 events — show timeline
- 2026-03-18 Price Changed $135,000 West Penn MLS
- 2025-12-28 Listed $150,000 West Penn MLS
- 2004-03-31 Sold (MLS) $64,000 West Penn MLS
- 2003-10-28 Listed $64,900 West Penn MLS
Cash-flow waterfall
monthlySold comps — $/sqft
last 12 mo · ≤1 miLoading sold comps…