 🏷️ Likely Rental
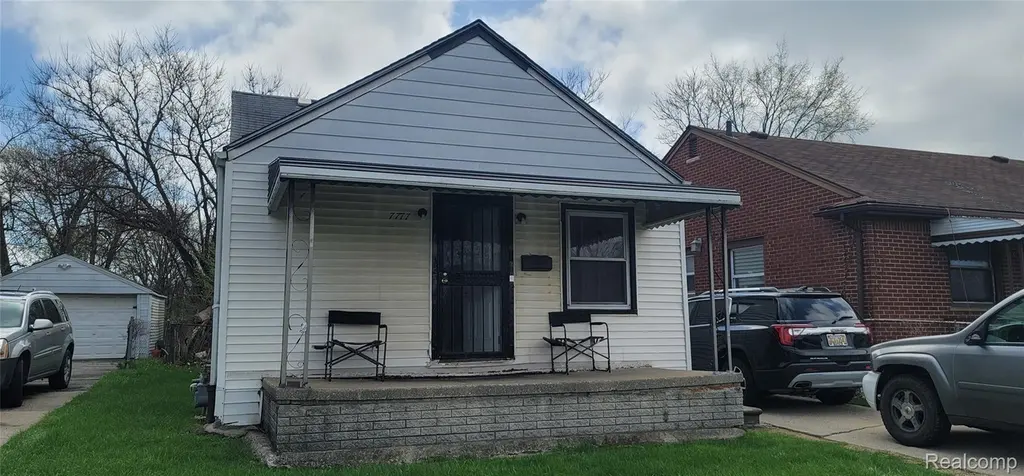
7777 W Outer Dr · Detroit, MI
Flood risk 1/10 · Minimal
- FEMA flood zone
- X (unshaded)
- Chance of flooding over 30 yrs
- 0.0%
- Est. flood insurance / yr
- $507 – $1,088
Fire risk 1/10 · Minimal
- Est. fire insurance / yr
- $784 – $1,456
Heat risk 3/10 · Minor
- Hot days now (above 98°F)
- 7 days/yr
- Hot days in 30 yrs
- 15 days/yr
Wind risk 2/10 · Minimal
- Chance of severe wind over 30 yrs
- —
Air-quality risk 3/10 · Minor
- Unhealthy air days now
- 2 days/yr
- Unhealthy air days in 30 yrs
- 5 days/yr
Risk factors via First Street. Map © Google.
Why this score? — see what drove the D grade
The composite is a weighted blend of 9 inputs, each scored 0–100. Each bar is that input's sub-score; the figure is the points it added to the 100-point composite (weight × sub-score).
- Cash flow +15.0/30.0
- ARV discount +7.5/15.0
- 1% rule +5.0/10.0
- DSCR +5.0/10.0
- Livability +3.7/5.0
- Rent growth +3.3/5.0
- Condition / age +2.5/5.0
- Schools +1.3/10.0
- Appreciation +0.0/10.0
$35,000
🖨 Deal sheet (PDF) 📄 Offer letter ✓ Due diligence
Listing remarks MLS
NICE 4 BEDROOM HOME. CURRENTLY OCCUPIED. HOME NEEDS SOME TLC. MAY BE NICE FOR A FIX AND FLIP. THE GARAGE MAY NEED TO BE TORN DOWN. THE TENANT IS NOT ALLOWING SHOWINGS. EXTERIOR VIEWINGS ONLY. MEASUREMENTS AND INFO ARE ESTIMATED. BATVAI. SELLER WILL LOOK AT ALL RESONABLE OFFERS. PEOBATE PROPERTY. COURT APPROVAL NEEDED AND MAY TAKE UP TO 60 DAYS. NON REFUNDABLE EMD OF 1K FOR 60 DAYS. BUYER MUST BE WILLING TO WAIT AT LEAST 60 DAYS. SELLER MAY NOT BE ABLE TO GET A FINAL WATER READ FOR OWNER ACCOUNT WHICH IS INACTIVE, WITH NO BALANCE PER THE WATER DEPT. HOWEVER, THE CURRENT ACTIVE WATER ACCOUNT IS THE TENANTS ACCOUNT.
Key facts
- 3,920 sq ft lot
- 2 garage spots
- Built 1952
Property features AI
Exterior
- Parking: Detached 2-car garage
- Utilities: Water available; Sewer available
- Home design: Single-family residence; Two-story with ground-level entry and steps
- Construction: Aluminum siding; Above-grade finished area reported
- Exterior features: Paved road access; Lot approximately 0.09 acres (33.61 x 111.83)
Interior
- Bathrooms: 1 full bathroom
- Heating & cooling: Forced air heating (natural gas); No central cooling
- Interior features: Crawl space basement; Total of 8 rooms
Neighborhood map
What this means for you Summary
Snapshot
- This is a 4-bed/1.0-bath single-family listed at $35k.
Deal economics
- At list price, monthly cash flow is $997 ($12k/yr) — positive.
- The deal already cash-flows at list — no discount required.
- Meets the 1% rule at list price ($2k rent vs $35k).
- Recommended offer: $34k (3.0% below list) — sets the bar for market timing.
- Cap rate 40.5% vs local median 10.0% in Detroit — top-decile yield for the area; either an underpriced asset or a hidden risk that comps aren't pricing in. Stress-test before assuming the spread holds.
Location & tenants
- Location reads 73/100 on livability (#218 in MI) — a middle-class / working-renter tenant base. Strengths: amenities A+, commute A+, cost of living A+; Watch: schools F, crime F, employment F.
- Detroit Public Schools Community District (urban): math 10% / reading 24% proficiency, ranked #499 of 540 in MI (top 92%) — low school quality limits family demand, transient renter base, plan for 1-2y turnover; 90% free/reduced lunch — lower-income household profile, screen leases tightly.
- Market conditions: Rents rising (+3.2%/yr); 291 active listings in the ZIP; 40 comparable units currently listed for rent nearby; rentals at typical pace (median 19d on market — plan ~3-4 weeks tenant-placement turnaround); lower-income renter base — watch delinquency; 2,639 units permitted in Wayne County in 2024 (1,216 in 5+ unit buildings).
- At $1,568/mo this rent would consume 48% of the median local household income ($39k/yr) (locally 3064% of renters already pay >50% of income on rent) — very limited rent-growth headroom before tenants either downsize or default.
Forward outlook
- Local home prices are declining (-3.0%/yr); year-one equity from $242 of loan paydown is wiped out by about $1k of value loss. Plan a longer hold.
- Wayne County population projected at -17% by 2050 — secular population decline; favor cash flow + early exit over multi-decade hold.
- At projected returns (-3.0% appreciation + 3.2% rent growth), your $10k cash investment doubles in ~1 year — after that, you're playing with house money.
Negotiation context
- It's been on market 52 days — a 3% lower offer ($34k) is reasonable based on typical stale-listing flexibility.
- 4 sale attempts; this cycle's ask has dropped $10k (22%) from the opening price — seller is motivated, your offer sets the floor, not the list.
Risks & watch-outs
- Watch-outs: built in 1952 — expect roof / HVAC / electrical / plumbing capex.
Questions for the listing agent
- It's been on market 52 days. Have you received any prior offers? Is the seller open to a 3% concession, seller financing, or rate buy-down credit?
- Built in 1952 — when were the roof, HVAC, electrical panel, plumbing, and water heater last replaced?
- Is there a deadline driving the sale (1031 exchange, divorce, estate, relocation)? That informs how much negotiation room exists.
- Schools are F-rated, which usually means shorter tenancies and higher turnover. Who's the typical renter profile here, and what's been the actual vacancy rate?
- Crime grade is F in this area — have there been break-ins, vandalism, or insurance claims at this property in the last 3 years? What carrier currently insures it and at what premium?
- The area grade is low — what's the realistic commute time and amenity access for the typical tenant pool here? Any planned neighborhood developments (good or bad) we should know about?
- What's the average days-on-market for RENTAL listings here right now (not sales)? A rising rental-DOM trend means longer vacancies and softer asking-rent achievability than the comps imply.
- What's the recent tenant-quality profile in this submarket — average credit score on applications, eviction rate, late-payment / NSF rate, and stable-employment percentage? A property-management company in the area should have these aggregated.
- How much new for-sale + rental construction is in the pipeline within 1–3 miles? Heavy new supply typically softens prices + rents 12–24 months out; constrained supply supports both.
Investment metrics
- 1% rule
- 4.48% ✓
- Cap rate
- 40.48%
- Cash-on-cash
- 122.08%
- DSCR
- 6.43
- GRM
- 1.9
CMA / ARV
- ARV (median comp)
- $109,497
- List price
- $35,000
- Delta
- -68.04%
- Verdict
- UNDERPRICED
- Comps
- 20 within 1.0 mi
Show comp detail 12 sales within ~0.75 mi
| Address | Dist | Beds/Ba | Sqft | Sold | Price | $/sf | Match |
|---|---|---|---|---|---|---|---|
| 16818 Gilchrist St | 0.34mi | 3/1.0 (-1) | 1,190 (+1%) | 3mo | $83,000 | $70 | 74 |
| 17540 Asbury Park St | 0.27mi | 3/1.0 (-1) | 1,100 (-6%) | 4mo | $57,500 | $52 | 68 |
| 18239 Saint Marys St | 0.47mi | 3/1.0 (-1) | 1,136 (-4%) | 1mo | $124,900 | $110 | 66 |
| 18217 Archdale St | 0.33mi | 3/1.0 (-1) | 1,085 (-8%) | 0mo | $82,000 | $76 | 66 |
| 16709 Lindsay St | 0.46mi | 3/1.0 (-1) | 1,218 (+4%) | 2mo | $124,888 | $103 | 66 |
| 18505 Ashton Ave | 0.62mi | 4/1.5 | 1,200 (+2%) | 0mo | $75,000 | $63 | 66 |
| 16199 Ferguson St | 0.65mi | 3/1.0 (-1) | 1,192 (+1%) | 4mo | $85,000 | $71 | 59 |
| 16727 Mansfield St | 0.59mi | 3/1.5 (-1) | 1,207 (+2%) | 3mo | $165,000 | $137 | 59 |
| 17355 Saint Marys St | 0.34mi | 3/1.0 (-1) | 1,000 (-15%) | 5mo | $55,000 | $55 | 50 |
| 18477 Prevost St | 0.70mi | 3/2.0 (-1) | 1,234 (+5%) | 2mo | $163,695 | $133 | 49 |
| 18926 Ashton Ave | 0.71mi | 3/1.0 (-1) | 1,095 (-7%) | 3mo | $125,000 | $114 | 48 |
| 18423 Ashton Ave | 0.55mi | 3/2.5 (-1) | 1,350 (+15%) | 0mo | $199,900 | $148 | 38 |
Match score weights: distance 35% · size 25% · config 20% · recency 20%. Top-matched comps best support the ARV.
Projected returns pro-forma
-3.0% appreciation · 3.25% rent growth · sell at horizon
- IRR
- —
- Equity multiple
- 6.94×
- Total profit
- $58,248
- Equity at exit
- $5,219
- IRR
- —
- Equity multiple
- 14.70×
- Total profit
- $134,215
- Equity at exit
- $3,026
Cash invested: $9,800 (down + closing). Projections, not guarantees.
Landlord ↔ Tenant lean methodology
- Overall (STATE)
- 62 Landlord-Friendly
- State Michigan
- 62 Landlord-Friendly · EVEN
- County
- — inherits STATE
- City
- — inherits STATE
ZIP-level market 48235
- Rents YoY
- 3.2%
- Active inventory
- 291
- Price-to-rent
- 1.9×
Monthly cashflow live
- Estimated rent
- $1,568 high interval (Pro) →
- Mortgage (P&I)
- −$184
- Tax est. 1.5%
- −$44 /mo · $525/yr
- Insurance
- −$15
- HOA
- −$0
- Vacancy / Maint / Mgmt
- −$329
- Net cashflow
- $997
Break-even live
Sensitivity live
| Price | -10% $1,021 | -5% $1,009 | +0% $997 | +5% $985 | +10% $973 |
|---|---|---|---|---|---|
| Rent | -10% $873 | -5% $935 | +0% $997 | +5% $1,059 | +10% $1,121 |
| Rate | -1.0pp $1,015 | -0.5pp $1,006 | base $997 | +0.5pp $988 | +1.0pp $979 |
UW: 25.0% down · 7.5% · 30yr · 1.5% tax · 5.0% vac · 8.0% maint · 8.0% mgmt
Financing live
Cash to close
- Down payment
- $8,750
- Closing costs
- $1,050
- Reserves months
- —
- Total cash needed
- —
Loan-product check · same deal, 3 products live
Conventional
25% down · 7.5% · 30yr
- Down + closing
- —
- Monthly P&I
- —
- Monthly cashflow
- —
- DSCR
- —
- Eligible?
- —
Personal DTI + credit; lowest rate.
DSCR
20% down · 8.5% · 30yr
- Down + closing
- —
- Monthly P&I
- —
- Monthly cashflow
- —
- DSCR
- —
- Eligible?
- —
No personal income docs; deal must DSCR.
Hard money
10% down · 12.0% · 12mo
- Down + closing
- —
- Monthly P&I
- —
- Monthly cashflow
- —
- DSCR
- —
- Eligible?
- —
Short-term bridge; refi at stabilization.
Rent comps 40 comps
| Address | Beds | Baths | Sqft | Rent | $/sqft | DOM | Units | Dist |
|---|---|---|---|---|---|---|---|---|
| 17573 Asbury Park Detroit, MI | 3.0 | 2.0 | 990 | $1,400 | $1.41 | 0d | 1 | 0.26mi |
| 16876 Harlow Ave Unit (NO) Detroit, MI | 3.0 | 1.0 | 1250 | $1,350 | $1.08 | 45d | 1 | 0.29mi |
| 17165 Prevost St Detroit, MI | 3.0 | 1.0 | 1060 | $2,400 | $2.26 | 3d | 1 | 0.54mi |
| 17654 Greenview Ave Detroit, MI | 4.0 | 1.0 | 1377 | $1,350 | $0.98 | 18d | 1 | 0.57mi |
| 18494 Ashton Ave Detroit, MI | 3.0 | 1.0 | 1000 | $1,600 | $1.60 | 18d | 1 | 0.59mi |
| 16535 Asbury Park Detroit, MI | 3.0 | 1.5 | 1152 | $1,450 | $1.26 | 26d | 1 | 0.61mi |
| 18400 Rutherford St Detroit, MI | 3.0 | 1.0 | 1050 | $1,400 | $1.33 | 5d | 1 | 0.63mi |
| 16210 Ferguson St Detroit, MI | 4.0 | 2.0 | 1493 | $1,750 | $1.17 | 5d | 1 | 0.66mi |
| 16837 Winthrop St Detroit, MI | 5.0 | 2.0 | 1500 | $2,000 | $1.33 | 21d | 1 | 0.73mi |
| 17654 Sunderland Rd Detroit, MI | 3.0 | 1.0 | 1100 | $1,500 | $1.36 | 45d | 1 | 0.73mi |
| 16823 Stahelin Ave Detroit, MI | 3.0 | 2.5 | 1500 | $1,600 | $1.07 | 19d | 1 | 0.74mi |
| 18675 Forrer St Detroit, MI | 3.0 | 1.0 | 1200 | $1,225 | $1.02 | 6d | 1 | 0.83mi |
| 17238 Shaftsbury Ave Detroit, MI | 3.0 | 1.0 | 1200 | $1,550 | $1.29 | 45d | 1 | 0.83mi |
| 15866 Mansfield St Detroit, MI | 3.0 | 1.0 | 1324 | $1,425 | $1.08 | 26d | 1 | 0.89mi |
| 18481 Prest St Detroit, MI | 3.0 | 1.5 | 1100 | $1,300 | $1.18 | 21d | 1 | 0.92mi |
| 15736 Biltmore St Detroit, MI | 3.0 | 1.5 | 1000 | $1,200 | $1.20 | 18d | 1 | 0.95mi |
| 18452 Shaftsbury Ave Detroit, MI | 3.0 | 1.0 | 927 | $1,500 | $1.62 | 18d | 1 | 0.96mi |
| 19400 Harlow St Detroit, MI | 4.0 | 1.0 | 1298 | $1,275 | $0.98 | 18d | 1 | 1.03mi |
| 15752 Rutherford St Detroit, MI | 3.0 | 2.0 | 1174 | $1,386 | $1.18 | 6d | 1 | 1.04mi |
| 18659 Shaftsbury Ave Detroit, MI | 3.0 | 1.0 | 763 | $1,323 | $1.73 | 0d | 1 | 1.06mi |
| 18450 Edinborough Rd Detroit, MI | 3.0 | 1.0 | 1000 | $1,500 | $1.50 | 45d | 1 | 1.12mi |
| 19440 Rutherford St Detroit, MI | 3.0 | 1.0 | 1000 | $1,400 | $1.40 | 26d | 1 | 1.17mi |
| 19329 Stahelin Ave Unit 1 Detroit, MI | 3.0 | 1.5 | 833 | $1,250 | $1.50 | 45d | 1 | 1.17mi |
| 19467 Rutherford St Detroit, MI | 3.0 | 1.0 | 1002 | $1,200 | $1.20 | 18d | 1 | 1.18mi |
| 19503 Mansfield St Detroit, MI | 3.0 | 1.0 | 1200 | $1,350 | $1.12 | 18d | 1 | 1.19mi |
| 15375 Prevost St Detroit, MI | 4.0 | 1.0 | 907 | $1,300 | $1.43 | 18d | 1 | 1.23mi |
| 19176 Grandville Ave Detroit, MI | 3.0 | 1.0 | 941 | $1,300 | $1.38 | 6d | 1 | 1.23mi |
| 15332 Saint Marys St Detroit, MI | 3.0 | 1.0 | 1200 | $1,200 | $1.00 | 18d | 1 | 1.23mi |
| 18964 Coyle St Detroit, MI | 3.0 | 1.0 | 1300 | $1,350 | $1.04 | 4d | 1 | 1.23mi |
| 16151 Robson St Detroit, MI | 3.0 | 1.0 | 1300 | $1,525 | $1.17 | 16d | 1 | 1.24mi |
| 15065 Gilchrist St Detroit, MI | 3.0 | 1.0 | 1100 | $1,250 | $1.14 | 45d | 1 | 1.24mi |
| 19445 Avon Ave Detroit, MI | 3.0 | 1.0 | 1023 | $1,550 | $1.52 | 45d | 1 | 1.24mi |
| 19818 Fenmore St Detroit, MI | 3.0 | 1.0 | 902 | $1,275 | $1.41 | 45d | 1 | 1.27mi |
| 18134 Vaughan St Detroit, MI | 3.0 | 1.0 | 1060 | $1,150 | $1.08 | 18d | 1 | 1.31mi |
| 19918 Southfield Fwy Detroit, MI | 3.0 | 1.0 | 915 | $1,375 | $1.50 | 16d | 1 | 1.32mi |
| 15810 Robson St Detroit, MI | 3.0 | 1.0 | 1142 | $1,500 | $1.31 | 26d | 1 | 1.36mi |
| 15829 Minock St Detroit, MI | 3.0 | 1.5 | 1200 | $1,550 | $1.29 | 26d | 1 | 1.36mi |
| 18257 Mark Twain St Detroit, MI | 3.0 | 1.0 | 1185 | $1,507 | $1.27 | 18d | 1 | 1.40mi |
| 19970 Ashton Ave Detroit, MI | 3.0 | 1.0 | 1000 | $1,000 | $1.00 | 45d | 1 | 1.41mi |
| 20043 Fenmore St Detroit, MI | 3.0 | 1.0 | 1030 | $1,423 | $1.38 | 0d | 1 | 1.45mi |
Listing history 19 events
-
2026-06-21statusdays on market $35,000 Pending 52 DOM
-
2026-06-18days on market $35,000 Active 50 DOM
-
2026-06-17days on market $35,000 Active 49 DOM
-
2026-06-15remarks 620-char remark
-
2026-06-15pricedays on market $35,000 Active 47 DOM
-
2026-06-13days on market $40,000 Active 45 DOM
Show marketing remark (620 chars)
NICE 4 BEDROOM HOME. CURRENTLY OCCUPIED. HOME NEEDS SOME TLC. MAY BE NICE FOR A FIX AND FLIP. THE GARAGE MAY NEED TO BE TORN DOWN. THE TENANT IS NOT ALLOWING SHOWINGS. EXTERIOR VIEWINGS ONLY. MEASUREMENTS AND INFO ARE ESTIMATED. BATVAI. SELLER WILL LOOK AT ALL RESONABLE OFFERS. PEOBATE PROPERTY. COURT APPROVAL NEEDED AND MAY TAKE UP TO 60 DAYS. NON REFUNDABLE EMD OF 1K FOR 60 DAYS. BUYER MUST BE WILLING TO WAIT AT LEAST 60 DAYS. SELLER MAY NOT BE ABLE TO GET A FINAL WATER READ FOR OWNER ACCOUNT WHICH IS INACTIVE, WITH NO BALANCE PER THE WATER DEPT. HOWEVER, THE CURRENT ACTIVE WATER ACCOUNT IS THE TENANTS ACCOUNT.
-
2026-06-13days on market $40,000 Active 44 DOM
Show marketing remark (620 chars)
NICE 4 BEDROOM HOME. CURRENTLY OCCUPIED. HOME NEEDS SOME TLC. MAY BE NICE FOR A FIX AND FLIP. THE GARAGE MAY NEED TO BE TORN DOWN. THE TENANT IS NOT ALLOWING SHOWINGS. EXTERIOR VIEWINGS ONLY. MEASUREMENTS AND INFO ARE ESTIMATED. BATVAI. SELLER WILL LOOK AT ALL RESONABLE OFFERS. PEOBATE PROPERTY. COURT APPROVAL NEEDED AND MAY TAKE UP TO 60 DAYS. NON REFUNDABLE EMD OF 1K FOR 60 DAYS. BUYER MUST BE WILLING TO WAIT AT LEAST 60 DAYS. SELLER MAY NOT BE ABLE TO GET A FINAL WATER READ FOR OWNER ACCOUNT WHICH IS INACTIVE, WITH NO BALANCE PER THE WATER DEPT. HOWEVER, THE CURRENT ACTIVE WATER ACCOUNT IS THE TENANTS ACCOUNT.
-
2026-06-09days on market $40,000 Active 41 DOM
-
2026-06-08days on market $40,000 Active 40 DOM
-
2026-06-07days on market $40,000 Active 39 DOM
-
2026-06-04days on market $40,000 Active 36 DOM
-
2026-06-03days on market $40,000 Active 35 DOM
-
2026-06-02days on market $40,000 Active 34 DOM
-
2026-06-01days on market $40,000 Active 33 DOM
-
2026-05-31days on market $40,000 Active 32 DOM
-
2026-05-13price $40,000 307-char remark
Show marketing remark (620 chars)
NICE 4 BEDROOM HOME. CURRENTLY OCCUPIED. HOME NEEDS SOME TLC. MAY BE NICE FOR A FIX AND FLIP. THE GARAGE MAY NEED TO BE TORN DOWN. THE TENANT IS NOT ALLOWING SHOWINGS. EXTERIOR VIEWINGS ONLY. MEASUREMENTS AND INFO ARE ESTIMATED. BATVAI. SELLER WILL LOOK AT ALL RESONABLE OFFERS. PEOBATE PROPERTY. COURT APPROVAL NEEDED AND MAY TAKE UP TO 60 DAYS. NON REFUNDABLE EMD OF 1K FOR 60 DAYS. BUYER MUST BE WILLING TO WAIT AT LEAST 60 DAYS. SELLER MAY NOT BE ABLE TO GET A FINAL WATER READ FOR OWNER ACCOUNT WHICH IS INACTIVE, WITH NO BALANCE PER THE WATER DEPT. HOWEVER, THE CURRENT ACTIVE WATER ACCOUNT IS THE TENANTS ACCOUNT.
-
2026-05-12price $40,000 307-char remark
-
2026-04-27$45,000 Active 307-char remark
Show marketing remark (620 chars)
NICE 4 BEDROOM HOME. CURRENTLY OCCUPIED. HOME NEEDS SOME TLC. MAY BE NICE FOR A FIX AND FLIP. THE GARAGE MAY NEED TO BE TORN DOWN. THE TENANT IS NOT ALLOWING SHOWINGS. EXTERIOR VIEWINGS ONLY. MEASUREMENTS AND INFO ARE ESTIMATED. BATVAI. SELLER WILL LOOK AT ALL RESONABLE OFFERS. PEOBATE PROPERTY. COURT APPROVAL NEEDED AND MAY TAKE UP TO 60 DAYS. NON REFUNDABLE EMD OF 1K FOR 60 DAYS. BUYER MUST BE WILLING TO WAIT AT LEAST 60 DAYS. SELLER MAY NOT BE ABLE TO GET A FINAL WATER READ FOR OWNER ACCOUNT WHICH IS INACTIVE, WITH NO BALANCE PER THE WATER DEPT. HOWEVER, THE CURRENT ACTIVE WATER ACCOUNT IS THE TENANTS ACCOUNT.
-
2026-04-27$45,000 Active 307-char remark
Show marketing remark (620 chars)
NICE 4 BEDROOM HOME. CURRENTLY OCCUPIED. HOME NEEDS SOME TLC. MAY BE NICE FOR A FIX AND FLIP. THE GARAGE MAY NEED TO BE TORN DOWN. THE TENANT IS NOT ALLOWING SHOWINGS. EXTERIOR VIEWINGS ONLY. MEASUREMENTS AND INFO ARE ESTIMATED. BATVAI. SELLER WILL LOOK AT ALL RESONABLE OFFERS. PEOBATE PROPERTY. COURT APPROVAL NEEDED AND MAY TAKE UP TO 60 DAYS. NON REFUNDABLE EMD OF 1K FOR 60 DAYS. BUYER MUST BE WILLING TO WAIT AT LEAST 60 DAYS. SELLER MAY NOT BE ABLE TO GET A FINAL WATER READ FOR OWNER ACCOUNT WHICH IS INACTIVE, WITH NO BALANCE PER THE WATER DEPT. HOWEVER, THE CURRENT ACTIVE WATER ACCOUNT IS THE TENANTS ACCOUNT.
ⓘ Source: listings_history table (triggers on properties + properties_extension) + one-shot
backfill from property_details.listing_events for pre-trigger history.
Climate risk First Street
- Flood 1/10 Low FEMA zone X (unshaded) · 0% chance over 30 yrs
- Wildfire 1/10 Low
- Heat 3/10 Moderate 7 d/yr ≥98°F today · 15 d/yr by 30 yrs out
- Wind 2/10 Low
- Air quality 3/10 Moderate 2 unhealthy d/yr today · 5 by 30 yrs out
Nearby sold comps map
Loading sold comps map…
Walkable amenities ~0.75 mi
Loading nearby amenities…
Taxation est. · year 1
- Rental income
- $18,819
- − Mortgage interest
- −$1,961
- − Property taxes
- −$525
- − Insurance
- −$175
- − Repairs & maintenance
- −$1,505
- − Management
- −$1,505
- − Depreciation
- −$1,018
- Taxable income
- $12,129
- Est. tax owed @ 24.0%
- −$2,911
- After-tax cash flow
- $9,053/yr
For passive investors: Depreciation is non-cash, so a rental often shows a tax loss while cash-flowing — sheltering income. Rental losses are passive: they offset passive income freely, and up to $25,000/yr can offset ordinary (W-2) income if you actively participate and your MAGI is under $100k (phasing out to $0 by $150k); unused losses carry forward. On sale, claimed depreciation is recaptured at up to 25%, and gains may owe capital-gains tax (a 1031 exchange can defer both). Figures are a year-1 estimate at your 24.0% rate — not tax advice; consult a CPA.
Schools (NCES district)
- District
- Detroit Public Schools Community District
- NCES district ID
- 2601103
- Math proficiency
- 10% ▼ -2.00%
- Reading proficiency
- 24% ▲ 6.00%
- Median HH income
- $25,815
- Composite
- 13.06/100
- National rank
- #9564
- State rank
- #499 of 540 in MI
Livability — Detroit
- Score
- 73/100
- State rank
- #218
- US rank
- #5427
Category grades
Schools grade is shown separately in the Schools card above.
Census & demographics
- Census place
- Detroit, MI
- County
- Wayne County · 1,562,939 people
- City population
- 572,865
- Metro
- Detroit-Warren-Dearborn, MI
- Population (ZIP)
- 45,600
- Household income
- $39,265
- Rent vs Own
- Severe rent burden
- 3064.0
Population outlook (Wayne County) Hauer SSP2
- Today (2025)
- 1,675,273 people
- By 2030
- 1,620,300 · -3.3%
- By 2040
- 1,502,341 · -10.3%
- By 2050
- 1,384,039 · -17.4%
- By 2075
- 1,124,592 · -32.9%
- By 2100
- 881,193 · -47.4%
Race, ethnicity, and origin ACS 2023
- Neighborhood character
- Predominantly Black (94%)
- Race & ethnicity
- Black 94% White 3% Two or more races 2% Hispanic / Latino 1%
- Foreign-born
- 1% · Canada
- Languages at home
- 98% English-only · Spanish 1%
Political lean MEDSL · Wayne
- 2024 margin
- Strong D (+29.0) · D 62.7% · R 33.7% · Other 3.6%
- 2008→2024 swing
- -20.5pp toward R · 2008: 49.5pp · 2024: 29.0pp
- All cycles
- 2024: D+29.0 2020: D+38.1 2016: D+37.3 2012: D+46.9 2008: D+49.5
Not yet ingested
- Civics
- —
Market trends
- HPI YoY
- ▼ -153.02%
- Current HPI
- 263.6326
- Rent YoY
- ▲ 3.25%
- Metro
- Detroit-Warren-Dearborn, MI
- State GDP YoY
- ▲ 1.37%
- F500 in state
- 28
Industry mix (Fortune 500 HQ in MI)
| Industry | F500 HQs | Revenue |
|---|---|---|
| Automotive Parts | 3 | $48B |
|
||
| Automotive | 2 | $372B |
|
||
| Chemicals | 1 | $45B |
|
||
| Automotive Retail | 1 | $29B |
|
||
| Healthcare / Medical Devices | 1 | $23B |
|
||
| Automotive Technology | 1 | $20B |
|
||
Price history
-22.2% since first listed10 events — show timeline
- 2026-06-14 Price Changed $35,000 REALCOMP
- 2026-06-13 Price Changed $35,000 MiRealSource-MiMLS
- 2026-05-23 Relisted — REALCOMP
- 2026-05-23 Relisted — MiRealSource-MiMLS
- 2026-05-21 Pending — REALCOMP
- 2026-05-21 Pending — MiRealSource-MiMLS
- 2026-05-13 Price Changed $40,000 MiRealSource-MiMLS
- 2026-05-12 Price Changed $40,000 REALCOMP
- 2026-04-27 Listed $45,000 REALCOMP
- 2026-04-27 Listed $45,000 MiRealSource-MiMLS
Property tax history
+2.6%/yrLatest (2025): $2,261 · +1.0% YoY. Source: county tax records.
Cash-flow waterfall
monthlySold comps — $/sqft
last 12 mo · ≤1 miLoading sold comps…