 🏗️ New Construction
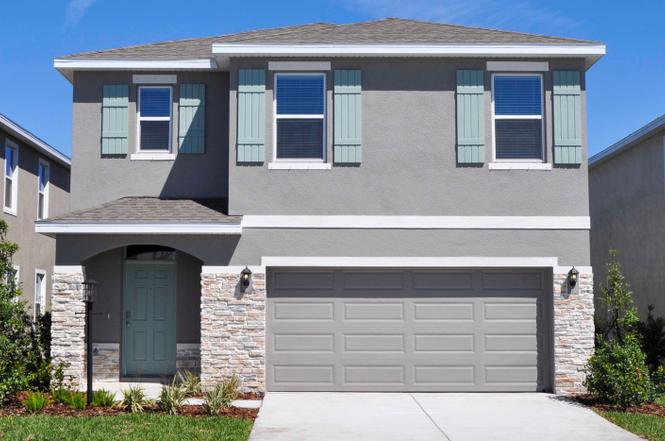
Robie Plan · Ruskin, FL
Flood risk No data
- FEMA flood zone
- —
- Chance of flooding over 30 yrs
- —
- Est. flood insurance / yr
- —
Fire risk No data
- Est. fire insurance / yr
- —
Heat risk No data
- Hot days now (above threshold)
- —
- Hot days in 30 yrs
- —
Wind risk No data
- Chance of severe wind over 30 yrs
- —
Air-quality risk No data
- Unhealthy air days now
- —
- Unhealthy air days in 30 yrs
- —
Risk factors via First Street. Map © Google.
Why this score? — see what drove the F grade
The composite is a weighted blend of 9 inputs, each scored 0–100. Each bar is that input's sub-score; the figure is the points it added to the 100-point composite (weight × sub-score).
- ARV discount +7.5/15.0
- Cash flow +7.4/30.0
- Schools +4.4/10.0
- Livability +3.6/5.0
- Condition / age +2.5/5.0
- Rent growth +2.3/5.0
- 1% rule +2.1/10.0
- DSCR +1.5/10.0
- Appreciation +0.0/10.0
$378,990
🖨 Deal sheet 📄 Offer letter ✓ Due diligence
Listing remarks
This all-concrete block constructed, two-story, two-car garage plan has a large open-concept downstairs which includes a well-appointed kitchen, living room, dining area, secondary bedroom, and full bath. Upstairs, the oversized Bedroom 1 can easily fit a king size bed and includes a large walk-in closet as well as Bathroom 1 with double vanity. Three other bedrooms share a second upstairs bathroom while the loft provides an extra area for work or play. This home comes with refrigerator, built-in dishwasher, electric range, and microwave as well as washer and dryer.
Key facts
- Double vanity
- Large walk-in closet
- 2 garage spots
Tags
Property features AI
Finance
- Financial info: List price $378,990
Exterior
- Parking: 2 total parking spaces; 2-car garage
- Home design: New construction plan named Robie
- Exterior features: Living area approximately 2,447
Interior
- Bedrooms: 5 bedrooms
- Bathrooms: 3 full bathrooms
- Interior features: Active listing (Plan: Robie, inventory type: Plan)
Neighborhood map
What this means for you Summary
Snapshot
- This is a 5-bed/3.0-bath single-family listed at $379k.
Deal economics
- At list price, monthly cash flow is $-603 ($-7k/yr) — negative.
- To cash-flow at today's rent, offer at most $373k (1.6% below list).
- To meet the 1% rule (rent ≥ 1% of price), the offer needs to be $326k (13.9% below list).
- Recommended offer: $326k (13.9% below list) — sets the bar for 1% rule.
Location & tenants
- Location reads 71/100 on livability (#392 in FL) — a middle-class / working-renter tenant base. Strengths: cost of living A+, housing A+, commute B+; Watch: schools F, amenities F, health & safety F.
- Manatee (suburban): math 54% / reading 50% proficiency, ranked #26 of 73 in FL (top 36%) — acceptable for families but not a draw, mixed tenant base, ~2y average lease.
- Market conditions: Rents soft (-0.9%/yr); 2170 active listings in the ZIP; 14 comparable units currently listed for rent nearby; rentals at typical pace (median 16d on market — plan ~3-4 weeks tenant-placement turnaround); high-income renter base; 7,472 units permitted in Manatee County in 2024 (1,782 in 5+ unit buildings).
- This rent runs 34% of the median local income ($114k/yr) — at the standard rent-burdened threshold; future hikes will face affordability resistance.
Forward outlook
- Local home prices are declining (-3.0%/yr); year-one equity from $3k of loan paydown is wiped out by about $14k of value loss. Plan a longer hold.
- Manatee County population projected at +43% by 2050 — long-run rental-demand tailwind backs the buy-and-hold thesis.
Negotiation context
- It's been on market 208 days — a 12% lower offer ($334k) is reasonable based on typical stale-listing flexibility.
Questions for the listing agent
- What do current leases actually rent for vs. the listed asking? Can we see a recent rent roll and the last 12 months of T-12 income?
- It's been on market 208 days. Have you received any prior offers? Is the seller open to a 14% concession, seller financing, or rate buy-down credit?
- Why hasn't it sold? Are there any deal-killer items the seller is aware of (foundation, flood, title, zoning, code violations)?
- Is there a deadline driving the sale (1031 exchange, divorce, estate, relocation)? That informs how much negotiation room exists.
- Schools are F-rated, which usually means shorter tenancies and higher turnover. Who's the typical renter profile here, and what's been the actual vacancy rate?
- The area grade is low — what's the realistic commute time and amenity access for the typical tenant pool here? Any planned neighborhood developments (good or bad) we should know about?
- What's the average days-on-market for RENTAL listings here right now (not sales)? A rising rental-DOM trend means longer vacancies and softer asking-rent achievability than the comps imply.
- What's the recent tenant-quality profile in this submarket — average credit score on applications, eviction rate, late-payment / NSF rate, and stable-employment percentage? A property-management company in the area should have these aggregated.
- How much new for-sale + rental construction is in the pipeline within 1–3 miles? Heavy new supply typically softens prices + rents 12–24 months out; constrained supply supports both.
Investment metrics
- 1% rule
- 0.71% ✗
- Cap rate
- 4.72%
- Cash-on-cash
- -5.61%
- DSCR
- 0.75
- GRM
- 11.8
CMA / ARV
- ARV (on-the-fly)
- $460,036
- Comps found
- 12
Show comp detail 12 sales within ~0.75 mi
| Address | Dist | Beds/Ba | Sqft | Sold | Price | $/sf | Match |
|---|---|---|---|---|---|---|---|
| 9972 Morning Meadowlark Trl | 0.17mi | 5/3.0 | 2,447 (0%) | 1mo | $394,000 | $161 | 91 |
| 10409 Woodland Garden Way | 0.07mi | 4/3.5 (-1) | 2,795 (+14%) | 0mo | $525,000 | $188 | 66 |
| 10640 Rabbit Grove Trl | 0.09mi | 4/3.5 (-1) | 2,795 (+14%) | 1mo | $502,000 | $180 | 64 |
| 10628 Rabbit Grove Trl | 0.11mi | 4/3.5 (-1) | 2,795 (+14%) | 0mo | $520,000 | $186 | 64 |
| 10729 Monarch Wood Gln | 0.36mi | 4/2.5 (-1) | 2,260 (-8%) | 0mo | $366,160 | $162 | 63 |
| 9837 Trellis Vine Way | 0.51mi | 4/3.0 (-1) | 2,262 (-8%) | 0mo | $440,730 | $195 | 58 |
| 11414 Starling Song Pl | 0.73mi | 4/3.0 (-1) | 2,486 (+2%) | 0mo | $480,000 | $193 | 58 |
| 10429 Abundance Grove Way | 0.60mi | 4/3.0 (-1) | 2,631 (+8%) | 0mo | $399,900 | $152 | 54 |
| 10717 Spanish Needle Cv | 0.65mi | 4/2.0 (-1) | 2,333 (-5%) | 0mo | $408,500 | $175 | 53 |
| 10049 Hidden Hammock Loop | 0.60mi | 4/3.0 (-1) | 2,226 (-9%) | 1mo | $430,000 | $193 | 51 |
| 10029 Hidden Hammock Loop | 0.67mi | 4/3.0 (-1) | 2,226 (-9%) | 1mo | $455,647 | $205 | 48 |
| 10526 Abundance Grove Way | 0.65mi | 4/3.0 (-1) | 2,181 (-11%) | 0mo | $457,000 | $210 | 46 |
Match score weights: distance 35% · size 25% · config 20% · recency 20%. Top-matched comps best support the ARV.
Projected returns pro-forma
-3.0% appreciation · 0.0% rent growth · sell at horizon
- IRR
- -29.3%
- Equity multiple
- 0.05×
- Total profit
- $-122,438
- Equity at exit
- $68,593
- IRR
- -47.9%
- Equity multiple
- -0.50×
- Total profit
- $-192,779
- Equity at exit
- $39,776
Cash invested: $128,810 (down + closing). Projections, not guarantees.
Landlord ↔ Tenant lean methodology
- Overall (STATE)
- 87 Strongly Landlord-Friendly
- State Florida
- 87 Strongly Landlord-Friendly · R+3
- County
- — inherits STATE
- City
- — inherits STATE
ZIP-level market 34219
- Home prices YoY
- -23.7%
- Rents YoY
- -0.9%
- Active inventory
- 2170
- Price-to-rent
- 9.7×
Monthly cashflow live
- Estimated rent
- $3,261 high interval (Pro) →
- Mortgage (P&I)
- −$2,412
- Tax est. 1.5%
- −$575 /mo · $6,901/yr
- Insurance
- −$192
- HOA
- −$0
- Vacancy / Maint / Mgmt
- −$685
- Net cashflow
- $-603
Break-even live
UW: 25.0% down · 7.5% · 30yr · 1.5% tax · 5.0% vac · 8.0% maint · 8.0% mgmt
Financing live
Cash to close
- Down payment
- $115,009
- Closing costs
- $13,801
- Reserves months
- —
- Total cash needed
- —
Loan-product check · same deal, 3 products live
Conventional
25% down · 7.5% · 30yr
- Down + closing
- —
- Monthly P&I
- —
- Monthly cashflow
- —
- DSCR
- —
- Eligible?
- —
Personal DTI + credit; lowest rate.
DSCR
20% down · 8.5% · 30yr
- Down + closing
- —
- Monthly P&I
- —
- Monthly cashflow
- —
- DSCR
- —
- Eligible?
- —
No personal income docs; deal must DSCR.
Hard money
10% down · 12.0% · 12mo
- Down + closing
- —
- Monthly P&I
- —
- Monthly cashflow
- —
- DSCR
- —
- Eligible?
- —
Short-term bridge; refi at stabilization.
Rent comps 14 comps
| Address | Beds | Baths | Sqft | Rent | $/sqft | DOM | Units | Dist |
|---|---|---|---|---|---|---|---|---|
| 9544 Sandy Bluffs Cir Parrish, FL | 5.0 | 3.0 | 2557 | $2,950 | $1.15 | 3d | 1 | 0.73mi |
| 9962 Last Light Gln Parrish, FL | 4.0 | 2.0 | 1740 | $2,495 | $1.43 | 3d | 1 | 0.92mi |
| 11454 Gallatin Trl Parrish, FL | 4.0 | 2.0 | 1635 | $2,575 | $1.57 | 15d | 1 | 1.02mi |
| 11512 Gallatin Trl Parrish, FL | 4.0 | 2.5 | 1929 | $3,300 | $1.71 | 23d | 1 | 1.05mi |
| 10749 Hidden Banks Gln Parrish, FL | 5.0 | 3.0 | 2447 | $2,549 | $1.04 | 23d | 1 | 1.12mi |
| 9009 Moccasin Wallow Rd Parrish, FL | 3.0–4.0 | 2.5 | 1581 | $2,304 | $1.46 | 1d | 32 | 1.14mi |
| 10225 Daybreak Gln Parrish, FL | 4.0 | 3.0 | 1978 | $2,600 | $1.31 | 3d | 1 | 1.15mi |
| 11880 Little River Way Parrish, FL | 4.0 | 2.0 | 1635 | $2,650 | $1.62 | 23d | 1 | 1.20mi |
| 10935 Gentle Current Way Parrish, FL | 5.0 | 3.0 | 2605 | $3,900 | $1.50 | 23d | 1 | 1.23mi |
| 8614 Mercator Ct Parrish, FL | 4.0 | 2.5 | 2910 | $3,300 | $1.13 | 23d | 1 | 1.35mi |
| 8541 Bella Mar Trl Parrish, FL | 5.0 | 3.0 | 2389 | $2,800 | $1.17 | 10d | 1 | 1.44mi |
| 8818 Gulf Shore Ter Parrish, FL | 6.0 | 3.0 | 3326 | $3,250 | $0.98 | 2d | 1 | 1.45mi |
| 8031 111th Ter E Parrish, FL | 5.0 | 3.0 | 3067 | $4,150 | $1.35 | 23d | 1 | 1.46mi |
| 8505 Bella Mar Trl Parrish, FL | 4.0 | 2.5 | 1870 | $2,750 | $1.47 | 15d | 1 | 1.50mi |
Listing history 14 events
-
2026-06-18days on market $378,990 Active 208 DOM
-
2026-06-17days on market $378,990 Active 207 DOM
-
2026-06-16days on market $378,990 Active 206 DOM
-
2026-06-15days on market $378,990 Active 205 DOM
-
2026-06-13days on market $378,990 Active 203 DOM
-
2026-06-13days on market $378,990 Active 202 DOM
-
2026-06-10days on market $378,990 Active 200 DOM
-
2026-06-09days on market $378,990 Active 199 DOM
-
2026-06-08days on market $378,990 Active 198 DOM
-
2026-06-08days on market $378,990 Active 197 DOM
-
2026-06-03days on market $378,990 Active 193 DOM
-
2026-06-02days on market $378,990 Active 192 DOM
-
2026-06-01days on market $378,990 Active 191 DOM
-
2026-05-31days on market $378,990 Active 190 DOM
ⓘ Source: listings_history table (triggers on properties + properties_extension) + one-shot
backfill from property_details.listing_events for pre-trigger history.
Nearby sold comps map
Loading sold comps map…
Walkable amenities ~0.75 mi
Loading nearby amenities…
Taxation est. · year 1
- Rental income
- $39,138
- − Mortgage interest
- −$25,769
- − Property taxes
- −$6,901
- − Insurance
- −$2,300
- − Repairs & maintenance
- −$3,131
- − Management
- −$3,131
- − Depreciation
- −$13,383
- Taxable loss
- −$15,477
- Est. tax savings @ 24.0%
- +$3,715
- After-tax cash flow
- $-3,517/yr
For passive investors: Depreciation is non-cash, so a rental often shows a tax loss while cash-flowing — sheltering income. Rental losses are passive: they offset passive income freely, and up to $25,000/yr can offset ordinary (W-2) income if you actively participate and your MAGI is under $100k (phasing out to $0 by $150k); unused losses carry forward. On sale, claimed depreciation is recaptured at up to 25%, and gains may owe capital-gains tax (a 1031 exchange can defer both). Figures are a year-1 estimate at your 24.0% rate — not tax advice; consult a CPA.
Schools (NCES district)
- District
- Manatee
- NCES district ID
- 1201230
- Math proficiency
- 54% ▼ -6.00%
- Reading proficiency
- 50% ▼ -2.00%
- Median HH income
- $49,607
- Composite
- 44.43/100
- National rank
- #2806
- State rank
- #26 of 73 in FL
Livability — Ruskin
- Score
- 71/100
- State rank
- #392
- US rank
- #6879
Category grades
Schools grade is shown separately in the Schools card above.
Census & demographics
- County
- Manatee County · 416,364 people
- City population
- 33,319
- Metro
- North Port-Sarasota-Bradenton, FL
- Population (ZIP)
- 33,296
- Household income
- $113,773
- Rent vs Own
- Severe rent burden
- 219.0
Population outlook (Manatee County) Hauer SSP2
- Today (2025)
- 447,342 people
- By 2030
- 488,911 · +9.3%
- By 2040
- 567,934 · +27.0%
- By 2050
- 637,995 · +42.6%
- By 2075
- 781,970 · +74.8%
- By 2100
- 848,272 · +89.6%
Race, ethnicity, and origin ACS 2023
- Neighborhood character
- Predominantly White (75%)
- Race & ethnicity
- White 75% Hispanic / Latino 11% Two or more races 8% Black 8% Asian 2%
- Hispanic origin (detail)
- Mexican 2% Puerto Rican 3%
- Common ancestry
- Romanian 4% Hispanic 2% Russian 2%
- Foreign-born
- 10% · Canada, Dominican Republic, Jamaica
- Languages at home
- 88% English-only · Spanish 7% French/Haitian/Cajun 2% Other Asian/Pacific 1%
Political lean MEDSL · Manatee
- 2024 margin
- Strong R (+23.5) · D 37.9% · R 61.4%
- 2008→2024 swing
- -16.5pp toward R · 2008: -7.0pp · 2024: -23.5pp
- All cycles
- 2024: R+23.5 2020: R+16.1 2016: R+17.1 2012: R+12.5 2008: R+7.0
Not yet ingested
- Civics
- —
Market trends
- HPI YoY
- ▼ -84.45%
- Current HPI
- 271.7131
- Rent YoY
- ▼ -0.95%
- Metro
- North Port-Sarasota-Bradenton, FL
- State GDP YoY
- ▲ 3.28%
- F500 in state
- 36
Industry mix (Fortune 500 HQ in FL)
| Industry | F500 HQs | Revenue |
|---|---|---|
| Industrial Technology | 2 | $29B |
|
||
| Insurance | 2 | $17B |
|
||
| Retail | 1 | $60B |
|
||
| Technology Distribution | 1 | $58B |
|
||
| Homebuilding | 1 | $35B |
|
||
| Technology Manufacturing | 1 | $35B |
|
||
Cash-flow waterfall
monthlySold comps — $/sqft
last 12 mo · ≤1 miLoading sold comps…