None · Charleston, MS
Flood risk 4/10 · Minor
- FEMA flood zone
- X (unshaded)
- Chance of flooding over 30 yrs
- 0.13%
- Est. flood insurance / yr
- $507 – $1,088
Fire risk 4/10 · Minor
- Est. fire insurance / yr
- $1,241 – $2,305
Heat risk 7/10 · Major
- Hot days now (above 110°F)
- 7 days/yr
- Hot days in 30 yrs
- 22 days/yr
Wind risk 6/10 · Moderate
- Chance of severe wind over 30 yrs
- 27.0%
Air-quality risk 1/10 · Minimal
- Unhealthy air days now
- 0 days/yr
- Unhealthy air days in 30 yrs
- 0 days/yr
Risk factors via First Street. Map © Google.
Why this score? — see what drove the C+ grade
The composite is a weighted blend of 9 inputs, each scored 0–100. Each bar is that input's sub-score; the figure is the points it added to the 100-point composite (weight × sub-score).
- Cash flow +19.4/30.0
- ARV discount +15.0/15.0
- DSCR +6.1/10.0
- 1% rule +6.0/10.0
- Appreciation +6.0/10.0
- Livability +3.2/5.0
- Rent growth +2.5/5.0
- Condition / age +2.5/5.0
- Schools +0.4/10.0
$89,900
🖨 Deal sheet (PDF) 📄 Offer letter ✓ Due diligence
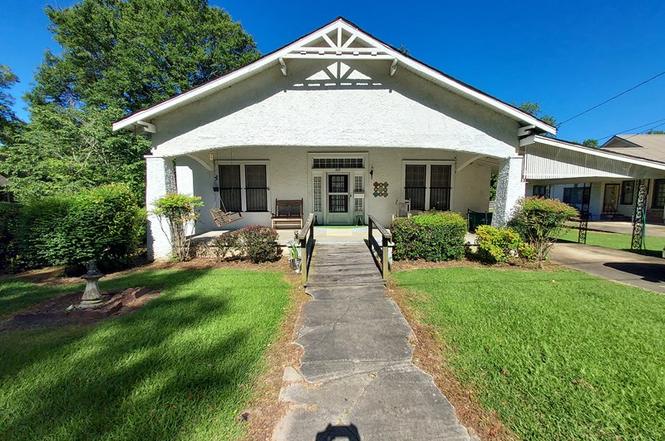
Listing remarks
Move-in ready. Quaint older home in quiet neighborhood. 3 large Bedrooms, 2300 square foot house. Kitchen with breakfast nook, large dining room and equally large Living room. Utility area. Concrete front porch and enclosed back porch. Stucco exterior and hardwood floors throughout. Attached carport. Multiple closets/storage areas. Window air and natural gas space heaters.
Key facts
- Move-in ready
- Quaint older home
- 0.41 acre lot
Tags
Property features AI
Exterior
- Parking: Attached garage (1 car)
- Utilities: Public water; Public sewer
- Home design: Single-story residential property; Single family zoning
- Construction: Stucco construction; Composition roof
- Exterior features: Deck; Porch
Interior
- Kitchen: Dishwasher; Electric range
- Flooring: Carpet; Hardwood
- Heating & cooling: Natural gas heating; Space heater; Window air conditioning units
- Interior features: Ceiling fans; Six total rooms
- Laundry & utility: Electric water heater
Neighborhood map
What this means for you Summary
Snapshot
- This is a 2-bed/1.0-bath single-family listed at $90k.
Deal economics
- At list price, monthly cash flow is $100 ($1k/yr) — positive.
- The deal already cash-flows at list — no discount required.
- Meets the 1% rule at list price ($987 rent vs $90k).
- Recommended offer: $79k (12.0% below list) — sets the bar for market timing.
Location & tenants
- Location reads 63/100 on livability (#165 in MS) — a middle-class / working-renter tenant base. Strengths: crime A+, cost of living A+, housing A; Watch: health & safety D+, schools F, amenities F.
- East Tallahatchie Consol School District (town): math 6% / reading 6% proficiency, ranked #127 of 130 in MS (top 98%) — low school quality limits family demand, transient renter base, plan for 1-2y turnover; 84% free/reduced lunch — lower-income household profile, screen leases tightly.
- Market conditions: 9 active listings in the ZIP; 1 units permitted in Tallahatchie County in 2024 (0 in 5+ unit buildings).
Forward outlook
- In year one you build about $2k of equity ($622 loan paydown + $2k appreciation (2.1% local appreciation)).
- Tallahatchie County population projected at -19% by 2050 — secular population decline; favor cash flow + early exit over multi-decade hold.
- At projected returns (2.1% appreciation + 3.0% rent growth), your $25k cash investment doubles in ~6 years — after that, you're playing with house money.
Negotiation context
- It's been on market 742 days — a 12% lower offer ($79k) is reasonable based on typical stale-listing flexibility.
Risks & watch-outs
- Watch-outs: built in 1900 — expect roof / HVAC / electrical / plumbing capex.
- Climate carrying-cost: major wind risk, 27% chance of damaging wind over 30y; extreme-heat days projected 7→22/yr by 2055 (HVAC capex compounding) — expect insurance premiums to compound above CPI over the hold.
Questions for the listing agent
- It's been on market 742 days. Have you received any prior offers? Is the seller open to a 12% concession, seller financing, or rate buy-down credit?
- Built in 1900 — when were the roof, HVAC, electrical panel, plumbing, and water heater last replaced?
- Why hasn't it sold? Are there any deal-killer items the seller is aware of (foundation, flood, title, zoning, code violations)?
- Is there a deadline driving the sale (1031 exchange, divorce, estate, relocation)? That informs how much negotiation room exists.
- Schools are F-rated, which usually means shorter tenancies and higher turnover. Who's the typical renter profile here, and what's been the actual vacancy rate?
- What's the average days-on-market for RENTAL listings here right now (not sales)? A rising rental-DOM trend means longer vacancies and softer asking-rent achievability than the comps imply.
- What's the recent tenant-quality profile in this submarket — average credit score on applications, eviction rate, late-payment / NSF rate, and stable-employment percentage? A property-management company in the area should have these aggregated.
- How much new for-sale + rental construction is in the pipeline within 1–3 miles? Heavy new supply typically softens prices + rents 12–24 months out; constrained supply supports both.
Investment metrics
- 1% rule
- 1.10% ✓
- Cap rate
- 7.62%
- Cash-on-cash
- 4.75%
- DSCR
- 1.21
- GRM
- 7.6
CMA / ARV
- ARV (on-the-fly)
- $169,464
- Comps found
- 2
Show comp detail 2 sales within ~0.75 mi
| Address | Dist | Beds/Ba | Sqft | Sold | Price | $/sf | Match |
|---|---|---|---|---|---|---|---|
| 11 W Cypress St | 0.32mi | 3/2.0 (+1) | 2,603 (+6%) | 23mo | $180,000 | $69 | 47 |
| 155 W Cypress St | 0.35mi | 3/1.0 (+1) | 2,151 (-12%) | 21mo | $37,500 | $17 | 41 |
Match score weights: distance 35% · size 25% · config 20% · recency 20%. Top-matched comps best support the ARV.
Projected returns pro-forma
2.09% appreciation · 3.0% rent growth · sell at horizon
- IRR
- 9.5%
- Equity multiple
- 1.51×
- Total profit
- $12,961
- Equity at exit
- $35,888
- IRR
- 12.5%
- Equity multiple
- 2.70×
- Total profit
- $42,842
- Equity at exit
- $52,012
Cash invested: $25,172 (down + closing). Projections, not guarantees.
Landlord ↔ Tenant lean methodology
- Overall (STATE)
- 90 Strongly Landlord-Friendly
- State Mississippi
- 90 Strongly Landlord-Friendly · R+11
- County
- — inherits STATE
- City
- — inherits STATE
ZIP-level market 38921
- Home prices YoY
- 3.0%
- Active inventory
- 9
- Price-to-rent
- 7.6×
Monthly cashflow live
- Estimated rent
- $987 medium interval (Pro) →
- Mortgage (P&I)
- −$471
- Tax from tax record
- −$171 /mo · $2,057/yr
- Insurance
- −$37
- HOA
- −$0
- Vacancy / Maint / Mgmt
- −$207
- Net cashflow
- $100
Break-even live
Sensitivity live
| Price | -10% $150 | -5% $125 | +0% $100 | +5% $74 | +10% $49 |
|---|---|---|---|---|---|
| Rent | -10% $22 | -5% $61 | +0% $100 | +5% $139 | +10% $178 |
| Rate | -1.0pp $145 | -0.5pp $122 | base $100 | +0.5pp $76 | +1.0pp $53 |
UW: 25.0% down · 7.5% · 30yr · 1.5% tax · 5.0% vac · 8.0% maint · 8.0% mgmt
Financing live
Cash to close
- Down payment
- $22,475
- Closing costs
- $2,697
- Reserves months
- —
- Total cash needed
- —
Loan-product check · same deal, 3 products live
Conventional
25% down · 7.5% · 30yr
- Down + closing
- —
- Monthly P&I
- —
- Monthly cashflow
- —
- DSCR
- —
- Eligible?
- —
Personal DTI + credit; lowest rate.
DSCR
20% down · 8.5% · 30yr
- Down + closing
- —
- Monthly P&I
- —
- Monthly cashflow
- —
- DSCR
- —
- Eligible?
- —
No personal income docs; deal must DSCR.
Hard money
10% down · 12.0% · 12mo
- Down + closing
- —
- Monthly P&I
- —
- Monthly cashflow
- —
- DSCR
- —
- Eligible?
- —
Short-term bridge; refi at stabilization.
Listing history 16 events
-
2026-06-21days on market $89,900 Active 742 DOM
-
2026-06-18days on market $89,900 Active 740 DOM
-
2026-06-17days on market $89,900 Active 739 DOM
-
2026-06-16days on market $89,900 Active 738 DOM
-
2026-06-15days on market $89,900 Active 737 DOM
-
2026-06-13days on market $89,900 Active 735 DOM
-
2026-06-12days on market $89,900 Active 734 DOM
-
2026-06-09days on market $89,900 Active 731 DOM
-
2026-06-08days on market $89,900 Active 730 DOM
-
2026-06-07days on market $89,900 Active 729 DOM
-
2026-06-05days on market $89,900 Active 727 DOM
-
2026-06-04days on market $89,900 Active 725 DOM
-
2026-06-02days on market $89,900 Active 724 DOM
-
2026-06-01days on market $89,900 Active 723 DOM
-
2026-05-31days on market $89,900 Active 722 DOM
-
2024-04-15$89,900 Active
ⓘ Source: listings_history table (triggers on properties + properties_extension) + one-shot
backfill from property_details.listing_events for pre-trigger history.
Tax reassessment forecast MS · Resets to sale price
- Current annual tax
- $2,057 · $171/mo
- Projected year-2 tax
- $2,057 · $171/mo
- Expected delta
- $0/yr ($0/mo · 0.0%)
ⓘ Screening estimate from a state-policy table — verify with the county assessor before closing.
Climate risk First Street
- Flood 4/10 Moderate FEMA zone X (unshaded) · 13% chance over 30 yrs
- Wildfire 4/10 Moderate
- Heat 7/10 Severe 7 d/yr ≥110°F today · 22 d/yr by 30 yrs out
- Wind 6/10 Major 27% chance of damaging wind over 30 yrs
- Air quality 1/10 Low 0 unhealthy d/yr today · 0 by 30 yrs out
Nearby sold comps map
Loading sold comps map…
Walkable amenities ~0.75 mi
Loading nearby amenities…
Taxation est. · year 1
- Rental income
- $11,847
- − Mortgage interest
- −$5,036
- − Property taxes
- −$2,057
- − Insurance
- −$450
- − Repairs & maintenance
- −$948
- − Management
- −$948
- − Depreciation
- −$2,615
- Taxable loss
- −$206
- Est. tax savings @ 24.0%
- +$50
- After-tax cash flow
- $1,245/yr
For passive investors: Depreciation is non-cash, so a rental often shows a tax loss while cash-flowing — sheltering income. Rental losses are passive: they offset passive income freely, and up to $25,000/yr can offset ordinary (W-2) income if you actively participate and your MAGI is under $100k (phasing out to $0 by $150k); unused losses carry forward. On sale, claimed depreciation is recaptured at up to 25%, and gains may owe capital-gains tax (a 1031 exchange can defer both). Figures are a year-1 estimate at your 24.0% rate — not tax advice; consult a CPA.
Schools (NCES district)
- District
- East Tallahatchie Consol School District
- NCES district ID
- 2801410
- Math proficiency
- 6% ▼ -14.00%
- Reading proficiency
- 6% ▼ -12.00%
- Median HH income
- $30,874
- Composite
- 4.48/100
- National rank
- #10053
- State rank
- #127 of 130 in MS
Livability — Charleston
- Score
- 63/100
- State rank
- #165
- US rank
- #15983
Category grades
Schools grade is shown separately in the Schools card above.
Census & demographics
- Census place
- Charleston, MS
- Population (ZIP)
- 5,010
Population outlook (Tallahatchie County) Hauer SSP2
- Today (2025)
- 13,680 people
- By 2030
- 13,261 · -3.1%
- By 2040
- 12,205 · -10.8%
- By 2050
- 11,028 · -19.4%
- By 2075
- 8,367 · -38.8%
- By 2100
- 6,277 · -54.1%
Race, ethnicity, and origin ACS 2023
- Neighborhood character
- Majority Black (61%)
- Race & ethnicity
- Black 61% White 37% Two or more races 2%
- Common ancestry
- Serbian 2% Italian 1%
- Foreign-born
- 0%
Political lean MEDSL · Tallahatchie
- 2024 margin
- Lean D (+5.9) · D 52.5% · R 46.5%
- 2008→2024 swing
- -13.1pp toward R · 2008: 19.0pp · 2024: 5.9pp
- All cycles
- 2024: D+5.9 2020: D+10.8 2016: D+14.9 2012: D+21.3 2008: D+19.0
Not yet ingested
- Civics
- —
Market trends
- HPI YoY
- ▲ 2.09%
- Current HPI
- 72.3877
- Rent YoY
- —
- Metro
- —
- State GDP YoY
- —
- F500 in state
- 0
Price history
1 event — show timeline
- 2024-04-15 Listed $89,900 GBOR
Property tax history
+45.4%/yrLatest (2025): $2,057 · +23.0% YoY. Source: county tax records.
Cash-flow waterfall
monthlySold comps — $/sqft
last 12 mo · ≤1 miLoading sold comps…