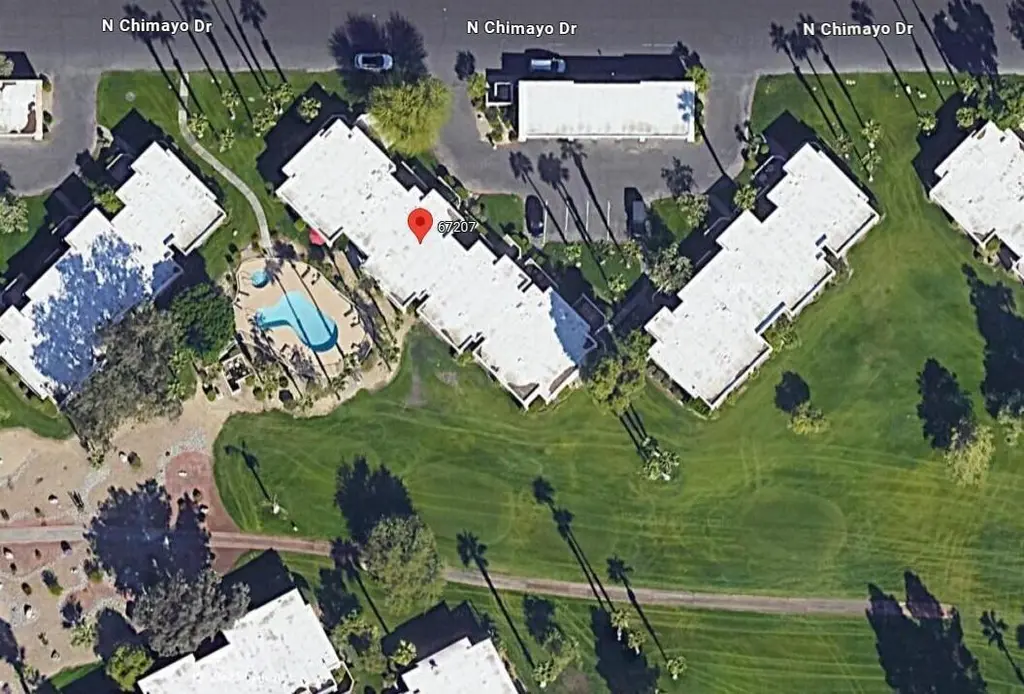
67207 N Chimayo Dr · Cathedral City, CA
Flood risk 3/10 · Minor
- FEMA flood zone
- X
- Chance of flooding over 30 yrs
- 0.09%
- Est. flood insurance / yr
- $507 – $1,088
Fire risk 1/10 · Minimal
- Est. fire insurance / yr
- $659 – $1,223
Heat risk 9/10 · Severe
- Hot days now (above 112°F)
- 5 days/yr
- Hot days in 30 yrs
- 14 days/yr
Wind risk 1/10 · Minimal
- Chance of severe wind over 30 yrs
- —
Air-quality risk 5/10 · Moderate
- Unhealthy air days now
- 6 days/yr
- Unhealthy air days in 30 yrs
- 8 days/yr
Risk factors via First Street. Map © Google.
Why this score? — see what drove the C- grade
The composite is a weighted blend of 9 inputs, each scored 0–100. Each bar is that input's sub-score; the figure is the points it added to the 100-point composite (weight × sub-score).
- Cash flow +15.7/30.0
- ARV discount +10.1/15.0
- 1% rule +9.6/10.0
- DSCR +4.8/10.0
- Rent growth +3.3/5.0
- Livability +3.3/5.0
- Schools +2.7/10.0
- Condition / age +2.5/5.0
- Appreciation +0.0/10.0
$249,000
🖨 Deal sheet 📄 Offer letter ✓ Due diligence
Listing remarks MLS
Value-Priced 2BR/2BA Condo. Dual Master Suite Alameda floor plan. Walk-in closets. Large patio faces SW with great sun exposure and mountain views. Land lease has been extended to 2069. Pool and Spa right out your back door. Great opportunity to purchase and update or remodel. Resort amenities are plentiful including 27 hole PGA course. Perfect for a second home, seasonal rental or make it your permanent home. HOA fees include CATV/Internet, Country Club membership, tennis and fitness center. update or remodel.
Key facts
- Dual master suite
- Walk-in closets
- Large patio
Tags
Neighborhood map
What this means for you Summary
Snapshot
- This is a 2-bed/2.0-bath condo listed at $249k.
Deal economics
- At list price, monthly cash flow is $107 ($1k/yr) — positive.
- The deal already cash-flows at list — no discount required.
- Meets the 1% rule at list price ($4k rent vs $249k).
- Recommended offer: $219k (12.0% below list) — sets the bar for market timing.
- Cap rate 6.8% vs local median 5.1% in Cathedral City — top-decile yield for the area; either an underpriced asset or a hidden risk that comps aren't pricing in. Stress-test before assuming the spread holds.
Location & tenants
- Location reads 66/100 on livability (#344 in CA) — a middle-class / working-renter tenant base. Strengths: commute A+, housing B+; Watch: employment D+, schools F, amenities D-.
- Palm Springs Unified (suburban): math 21% / reading 42% proficiency, ranked #328 of 517 in CA (top 63%) — families likely to look elsewhere, expect single-tenant / working-renter base with shorter leases; 73% free/reduced lunch — lower-income household profile, screen leases tightly.
- Market conditions: Rents rising (+3.2%/yr); 525 active listings in the ZIP; 40 comparable units currently listed for rent nearby; rentals lingering (median 44d on market — plan ~5-8 weeks vacancy on turnover, expect pricing pressure); 75% of comp listings sitting > 30 days — soft ceiling on asking rent; 9,195 units permitted in Riverside County in 2024 (1,512 in 5+ unit buildings).
- At $3,640/mo this rent would consume 59% of the median local household income ($74k/yr) (locally 1682% of renters already pay >50% of income on rent) — very limited rent-growth headroom before tenants either downsize or default.
Forward outlook
- Local home prices are declining (-3.0%/yr); year-one equity from $2k of loan paydown is wiped out by about $7k of value loss. Plan a longer hold.
- Riverside County population projected at +22% by 2050 — long-run rental-demand tailwind backs the buy-and-hold thesis.
Negotiation context
- It's been on market 220 days — a 12% lower offer ($219k) is reasonable based on typical stale-listing flexibility.
- 3 sale attempts since 26y ago with the ask held roughly flat each time — persistent listings suggest the price (not the market) is what's stuck; bring a comps-based counter.
Risks & watch-outs
- Watch-outs: HOA is 27% of rent.
- Climate carrying-cost: extreme-heat days projected 5→14/yr by 2055 (HVAC capex compounding) — expect insurance premiums to compound above CPI over the hold.
Questions for the listing agent
- It's been on market 220 days. Have you received any prior offers? Is the seller open to a 12% concession, seller financing, or rate buy-down credit?
- What does the HOA fee cover, when was the last increase, and are there any pending special assessments or reserve-fund shortfalls?
- Any open or pending special assessments — roof, HVAC, plumbing, elevator, façade? What's the per-unit balance and payoff schedule, and is the seller paying it off at close or rolling it to the buyer?
- Why hasn't it sold? Are there any deal-killer items the seller is aware of (foundation, flood, title, zoning, code violations)?
- Is there a deadline driving the sale (1031 exchange, divorce, estate, relocation)? That informs how much negotiation room exists.
- Schools are F-rated, which usually means shorter tenancies and higher turnover. Who's the typical renter profile here, and what's been the actual vacancy rate?
- What's the average days-on-market for RENTAL listings here right now (not sales)? A rising rental-DOM trend means longer vacancies and softer asking-rent achievability than the comps imply.
- What's the recent tenant-quality profile in this submarket — average credit score on applications, eviction rate, late-payment / NSF rate, and stable-employment percentage? A property-management company in the area should have these aggregated.
- How much new apartment / multifamily construction is in the pipeline within 1–3 miles? Heavy new supply (>2% of stock underway) typically softens rents 12–24 months out; light construction supports rent growth.
Investment metrics
- 1% rule
- 1.46% ✓
- Cap rate
- 6.81%
- Cash-on-cash
- 1.85%
- DSCR
- 1.08
- GRM
- 5.7
CMA / ARV
- ARV (median comp)
- $264,363
- List price
- $249,000
- Delta
- -5.81%
- Verdict
- FAIR
- Comps
- 20 within 1.0 mi
Projected returns pro-forma
-3.0% appreciation · 3.22% rent growth · sell at horizon
- IRR
- -12.6%
- Equity multiple
- 0.54×
- Total profit
- $-32,013
- Equity at exit
- $37,127
- IRR
- -2.7%
- Equity multiple
- 0.81×
- Total profit
- $-12,915
- Equity at exit
- $21,529
Cash invested: $69,720 (down + closing). Projections, not guarantees.
Landlord ↔ Tenant lean methodology
- Overall (STATE)
- 18 Strongly Tenant-Friendly
- State California
- 18 Strongly Tenant-Friendly · D+13
- County
- — inherits STATE
- City
- — inherits STATE
ZIP-level market 92234
- Home prices YoY
- -27.7%
- Rents YoY
- 3.2%
- Active inventory
- 525
- Price-to-rent
- 5.7×
Monthly cashflow live
- Estimated rent
- $3,640 high interval (Pro) →
- Mortgage (P&I)
- −$1,306
- Tax from tax record
- −$364 /mo · $4,367/yr
- Insurance
- −$104
- HOA
- −$995
- Vacancy / Maint / Mgmt
- −$764
- Net cashflow
- $107
Break-even live
UW: 25.0% down · 7.5% · 30yr · 1.5% tax · 5.0% vac · 8.0% maint · 8.0% mgmt
Financing live
Cash to close
- Down payment
- $62,250
- Closing costs
- $7,470
- Reserves months
- —
- Total cash needed
- —
Loan-product check · same deal, 3 products live
Conventional
25% down · 7.5% · 30yr
- Down + closing
- —
- Monthly P&I
- —
- Monthly cashflow
- —
- DSCR
- —
- Eligible?
- —
Personal DTI + credit; lowest rate.
DSCR
20% down · 8.5% · 30yr
- Down + closing
- —
- Monthly P&I
- —
- Monthly cashflow
- —
- DSCR
- —
- Eligible?
- —
No personal income docs; deal must DSCR.
Hard money
10% down · 12.0% · 12mo
- Down + closing
- —
- Monthly P&I
- —
- Monthly cashflow
- —
- DSCR
- —
- Eligible?
- —
Short-term bridge; refi at stabilization.
Rent comps 40 comps
| Address | Beds | Baths | Sqft | Rent | $/sqft | DOM | Units | Dist |
|---|---|---|---|---|---|---|---|---|
| 67242 Cumbres Ct Cathedral City, CA | 3.0 | 2.0 | 1285 | $4,500 | $3.50 | 24d | 1 | 0.04mi |
| 67263 N Chimayo Dr Cathedral City, CA | 2.0 | 2.0 | 1177 | $4,200 | $3.57 | 14d | 1 | 0.04mi |
| 67261 Cumbres Ct Cathedral City, CA | 2.0 | 2.0 | 984 | $4,000 | $4.07 | 43d | 1 | 0.08mi |
| 67320 Cumbres Ct Cathedral City, CA | 2.0 | 2.0 | 1212 | $4,200 | $3.47 | 43d | 1 | 0.10mi |
| 67328 Cumbres Ct Unit 702 Cathedral City, CA | 1.0 | 2.0 | 851 | $3,400 | $4.00 | 43d | 1 | 0.11mi |
| 67330 W Chimayo Dr Cathedral City, CA | 2.0 | 2.0 | 1177 | $3,300 | $2.80 | 43d | 1 | 0.13mi |
| 67232 S Chimayo Dr Cathedral City, CA | 3.0 | 2.0 | 1285 | $4,500 | $3.50 | 43d | 1 | 0.15mi |
| 67240 S Chimayo Dr Unit 702 Cathedral City, CA | 1.0 | 2.0 | 851 | $2,200 | $2.59 | 43d | 1 | 0.16mi |
| 67444 Toltec Ct Cathedral City, CA | 2.0 | 2.0 | 1212 | $3,000 | $2.48 | 2d | 1 | 0.21mi |
| 67463 Toltec Ct Cathedral City, CA | 1.0 | 2.0 | 851 | $3,500 | $4.11 | 43d | 1 | 0.25mi |
| 67553 N Portales Dr Unit 288 Cathedral City, CA | 2.0 | 2.0 | 1212 | $4,200 | $3.47 | 24d | 1 | 0.31mi |
| 67553 N Portales Dr Cathedral City, CA | 2.0 | 2.0 | 1212 | $4,200 | $3.47 | 43d | 1 | 0.31mi |
| 67552 N Natoma Dr Cathedral City, CA | 2.0 | 2.0 | 1177 | $4,200 | $3.57 | 43d | 1 | 0.32mi |
| 28477 Taos Ct Cathedral City, CA | 2.0 | 2.0 | 1212 | $4,000 | $3.30 | 43d | 1 | 0.40mi |
| 28464 Taos Ct Cathedral City, CA | 2.0 | 2.0 | 1212 | $2,100 | $1.73 | 23d | 1 | 0.43mi |
| 28602 Taos Ct Cathedral City, CA | 2.0 | 2.0 | 1212 | $4,000 | $3.30 | 43d | 1 | 0.47mi |
| 28656 Taos Ct Cathedral City, CA | 2.0 | 2.0 | 1177 | $2,200 | $1.87 | 43d | 1 | 0.50mi |
| 28764 Taos Ct Cathedral City, CA | 2.0 | 2.0 | 1177 | $4,400 | $3.74 | 43d | 1 | 0.52mi |
| 29170 W Laguna Dr Cathedral City, CA | 2.0 | 3.0 | 1425 | $6,000 | $4.21 | 43d | 1 | 0.54mi |
| 28920 W Natoma Dr Cathedral City, CA | 2.0 | 2.0 | 1177 | $4,000 | $3.40 | 43d | 1 | 0.54mi |
| 67821 N Portales Dr Cathedral City, CA | 2.0 | 2.0 | 1177 | $4,000 | $3.40 | 43d | 1 | 0.56mi |
| 67821 N Portales Dr Unit 251 Cathedral City, CA | 2.0 | 2.0 | 1177 | $4,000 | $3.40 | 24d | 1 | 0.56mi |
| 29017 W Natoma Dr Cathedral City, CA | 2.0 | 2.0 | 1177 | $2,395 | $2.03 | 43d | 1 | 0.57mi |
| 67765 Ovante Rd Cathedral City, CA | 3.0 | 2.0 | 1446 | $2,699 | $1.87 | 13d | 1 | 0.59mi |
| 67847 N Portales Dr Unit 288 Cathedral City, CA | 2.0 | 2.0 | 1212 | $4,200 | $3.47 | 43d | 1 | 0.59mi |
| 28859 Desert Princess Dr Cathedral City, CA | 3.0 | 2.0 | 1285 | $3,700 | $2.88 | 43d | 1 | 0.60mi |
| 28914 Desert Princess Dr Unit 702 Palm Springs, CA | 2.0 | 2.0 | 1212 | $4,200 | $3.47 | 24d | 1 | 0.61mi |
| 67595 Lagos Way Cathedral City, CA | 3.0 | 3.0 | 1285 | $3,500 | $2.72 | 43d | 1 | 0.62mi |
| 28964 Desert Princess Dr Cathedral City, CA | 2.0 | 2.0 | 1177 | $2,700 | $2.29 | 43d | 1 | 0.63mi |
| 28984 Desert Princess Dr Unit 702 Cathedral City, CA | 1.0 | 2.0 | 851 | $3,400 | $4.00 | 43d | 1 | 0.64mi |
| 67665 Lagos Way Cathedral City, CA | 3.0 | 2.0 | 1285 | $4,500 | $3.50 | 43d | 1 | 0.66mi |
| 28827 Isleta Ct Cathedral City, CA | 3.0 | 2.0 | 1285 | $4,500 | $3.50 | 43d | 1 | 0.68mi |
| 29118 Desert Princess Dr Unit 702 Cathedral City, CA | 2.0 | 2.0 | 1212 | $4,200 | $3.47 | 43d | 1 | 0.70mi |
| 28868 Isleta Ct Unit 702 Cathedral City, CA | 2.0 | 2.0 | 1285 | $4,900 | $3.81 | 24d | 1 | 0.74mi |
| 28868 Isleta Ct Cathedral City, CA | 2.0 | 2.0 | 1285 | $4,900 | $3.81 | 43d | 1 | 0.74mi |
| 28763 E Portales Dr Cathedral City, CA | 2.0 | 2.0 | 984 | $4,200 | $4.27 | 7d | 1 | 0.77mi |
| 67727 S Natoma Dr Cathedral City, CA | 2.0 | 3.0 | 1425 | $4,500 | $3.16 | 43d | 1 | 0.86mi |
| 29199 E Portales Dr Unit 702 Cathedral City, CA | 2.0 | 2.0 | 1177 | $4,200 | $3.57 | 43d | 1 | 0.86mi |
| 29704 W Trancas Dr Cathedral City, CA | 2.0 | 2.5 | 1425 | $6,000 | $4.21 | 43d | 1 | 0.95mi |
| 30201 San Diego Dr Cathedral City, CA | 3.0 | 2.0 | 1060 | $2,700 | $2.55 | 43d | 1 | 1.03mi |
HOA detail condo
- Monthly dues
- $995 · $11,940/yr
- Likely covers
- internetpoolgym
- Assessments
- None detected in remarks — confirm with the listing agent.
Listing history 19 events
-
2026-06-18days on market $249,000 Active 220 DOM
-
2026-06-17days on market $249,000 Active 219 DOM
-
2026-06-16days on market $249,000 Active 218 DOM
-
2026-06-15days on market $249,000 Active 217 DOM
-
2026-06-13days on market $249,000 Active 215 DOM
-
2026-06-13days on market $249,000 Active 214 DOM
-
2026-06-09days on market $249,000 Active 211 DOM
-
2026-06-08days on market $249,000 Active 210 DOM
-
2026-06-07days on market $249,000 Active 209 DOM
-
2026-06-04days on market $249,000 Active 206 DOM
-
2026-06-03days on market $249,000 Active 205 DOM
-
2026-06-02days on market $249,000 Active 204 DOM
-
2026-06-01days on market $249,000 Active 203 DOM
-
2026-05-31days on market $249,000 Active 202 DOM
-
2025-11-10$249,000 Active 517-char remark
Show marketing remark (517 chars)
Value-Priced 2BR/2BA Condo. Dual Master Suite Alameda floor plan. Walk-in closets. Large patio faces SW with great sun exposure and mountain views. Land lease has been extended to 2069. Pool and Spa right out your back door. Great opportunity to purchase and update or remodel. Resort amenities are plentiful including 27 hole PGA course. Perfect for a second home, seasonal rental or make it your permanent home. HOA fees include CATV/Internet, Country Club membership, tennis and fitness center. update or remodel.
-
2001-07-16historical
-
2001-06-25$81,900
-
2001-05-25historical
-
2000-11-24$82,000
ⓘ Source: listings_history table (triggers on properties + properties_extension) + one-shot
backfill from property_details.listing_events for pre-trigger history.
Tax reassessment forecast CA · Resets to sale price
- Current annual tax
- $4,367 · $364/mo
- Projected year-2 tax
- $4,367 · $364/mo
- Expected delta
- $0/yr ($0/mo · 0.0%)
ⓘ Screening estimate from a state-policy table — verify with the county assessor before closing.
Climate risk First Street
- Flood 3/10 Moderate FEMA zone X · 9% chance over 30 yrs
- Wildfire 1/10 Low
- Heat 9/10 Extreme 5 d/yr ≥112°F today · 14 d/yr by 30 yrs out
- Wind 1/10 Low
- Air quality 5/10 Major 6 unhealthy d/yr today · 8 by 30 yrs out
Nearby sold comps map
Loading sold comps map…
Walkable amenities ~0.75 mi
Loading nearby amenities…
Taxation est. · year 1
- Rental income
- $43,682
- − Mortgage interest
- −$13,948
- − Property taxes
- −$4,367
- − Insurance
- −$1,245
- − Repairs & maintenance
- −$3,495
- − Management
- −$3,495
- − HOA
- −$11,940
- − Depreciation
- −$7,244
- Taxable loss
- −$2,051
- Est. tax savings @ 24.0%
- +$492
- After-tax cash flow
- $1,779/yr
For passive investors: Depreciation is non-cash, so a rental often shows a tax loss while cash-flowing — sheltering income. Rental losses are passive: they offset passive income freely, and up to $25,000/yr can offset ordinary (W-2) income if you actively participate and your MAGI is under $100k (phasing out to $0 by $150k); unused losses carry forward. On sale, claimed depreciation is recaptured at up to 25%, and gains may owe capital-gains tax (a 1031 exchange can defer both). Figures are a year-1 estimate at your 24.0% rate — not tax advice; consult a CPA.
Schools (NCES district)
- District
- Palm Springs Unified
- NCES district ID
- 0629550
- Math proficiency
- 21% ▼ -7.00%
- Reading proficiency
- 42% ▬ 0.00%
- Median HH income
- $43,638
- Composite
- 26.76/100
- National rank
- #7131
- State rank
- #328 of 517 in CA
Livability — Cathedral City
- Score
- 66/100
- State rank
- #344
- US rank
- #11749
Category grades
Schools grade is shown separately in the Schools card above.
Census & demographics
- Census place
- Cathedral City, CA
- County
- Riverside County · 2,287,001 people
- City population
- 52,267
- Metro
- Riverside-San Bernardino-Ontario, CA
- Population (ZIP)
- 52,267
- Household income
- $73,572
- Rent vs Own
- Severe rent burden
- 1682.0
Population outlook (Riverside County) Hauer SSP2
- Today (2025)
- 2,664,475 people
- By 2030
- 2,802,692 · +5.2%
- By 2040
- 3,050,904 · +14.5%
- By 2050
- 3,256,783 · +22.2%
- By 2075
- 3,655,058 · +37.2%
- By 2100
- 3,766,594 · +41.4%
Race, ethnicity, and origin ACS 2023
- Neighborhood character
- Diverse neighborhood (Simpson 0.56)
- Race & ethnicity
- Hispanic / Latino 59% White 30% Two or more races 27% Asian 6% Native American 2% Black 2%
- Hispanic origin (detail)
- Mexican 51%
- Common ancestry
- Lithuanian 2% Romanian 1% Italian 1%
- Foreign-born
- 28% · Canada, Vietnam
- Languages at home
- 48% English-only · Spanish 46% Tagalog/Filipino 3% Other Asian/Pacific 1%
Political lean MEDSL · Riverside
- 2024 margin
- Toss-up / Even · D 48.0% · R 49.3% · Other 2.6%
- 2008→2024 swing
- -3.6pp toward R · 2008: 2.3pp · 2024: -1.3pp
- All cycles
- 2024: R+1.3 2020: D+8.0 2016: D+4.3 2012: R+0.4 2008: D+2.3
Not yet ingested
- Civics
- —
Market trends
- HPI YoY
- ▼ -136.57%
- Current HPI
- 356.9845
- Rent YoY
- ▲ 3.22%
- Metro
- Riverside-San Bernardino-Ontario, CA
- State GDP YoY
- ▲ 3.21%
- F500 in state
- 116
Industry mix (Fortune 500 HQ in CA)
| Industry | F500 HQs | Revenue |
|---|---|---|
| Technology | 27 | $1,492B |
|
||
| Financial Services | 3 | $174B |
|
||
| Retail | 3 | $44B |
|
||
| Insurance | 3 | $26B |
|
||
| Media / Entertainment | 2 | $115B |
|
||
| Pharmaceuticals / Biotech | 2 | $62B |
|
||
Price history
+203.7% since first listed5 events — show timeline
- 2025-11-10 Listed $249,000 GPSMLS
- 2001-07-16 Listing Removed — GPSMLS
- 2001-06-25 Listed $81,900 GPSMLS
- 2001-05-25 Listing Removed — GPSMLS
- 2000-11-24 Listed $82,000 GPSMLS
Property tax history
+3.0%/yrLatest (2025): $4,367 · +0.1% YoY. Source: county tax records.
Cash-flow waterfall
monthlySold comps — $/sqft
last 12 mo · ≤1 miLoading sold comps…