 🏷️ Likely Rental
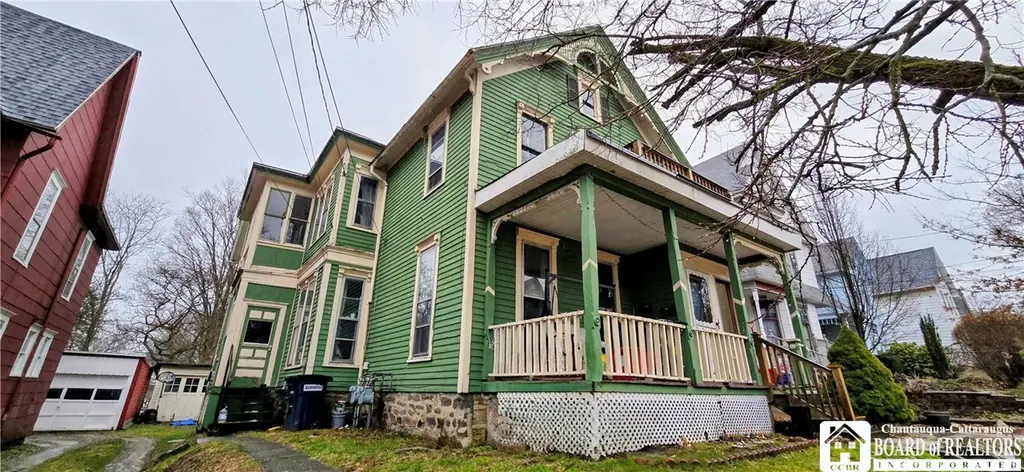
217 N 5th St · Olean, NY
Flood risk 1/10 · Minimal
- FEMA flood zone
- X
- Chance of flooding over 30 yrs
- 0.0%
- Est. flood insurance / yr
- $473 – $860
Fire risk 4/10 · Minor
- Est. fire insurance / yr
- $691 – $1,283
Heat risk 2/10 · Minimal
- Hot days now (above 90°F)
- 8 days/yr
- Hot days in 30 yrs
- 19 days/yr
Wind risk 1/10 · Minimal
- Chance of severe wind over 30 yrs
- —
Air-quality risk 1/10 · Minimal
- Unhealthy air days now
- 0 days/yr
- Unhealthy air days in 30 yrs
- 0 days/yr
Risk factors via First Street. Map © Google.
Why this score? — see what drove the B+ grade
The composite is a weighted blend of 9 inputs, each scored 0–100. Each bar is that input's sub-score; the figure is the points it added to the 100-point composite (weight × sub-score).
- Cash flow +30.0/30.0
- ARV discount +15.0/15.0
- 1% rule +10.0/10.0
- DSCR +10.0/10.0
- Livability +3.6/5.0
- Schools +3.5/10.0
- Rent growth +2.5/5.0
- Condition / age +2.5/5.0
- Appreciation +0.0/10.0
$99,900
🖨 Deal sheet 📄 Offer letter ✓ Due diligence
Multi-family units
County records classify this as Multi-Family (2-4 Unit). Listing-text estimate: 1 unit. estimate disagrees with records
Listing remarks MLS
Olean City: 2 unit home with 3 bedrooms in each unit. Close to Olean High School. This property is Bank Owned and they want a fast sale. They are offering Seller Financing with 10% Down and proof of Deposit. No minimum Credit score will be needed for Approval. Asking $27,900.
Key facts
- 5,120 sq ft lot
- 2 garage spots
- Built 1890
Property features AI
Finance
- Other: Two total units with separate gas and electric meters (2 each)
- Financial info: Owner pays water; Rent includes water; Operating expenses include water/sewer
Exterior
- Parking: 2-car garage; Common parking with two or more spaces
- Utilities: Public water connected; Sewer connected
- Home design: 2-story building; Existing (resale) property
- Construction: Wood siding construction
- Exterior features: Rectangular lot (40 x 128)
Interior
- Flooring: Carpet; Hardwood; Vinyl; Varies
- Bathrooms: 2 full bathrooms
- Heating & cooling: Gas forced air heating; Has heating
- Interior features: Partial basement; Varied flooring including carpet, hardwood and vinyl
Neighborhood map
What this means for you Summary
Snapshot
- This is a 6-bed/2.0-bath multifamily listed at $100k.
Deal economics
- At list price, monthly cash flow is $447 ($5k/yr) — positive.
- The deal already cash-flows at list — no discount required.
- Meets the 1% rule at list price ($2k rent vs $100k).
- Recommended offer: $97k (3.0% below list) — sets the bar for market timing.
- Cap rate 11.7% vs local median 8.0% in Olean — top-decile yield for the area; either an underpriced asset or a hidden risk that comps aren't pricing in. Stress-test before assuming the spread holds.
Location & tenants
- Location reads 72/100 on livability (#353 in NY) — a middle-class / working-renter tenant base. Strengths: cost of living A+, housing A+, health & safety A+; Watch: crime F, amenities F, commute F.
- Olean City School District (town): math 40% / reading 43% proficiency, ranked #511 of 590 in NY (top 87%) — families likely to look elsewhere, expect single-tenant / working-renter base with shorter leases.
- Market conditions: 141 active listings in the ZIP; 128 units permitted in Cattaraugus County in 2024 (21 in 5+ unit buildings).
Forward outlook
- Local home prices are declining (-3.0%/yr); year-one equity from $691 of loan paydown is wiped out by about $3k of value loss. Plan a longer hold.
- Cattaraugus County population projected at -28% by 2050 — secular population decline; favor cash flow + early exit over multi-decade hold.
- At projected returns (-3.0% appreciation + 3.0% rent growth), your $28k cash investment doubles in ~7 years — after that, you're playing with house money.
Negotiation context
- It's been on market 45 days — a 3% lower offer ($97k) is reasonable based on typical stale-listing flexibility.
- 4 sale attempts since 11y ago with the ask held roughly flat each time — persistent listings suggest the price (not the market) is what's stuck; bring a comps-based counter.
- Current owner paid $22k; list at $100k implies a 365% gain — meaningful room to come down on a strong offer.
Risks & watch-outs
- Watch-outs: built in 1890 — expect roof / HVAC / electrical / plumbing capex.
Questions for the listing agent
- It's been on market 45 days. Have you received any prior offers? Is the seller open to a 3% concession, seller financing, or rate buy-down credit?
- Built in 1890 — when were the roof, HVAC, electrical panel, plumbing, and water heater last replaced?
- Is there a deadline driving the sale (1031 exchange, divorce, estate, relocation)? That informs how much negotiation room exists.
- Schools are B-rated — typically a magnet for longer-tenancy family renters. What's the average tenant stay here, and is there a school-zone premium baked into asking?
- Crime grade is F in this area — have there been break-ins, vandalism, or insurance claims at this property in the last 3 years? What carrier currently insures it and at what premium?
- What's the average days-on-market for RENTAL listings here right now (not sales)? A rising rental-DOM trend means longer vacancies and softer asking-rent achievability than the comps imply.
- What's the recent tenant-quality profile in this submarket — average credit score on applications, eviction rate, late-payment / NSF rate, and stable-employment percentage? A property-management company in the area should have these aggregated.
- How much new apartment / multifamily construction is in the pipeline within 1–3 miles? Heavy new supply (>2% of stock underway) typically softens rents 12–24 months out; light construction supports rent growth.
Investment metrics
- 1% rule
- 1.51% ✓
- Cap rate
- 11.67%
- Cash-on-cash
- 19.20%
- DSCR
- 1.85
- GRM
- 5.5
CMA / ARV
- ARV (median comp)
- $181,147
- List price
- $99,900
- Delta
- -44.85%
- Verdict
- UNDERPRICED
- Comps
- 20 within 1.0 mi
Show comp detail 8 sales within ~0.75 mi
| Address | Dist | Beds/Ba | Sqft | Sold | Price | $/sf | Match |
|---|---|---|---|---|---|---|---|
| 207 N 11th St | 0.36mi | 5/2.0 (-1) | 2,452 (-6%) | 1mo | $123,000 | $50 | 67 |
| 135 N 6th St | 0.12mi | 6/2.0 | 2,957 (+14%) | 9mo | $140,000 | $47 | 64 |
| 128 S 8th St | 0.37mi | 5/2.5 (-1) | 2,448 (-6%) | 3mo | $60,000 | $25 | 63 |
| 316 W Henley St | 0.38mi | 6/2.0 | 2,304 (-12%) | 2mo | $75,000 | $33 | 61 |
| 611 W Henley St | 0.37mi | 5/3.0 (-1) | 2,470 (-5%) | 13mo | $115,000 | $47 | 54 |
| 218 N 15th St | 0.58mi | 5/3.5 (-1) | 2,566 (-1%) | 10mo | $105,000 | $41 | 51 |
| 216 N 15th St | 0.58mi | 7/3.0 (+1) | 2,370 (-9%) | 4mo | $90,000 | $38 | 45 |
| 1019 Spruce St #1 | 0.73mi | 5/4.0 (-1) | 2,608 (+0%) | 9mo | $40,000 | $15 | 45 |
Match score weights: distance 35% · size 25% · config 20% · recency 20%. Top-matched comps best support the ARV.
Projected returns pro-forma
-3.0% appreciation · 3.0% rent growth · sell at horizon
- IRR
- 11.2%
- Equity multiple
- 1.44×
- Total profit
- $12,367
- Equity at exit
- $14,895
- IRR
- 20.2%
- Equity multiple
- 2.70×
- Total profit
- $47,690
- Equity at exit
- $8,638
Cash invested: $27,972 (down + closing). Projections, not guarantees.
Landlord ↔ Tenant lean methodology
- Overall (STATE)
- 15 Strongly Tenant-Friendly
- State New York
- 15 Strongly Tenant-Friendly · D+10
- County
- — inherits STATE
- City
- — inherits STATE
ZIP-level market 14760
- Home prices YoY
- -7.7%
- Active inventory
- 141
- Price-to-rent
- 5.5×
Monthly cashflow live
- Estimated rent
- $1,506 medium interval (Pro) →
- Mortgage (P&I)
- −$524
- Tax from tax record
- −$177 /mo · $2,126/yr
- Insurance
- −$42
- HOA
- −$0
- Vacancy / Maint / Mgmt
- −$316
- Net cashflow
- $447
Break-even live
UW: 25.0% down · 7.5% · 30yr · 1.5% tax · 5.0% vac · 8.0% maint · 8.0% mgmt
Financing live
Cash to close
- Down payment
- $24,975
- Closing costs
- $2,997
- Reserves months
- —
- Total cash needed
- —
Loan-product check · same deal, 3 products live
Conventional
25% down · 7.5% · 30yr
- Down + closing
- —
- Monthly P&I
- —
- Monthly cashflow
- —
- DSCR
- —
- Eligible?
- —
Personal DTI + credit; lowest rate.
DSCR
20% down · 8.5% · 30yr
- Down + closing
- —
- Monthly P&I
- —
- Monthly cashflow
- —
- DSCR
- —
- Eligible?
- —
No personal income docs; deal must DSCR.
Hard money
10% down · 12.0% · 12mo
- Down + closing
- —
- Monthly P&I
- —
- Monthly cashflow
- —
- DSCR
- —
- Eligible?
- —
Short-term bridge; refi at stabilization.
Listing history 47 events
-
2026-06-18days on market $99,900 Active 45 DOM
-
2026-06-17days on market $99,900 Active 44 DOM
-
2026-06-16days on market $99,900 Active 43 DOM
-
2026-06-15days on market $99,900 Active 42 DOM
-
2026-06-13days on market $99,900 Active 40 DOM
-
2026-06-12days on market $99,900 Active 39 DOM
-
2026-06-09days on market $99,900 Active 36 DOM
-
2026-06-08days on market $99,900 Active 35 DOM
-
2026-06-07days on market $99,900 Active 34 DOM
-
2026-06-07days on market $99,900 Active 33 DOM
-
2026-06-04days on market $99,900 Active 30 DOM
-
2026-06-02days on market $99,900 Active 29 DOM
-
2026-06-01days on market $99,900 Active 28 DOM
-
2026-05-31days on market $99,900 Active 27 DOM
-
2026-04-29$99,900 Active
-
2018-01-08soldstatus $21,500 Closed Sale or Rented 276-char remark
Show marketing remark (276 chars)
Olean City: 2 unit home with 3 bedrooms in each unit. Close to Olean High School. This property is Bank Owned and they want a fast sale. They are offering Seller Financing with 10% Down and proof of Deposit. No minimum Credit score will be needed for Approval. Asking $27,900.
-
2017-12-28soldstatus $21,500
-
2017-12-20status Pending Sale 276-char remark
Show marketing remark (276 chars)
Olean City: 2 unit home with 3 bedrooms in each unit. Close to Olean High School. This property is Bank Owned and they want a fast sale. They are offering Seller Financing with 10% Down and proof of Deposit. No minimum Credit score will be needed for Approval. Asking $27,900.
-
2017-10-20historical Continue to Show- Under Contract 276-char remark
Show marketing remark (276 chars)
Olean City: 2 unit home with 3 bedrooms in each unit. Close to Olean High School. This property is Bank Owned and they want a fast sale. They are offering Seller Financing with 10% Down and proof of Deposit. No minimum Credit score will be needed for Approval. Asking $27,900.
-
2017-10-07$27,900 Active 276-char remark
Show marketing remark (276 chars)
Olean City: 2 unit home with 3 bedrooms in each unit. Close to Olean High School. This property is Bank Owned and they want a fast sale. They are offering Seller Financing with 10% Down and proof of Deposit. No minimum Credit score will be needed for Approval. Asking $27,900.
-
2017-10-03historical
-
2017-08-23price $28,900
-
2017-07-12price $29,900
-
2017-06-03price $30,900
-
2017-04-04status Active
-
2017-03-29historical
-
2017-03-20price $31,900
-
2016-12-29price $32,900
-
2016-11-29price $33,900
-
2016-10-21price $34,900
-
2016-09-26price $37,900
-
2016-09-01price $38,900
-
2016-07-25price $39,900
-
2016-06-21price $40,900
-
2016-06-02price $41,900
-
2016-05-18price $42,900
-
2016-05-03price $43,900
-
2016-03-18price $44,900
-
2016-02-25price $45,900
-
2016-02-05price $46,900
-
2016-01-21price $47,900
-
2016-01-05price $48,900
-
2015-12-16price $49,900
-
2015-12-02price $53,900
-
2015-11-10price $54,900
-
2015-09-29$59,900 Active
-
2006-04-03soldstatus $52,149
ⓘ Source: listings_history table (triggers on properties + properties_extension) + one-shot
backfill from property_details.listing_events for pre-trigger history.
Tax reassessment forecast NY · Partial reset (capped growth)
- Current annual tax
- $2,126 · $177/mo
- Projected year-2 tax
- $2,126 · $177/mo
- Expected delta
- $0/yr ($0/mo · 0.0%)
ⓘ Screening estimate from a state-policy table — verify with the county assessor before closing.
Climate risk First Street
- Flood 1/10 Low FEMA zone X · 0% chance over 30 yrs
- Wildfire 4/10 Moderate
- Heat 2/10 Low 8 d/yr ≥90°F today · 19 d/yr by 30 yrs out
- Wind 1/10 Low
- Air quality 1/10 Low 0 unhealthy d/yr today · 0 by 30 yrs out
Nearby sold comps map
Loading sold comps map…
Walkable amenities ~0.75 mi
Loading nearby amenities…
Taxation est. · year 1
- Rental income
- $18,078
- − Mortgage interest
- −$5,596
- − Property taxes
- −$2,126
- − Insurance
- −$500
- − Repairs & maintenance
- −$1,446
- − Management
- −$1,446
- − Depreciation
- −$2,906
- Taxable income
- $4,058
- Est. tax owed @ 24.0%
- −$974
- After-tax cash flow
- $4,396/yr
For passive investors: Depreciation is non-cash, so a rental often shows a tax loss while cash-flowing — sheltering income. Rental losses are passive: they offset passive income freely, and up to $25,000/yr can offset ordinary (W-2) income if you actively participate and your MAGI is under $100k (phasing out to $0 by $150k); unused losses carry forward. On sale, claimed depreciation is recaptured at up to 25%, and gains may owe capital-gains tax (a 1031 exchange can defer both). Figures are a year-1 estimate at your 24.0% rate — not tax advice; consult a CPA.
Schools (NCES district)
- District
- Olean City School District
- NCES district ID
- 3621720
- Math proficiency
- 40% ▼ -10.00%
- Reading proficiency
- 43% ▼ -3.00%
- Median HH income
- $40,365
- Composite
- 34.81/100
- National rank
- #5104
- State rank
- #511 of 590 in NY
Livability — Olean
- Score
- 72/100
- State rank
- #353
- US rank
- #5930
Category grades
Schools grade is shown separately in the Schools card above.
Census & demographics
- Census place
- Olean, NY
- City population
- 17,272
- Population (ZIP)
- 17,272
Population outlook (Cattaraugus County) Hauer SSP2
- Today (2025)
- 71,623 people
- By 2030
- 67,751 · -5.4%
- By 2040
- 59,488 · -16.9%
- By 2050
- 51,601 · -28.0%
- By 2075
- 35,025 · -51.1%
- By 2100
- 21,243 · -70.3%
Race, ethnicity, and origin ACS 2023
- Neighborhood character
- Predominantly White (89%)
- Race & ethnicity
- White 89% Two or more races 5% Black 2% Asian 2% Hispanic / Latino 1%
- Common ancestry
- Romanian 10% Iranian 2% Lithuanian 1%
- Foreign-born
- 3% · Canada
- Languages at home
- 97% English-only · Other Indo-European 1%
Political lean MEDSL · Cattaraugus
- 2024 margin
- Solid R (+32.8) · D 33.6% · R 66.4%
- 2008→2024 swing
- -22.2pp toward R · 2008: -10.6pp · 2024: -32.8pp
- All cycles
- 2024: R+32.8 2020: R+29.5 2016: R+34.4 2012: R+13.4 2008: R+10.6
Not yet ingested
- Civics
- —
Market trends
- HPI YoY
- ▼ -19.85%
- Current HPI
- 237.327
- Rent YoY
- —
- Metro
- —
- State GDP YoY
- ▲ 2.60%
- F500 in state
- 92
Industry mix (Fortune 500 HQ in NY)
| Industry | F500 HQs | Revenue |
|---|---|---|
| Financial Services | 10 | $950B |
|
||
| Consumer Goods | 9 | $162B |
|
||
| Insurance | 4 | $225B |
|
||
| Telecommunications | 2 | $144B |
|
||
| Pharmaceuticals | 2 | $112B |
|
||
| Media / Entertainment | 2 | $69B |
|
||
Price history
+91.6% since first listed33 events — show timeline
- 2026-04-29 Listed $99,900 UNYREIS
- 2018-01-08 Sold (MLS) $21,500 WNYREIS
- 2017-12-28 Sold (Public Records) $21,500 Public Records
- 2017-12-20 Pending — WNYREIS
- 2017-10-20 Contingent — WNYREIS
- 2017-10-07 Listed $27,900 WNYREIS
- 2017-10-03 Listing Removed — UNYREIS
- 2017-08-23 Price Changed $28,900 UNYREIS
- 2017-07-12 Price Changed $29,900 UNYREIS
- 2017-06-03 Price Changed $30,900 UNYREIS
- 2017-04-04 Relisted — UNYREIS
- 2017-03-29 Listing Removed — UNYREIS
- 2017-03-20 Price Changed $31,900 UNYREIS
- 2016-12-29 Price Changed $32,900 UNYREIS
- 2016-11-29 Price Changed $33,900 UNYREIS
- 2016-10-21 Price Changed $34,900 UNYREIS
- 2016-09-26 Price Changed $37,900 UNYREIS
- 2016-09-01 Price Changed $38,900 UNYREIS
- 2016-07-25 Price Changed $39,900 UNYREIS
- 2016-06-21 Price Changed $40,900 UNYREIS
- 2016-06-02 Price Changed $41,900 UNYREIS
- 2016-05-18 Price Changed $42,900 UNYREIS
- 2016-05-03 Price Changed $43,900 UNYREIS
- 2016-03-18 Price Changed $44,900 UNYREIS
- 2016-02-25 Price Changed $45,900 UNYREIS
- 2016-02-05 Price Changed $46,900 UNYREIS
- 2016-01-21 Price Changed $47,900 UNYREIS
- 2016-01-05 Price Changed $48,900 UNYREIS
- 2015-12-16 Price Changed $49,900 UNYREIS
- 2015-12-02 Price Changed $53,900 UNYREIS
- 2015-11-10 Price Changed $54,900 UNYREIS
- 2015-09-29 Listed $59,900 UNYREIS
- 2006-04-03 Sold (Public Records) $52,149 Public Records
Property tax history
+3.8%/yrLatest (2025): $2,126 · -38.9% YoY. Source: county tax records.
Cash-flow waterfall
monthlySold comps — $/sqft
last 12 mo · ≤1 miLoading sold comps…