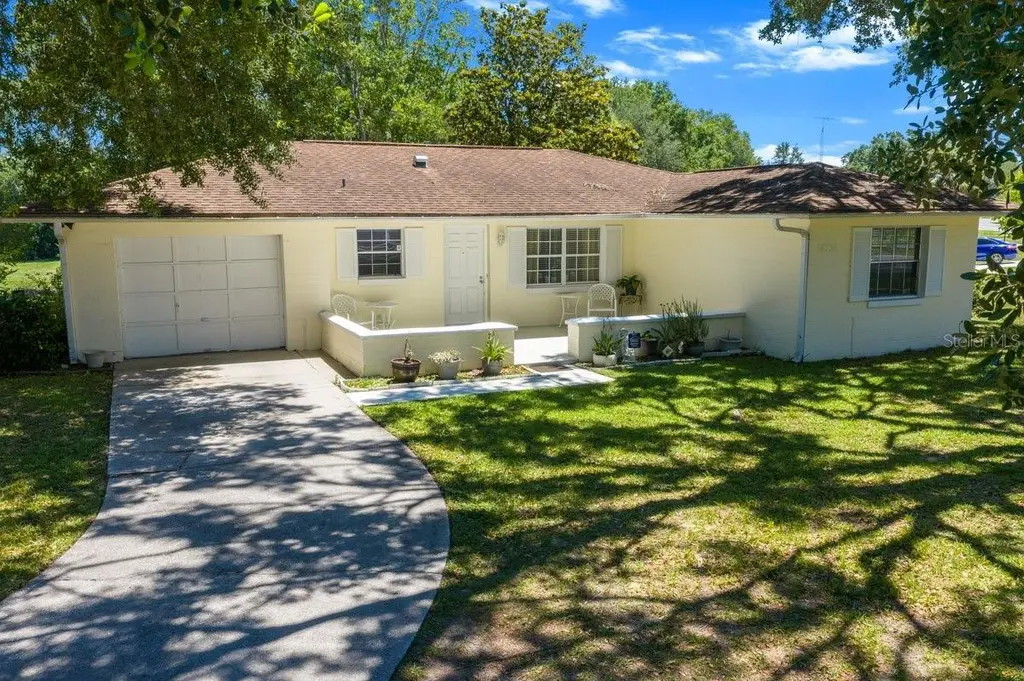
14753 SW 39th Cir · Marion Oaks, FL
Flood risk 5/10 · Moderate
- FEMA flood zone
- X (unshaded)
- Chance of flooding over 30 yrs
- 0.24%
- Est. flood insurance / yr
- $507 – $1,088
Fire risk 4/10 · Minor
- Est. fire insurance / yr
- $947 – $1,759
Heat risk 8/10 · Major
- Hot days now (above 108°F)
- 7 days/yr
- Hot days in 30 yrs
- 22 days/yr
Wind risk 9/10 · Severe
- Chance of severe wind over 30 yrs
- 99.0%
Air-quality risk 3/10 · Minor
- Unhealthy air days now
- 2 days/yr
- Unhealthy air days in 30 yrs
- 4 days/yr
Risk factors via First Street. Map © Google.
Why this score? — see what drove the C grade
The composite is a weighted blend of 9 inputs, each scored 0–100. Each bar is that input's sub-score; the figure is the points it added to the 100-point composite (weight × sub-score).
- Cash flow +21.1/30.0
- ARV discount +15.0/15.0
- DSCR +6.7/10.0
- 1% rule +4.6/10.0
- Schools +3.6/10.0
- Livability +2.5/5.0
- Condition / age +2.5/5.0
- Rent growth +2.3/5.0
- Appreciation +0.0/10.0
$189,000
🖨 Deal sheet (PDF) 📄 Offer letter ✓ Due diligence
Listing remarks
Under contract-accepting backup offers. Welcome to this solid 3-bedroom, 2-bathroom single-family home located on a spacious 0.28-acre corner lot in the desirable Marion Oaks community. Offering 1,421 square feet of living space, this 1979-built home is perfect for first-time buyers, investors, or anyone looking to add their personal touch and build equity. This single-story home features a functional layout with three good-sized bedrooms and two full bathrooms. While it needs cosmetic updates, it provides a strong foundation and excellent potential in a well-established neighborhood. Spacious 0.28-acre corner lot (over 12,000 sq ft) with excellent frontage and plenty of room for outdoor ac
Key facts
- Strong foundation
- Convenient access
- Spacious corner lot
Tags
Property features AI
Finance
- Other: Homestead claimed; Directions: CR 484 west, turn on Marion Oaks BLVD, turn on Marion Oaks Ln, turn on SW 39th Circle — home on corner
- HOA & community: No association indicated
Exterior
- Parking: Attached garage with 1 garage space
- Utilities: Public water; Public sewer; Cable connected; Electricity connected
- Home design: Single-family residence; One-story home; Faces southwest; Residential zoning (R1)
- Construction: Block and stucco construction; Shingle roof; Slab foundation; Built area approximately 1,421 living area (1,774 building area)
- Exterior features: Rain gutters; Sidewalk; Paved road access; Lot dimensions approximately 96 x 125; Lot about 0.28 acres (1/4 to less than 1/2 acre)
Interior
- Kitchen: Range; Refrigerator
- Bedrooms: 3 bedrooms
- Flooring: Tile
- Bathrooms: 2 full bathrooms
- Heating & cooling: Electric heating; Central air conditioning
- Interior features: Ceiling fans; Living room / dining room combo; Thermostat
- Laundry & utility: Laundry located in garage; Electric water heater
Neighborhood map
What this means for you Summary
Snapshot
- This is a 3-bed/2.0-bath single-family listed at $189k.
Deal economics
- At list price, monthly cash flow is $270 ($3k/yr) — positive.
- The deal already cash-flows at list — no discount required.
- To meet the 1% rule (rent ≥ 1% of price), the offer needs to be $181k (4.2% below list).
- Recommended offer: $181k (4.2% below list) — sets the bar for 1% rule.
- Cap rate 8.0% vs local median 4.8% in Marion Oaks — top-decile yield for the area; either an underpriced asset or a hidden risk that comps aren't pricing in. Stress-test before assuming the spread holds.
Location & tenants
- Location reads: area grade C — affects rentability + tenant quality, not the cash-flow math above.
- Marion (rural): math 42% / reading 43% proficiency, ranked #61 of 73 in FL (top 84%) — families likely to look elsewhere, expect single-tenant / working-renter base with shorter leases; 61% free/reduced lunch — lower-income household profile, screen leases tightly.
- Zoned schools: Sunrise Elementary School (math 43% / reading 34%, grade F, #1,575 of 2,144 statewide, top 74%, 1,017 students, 73% FRL); Horizon Academy At Marion Oaks (math 37% / reading 36%, grade F, #405 of 571 statewide, top 72%, 1,067 students, 68% FRL); Dunnellon High School (math 30% / reading 32%, grade F, #429 of 667 statewide, top 65%, 1,350 students, 63% FRL).
- Market conditions: Rents soft (-0.7%/yr); 1376 active listings in the ZIP; 40 comparable units currently listed for rent nearby; rentals at typical pace (median 23d on market — plan ~3-4 weeks tenant-placement turnaround); 7,071 units permitted in Marion County in 2024 (534 in 5+ unit buildings).
- This rent runs 30% of the median local income ($72k/yr) — at the standard rent-burdened threshold; future hikes will face affordability resistance.
Forward outlook
- Local home prices are declining (-3.0%/yr); year-one equity from $1k of loan paydown is wiped out by about $6k of value loss. Plan a longer hold.
- Marion County population projected at +13% by 2050 — modest demand growth; plan on rents tracking national, not racing it.
Negotiation context
- It's been on market 31 days — a 3% lower offer ($183k) is reasonable based on typical stale-listing flexibility.
- 2 sale attempts since 18y ago; this cycle's ask has dropped $20k (10%) from the opening price — seller is motivated, your offer sets the floor, not the list.
- Current owner paid $45k; list at $189k implies a 320% gain — meaningful room to come down on a strong offer.
Risks & watch-outs
- Climate carrying-cost: moderate flood risk; severe wind risk, 99% chance of damaging wind over 30y; extreme-heat days projected 7→22/yr by 2055 (HVAC capex compounding) — expect insurance premiums to compound above CPI over the hold.
Questions for the listing agent
- It's been on market 31 days. Have you received any prior offers? Is the seller open to a 4% concession, seller financing, or rate buy-down credit?
- Built in 1979 — when were the roof, HVAC, electrical panel, plumbing, and water heater last replaced?
- Is there a deadline driving the sale (1031 exchange, divorce, estate, relocation)? That informs how much negotiation room exists.
- What's the average days-on-market for RENTAL listings here right now (not sales)? A rising rental-DOM trend means longer vacancies and softer asking-rent achievability than the comps imply.
- What's the recent tenant-quality profile in this submarket — average credit score on applications, eviction rate, late-payment / NSF rate, and stable-employment percentage? A property-management company in the area should have these aggregated.
- How much new for-sale + rental construction is in the pipeline within 1–3 miles? Heavy new supply typically softens prices + rents 12–24 months out; constrained supply supports both.
Investment metrics
- 1% rule
- 0.96% ✗
- Cap rate
- 8.00%
- Cash-on-cash
- 6.11%
- DSCR
- 1.27
- GRM
- 8.7
CMA / ARV
- ARV (on-the-fly)
- $245,833
- Comps found
- 12
Show comp detail 12 sales within ~0.75 mi
| Address | Dist | Beds/Ba | Sqft | Sold | Price | $/sf | Match |
|---|---|---|---|---|---|---|---|
| 3573 SW 147th Lane Rd | 0.37mi | 3/2.0 | 1,328 (-6%) | 7mo | $179,900 | $135 | 66 |
| 4095 SW 144th St | 0.44mi | 3/2.0 | 1,483 (+4%) | 12mo | $206,000 | $139 | 62 |
| 14870 SW 43rd Ct | 0.46mi | 3/2.0 | 1,458 (+3%) | 15mo | $303,500 | $208 | 61 |
| 173 Marion Oaks Ln | 0.13mi | 2/2.0 (-1) | 1,289 (-9%) | 15mo | $159,000 | $123 | 61 |
| 4365 SW 151st St | 0.35mi | 3/2.0 | 1,315 (-8%) | 12mo | $269,900 | $205 | 61 |
| 14556 SW 45th Cir | 0.50mi | 3/2.0 | 1,378 (-3%) | 14mo | $238,900 | $173 | 60 |
| 14530 SW 35th Terrace Rd | 0.19mi | 2/2.0 (-1) | 1,325 (-7%) | 18mo | $199,000 | $150 | 60 |
| 14545 SW 34th Terrace Rd | 0.41mi | 3/2.0 | 1,285 (-10%) | 11mo | $178,000 | $139 | 56 |
| 14742 SW 43rd Terrace Rd | 0.45mi | 3/2.0 | 1,514 (+6%) | 15mo | $272,500 | $180 | 56 |
| 15011 SW 37th Ter | 0.29mi | 2/2.0 (-1) | 1,240 (-13%) | 18mo | $210,000 | $169 | 45 |
| 15068 SW 43rd Ct | 0.51mi | 3/2.0 | 1,246 (-12%) | 16mo | $250,000 | $201 | 42 |
| 15298 SW 43rd Avenue Rd | 0.71mi | 3/2.0 | 1,315 (-8%) | 15mo | $256,400 | $195 | 42 |
Match score weights: distance 35% · size 25% · config 20% · recency 20%. Top-matched comps best support the ARV.
Projected returns pro-forma
-3.0% appreciation · 0.0% rent growth · sell at horizon
- IRR
- -10.0%
- Equity multiple
- 0.64×
- Total profit
- $-18,824
- Equity at exit
- $28,181
- IRR
- -5.0%
- Equity multiple
- 0.72×
- Total profit
- $-15,042
- Equity at exit
- $16,341
Cash invested: $52,920 (down + closing). Projections, not guarantees.
Landlord ↔ Tenant lean methodology
- Overall (STATE)
- 87 Strongly Landlord-Friendly
- State Florida
- 87 Strongly Landlord-Friendly · R+3
- County
- — inherits STATE
- City
- — inherits STATE
ZIP-level market 34473
- Home prices YoY
- -16.8%
- Rents YoY
- -0.7%
- Active inventory
- 1376
- Price-to-rent
- 8.7×
Monthly cashflow live
- Estimated rent
- $1,811 high interval (Pro) →
- Mortgage (P&I)
- −$991
- Tax from tax record
- −$91 /mo · $1,094/yr
- Insurance
- −$79
- HOA
- −$0
- Vacancy / Maint / Mgmt
- −$380
- Net cashflow
- $270
Break-even live
Sensitivity live
| Price | -10% $377 | -5% $323 | +0% $270 | +5% $216 | +10% $163 |
|---|---|---|---|---|---|
| Rent | -10% $127 | -5% $198 | +0% $270 | +5% $341 | +10% $413 |
| Rate | -1.0pp $365 | -0.5pp $318 | base $270 | +0.5pp $221 | +1.0pp $171 |
UW: 25.0% down · 7.5% · 30yr · 1.5% tax · 5.0% vac · 8.0% maint · 8.0% mgmt
Financing live
Cash to close
- Down payment
- $47,250
- Closing costs
- $5,670
- Reserves months
- —
- Total cash needed
- —
Loan-product check · same deal, 3 products live
Conventional
25% down · 7.5% · 30yr
- Down + closing
- —
- Monthly P&I
- —
- Monthly cashflow
- —
- DSCR
- —
- Eligible?
- —
Personal DTI + credit; lowest rate.
DSCR
20% down · 8.5% · 30yr
- Down + closing
- —
- Monthly P&I
- —
- Monthly cashflow
- —
- DSCR
- —
- Eligible?
- —
No personal income docs; deal must DSCR.
Hard money
10% down · 12.0% · 12mo
- Down + closing
- —
- Monthly P&I
- —
- Monthly cashflow
- —
- DSCR
- —
- Eligible?
- —
Short-term bridge; refi at stabilization.
Rent comps 40 comps
| Address | Beds | Baths | Sqft | Rent | $/sqft | DOM | Units | Dist |
|---|---|---|---|---|---|---|---|---|
| 14856 SW 35th Cir Ocala, FL | 2.0 | 2.0 | 1036 | $1,450 | $1.40 | 15d | 1 | 0.26mi |
| 14430 SW 34th Terrace Rd Ocala, FL | 2.0 | 2.0 | 1025 | $1,350 | $1.32 | 15d | 1 | 0.37mi |
| 3567 SW 151st St Ocala, FL | 2.0 | 2.0 | 1126 | $1,450 | $1.29 | 22d | 1 | 0.40mi |
| 3500 SW 150th Lane Rd Ocala, FL | 3.0 | 2.0 | 1789 | $1,750 | $0.98 | 15d | 1 | 0.43mi |
| 14525 SW 42nd Terrace Rd Ocala, FL | 3.0 | 2.0 | 1344 | $1,850 | $1.38 | 15d | 1 | 0.50mi |
| 3313 SW 147th St Ocala, FL | 2.0 | 2.0 | 1121 | $1,400 | $1.25 | 22d | 1 | 0.51mi |
| 4309 SW 143rd Lane Rd Ocala, FL | 3.0 | 2.0 | 1238 | $1,799 | $1.45 | 15d | 1 | 0.62mi |
| 4484 SW 151st St Ocala, FL | 4.0 | 2.0 | 1578 | $1,750 | $1.11 | 22d | 1 | 0.65mi |
| 4572 SW 149th St Ocala, FL | 4.0 | 2.0 | 1751 | $1,950 | $1.11 | 22d | 1 | 0.66mi |
| 14614 SW 46th Ct Ocala, FL | 3.0 | 2.0 | 1200 | $1,800 | $1.50 | 22d | 1 | 0.76mi |
| 15415 SW 34th Ave Ocala, FL | 3.0 | 2.0 | 1650 | $1,895 | $1.15 | 22d | 1 | 0.77mi |
| 14919 SW 46th Cir Ocala, FL | 4.0 | 3.0 | 1870 | $2,000 | $1.07 | 15d | 1 | 0.77mi |
| 422 Marion Oaks Crse Ocala, FL | 4.0 | 2.0 | 1578 | $1,900 | $1.20 | 15d | 1 | 0.78mi |
| 15712 SW 37th Cir Ocala, FL | 3.0 | 2.0 | 1822 | $1,850 | $1.02 | 22d | 1 | 0.79mi |
| 2211 SW 153rd Place Rd Ocala, FL | 4.0 | 2.0 | 1730 | $2,000 | $1.16 | 22d | 1 | 0.80mi |
| 14193 SW 44th Ct Ocala, FL | 3.0 | 2.0 | 1449 | $1,599 | $1.10 | 15d | 1 | 0.82mi |
| 14843 SW 48th Ave Ocala, FL | 4.0 | 2.0 | 1573 | $1,725 | $1.10 | 22d | 1 | 0.85mi |
| 14965 SW 48th Ave Ocala, FL | 4.0 | 2.0 | 1342 | $1,700 | $1.27 | 15d | 1 | 0.88mi |
| 15568 SW 46th Cir Ocala, FL | 4.0 | 2.0 | 1833 | $2,200 | $1.20 | 15d | 1 | 0.88mi |
| 15018 SW 48th Ave Ocala, FL | 3.0 | 2.0 | 1413 | $1,625 | $1.15 | 15d | 1 | 0.91mi |
| 4004 SW 138th Pl Ocala, FL | 3.0 | 2.0 | 1348 | $1,695 | $1.26 | 22d | 1 | 0.94mi |
| 15729 SW 34th Court Rd Ocala, FL | 2.0 | 2.0 | 984 | $1,400 | $1.42 | 15d | 1 | 0.96mi |
| 15739 SW 34th Court Rd Ocala, FL | 2.0 | 2.0 | 984 | $1,400 | $1.42 | 15d | 1 | 0.97mi |
| 15209 SW 46th Cir Ocala, FL | 3.0 | 2.0 | 1691 | $1,650 | $0.98 | 22d | 1 | 0.98mi |
| 4967 SW 150th Ln Ocala, FL | 4.0 | 2.0 | 1696 | $1,950 | $1.15 | 22d | 1 | 1.03mi |
| 251 Marion Oaks Crse Ocala, FL | 3.0 | 2.0 | 1373 | $1,795 | $1.31 | 22d | 1 | 1.05mi |
| 14007 SW 30th Terrace Rd Ocala, FL | 3.0 | 2.0 | 1710 | $1,675 | $0.98 | 22d | 1 | 1.05mi |
| 15885 SW 35th Court Rd Unit 1 Ocala, FL | 3.0 | 2.0 | 1201 | $1,550 | $1.29 | 22d | 1 | 1.08mi |
| 2730 SW 145th Place Rd Ocala, FL | 3.0 | 2.0 | 1373 | $1,725 | $1.26 | 22d | 1 | 1.08mi |
| 15434 SW 29th Terrace Rd Ocala, FL | 3.0 | 2.0 | 1399 | $1,780 | $1.27 | 15d | 1 | 1.09mi |
| 15831 SW 34th Court Rd Ocala, FL | 3.0 | 2.0 | 1402 | $1,715 | $1.22 | 15d | 1 | 1.09mi |
| 15755 SW 33rd Avenue Rd Unit 1 Ocala, FL | 3.0 | 2.0 | 1107 | $1,300 | $1.17 | 22d | 1 | 1.10mi |
| 3011 SW 140th Loop Ocala, FL | 3.0 | 2.0 | 1335 | $1,695 | $1.27 | 22d | 1 | 1.11mi |
| 13731 SW 40th Cir Ocala, FL | 3.0 | 2.0 | 1463 | $1,695 | $1.16 | 15d | 1 | 1.12mi |
| 4605 SW 158th Street Rd Ocala, FL | 3.0 | 2.0 | 1710 | $1,695 | $0.99 | 22d | 1 | 1.15mi |
| 13805 SW 43rd Cir Ocala, FL | 4.0 | 2.0 | 1494 | $1,800 | $1.20 | 22d | 1 | 1.15mi |
| 14245 SW 28th Ct Ocala, FL | 4.0 | 2.0 | 1774 | $1,900 | $1.07 | 15d | 1 | 1.15mi |
| 2598 SW 147th Pl Ocala, FL | 3.0 | 2.0 | 1442 | $1,750 | $1.21 | 15d | 1 | 1.16mi |
| 2632 SW 145th Place Rd Ocala, FL | 3.0 | 2.0 | 1488 | $1,675 | $1.13 | 15d | 1 | 1.16mi |
| 2663 SW 152nd Ln Ocala, FL | 3.0 | 2.0 | 1212 | $1,600 | $1.32 | 15d | 1 | 1.17mi |
Listing history 22 events
-
2026-06-18status $189,000 Pending 31 DOM
-
2026-06-18days on market $189,000 Active 31 DOM
-
2026-06-17days on market $189,000 Active 30 DOM
-
2026-06-16days on market $189,000 Active 29 DOM
-
2026-06-15days on market $189,000 Active 28 DOM
-
2026-06-14days on market $189,000 Active 26 DOM
-
2026-06-13days on market $189,000 Active 25 DOM
-
2026-06-10days on market $189,000 Active 23 DOM
-
2026-06-09days on market $189,000 Active 22 DOM
-
2026-06-08days on market $189,000 Active 21 DOM
-
2026-06-07days on market $189,000 Active 20 DOM
-
2026-06-03days on market $189,000 Active 16 DOM
-
2026-06-02pricedays on market $189,000 Active 15 DOM
-
2026-06-01days on market $209,000 Active 14 DOM
-
2026-05-31days on market $209,000 Active 13 DOM
-
2026-05-30days on market $209,000 Active 12 DOM
-
2026-05-18$209,000 Active
-
2009-02-02historical
-
2008-02-04$118,590
-
2000-05-18soldstatus $45,000
-
1992-04-01soldstatus $49,000
-
1979-10-01soldstatus $47,700
ⓘ Source: listings_history table (triggers on properties + properties_extension) + one-shot
backfill from property_details.listing_events for pre-trigger history.
Tax reassessment forecast FL · Resets to sale price
- Current annual tax
- $1,094 · $91/mo
- Projected year-2 tax
- $1,569 · $131/mo
- Expected delta
- +$475/yr (+$40/mo · 43.4%)
ⓘ Screening estimate from a state-policy table — verify with the county assessor before closing.
Climate risk First Street
- Flood 5/10 Major FEMA zone X (unshaded) · 24% chance over 30 yrs
- Wildfire 4/10 Moderate
- Heat 8/10 Severe 7 d/yr ≥108°F today · 22 d/yr by 30 yrs out
- Wind 9/10 Extreme 99% chance of damaging wind over 30 yrs
- Air quality 3/10 Moderate 2 unhealthy d/yr today · 4 by 30 yrs out
Nearby sold comps map
Loading sold comps map…
Walkable amenities ~0.75 mi
Loading nearby amenities…
Taxation est. · year 1
- Rental income
- $21,731
- − Mortgage interest
- −$10,587
- − Property taxes
- −$1,094
- − Insurance
- −$945
- − Repairs & maintenance
- −$1,738
- − Management
- −$1,738
- − Depreciation
- −$5,498
- Taxable income
- $130
- Est. tax owed @ 24.0%
- −$31
- After-tax cash flow
- $3,204/yr
For passive investors: Depreciation is non-cash, so a rental often shows a tax loss while cash-flowing — sheltering income. Rental losses are passive: they offset passive income freely, and up to $25,000/yr can offset ordinary (W-2) income if you actively participate and your MAGI is under $100k (phasing out to $0 by $150k); unused losses carry forward. On sale, claimed depreciation is recaptured at up to 25%, and gains may owe capital-gains tax (a 1031 exchange can defer both). Figures are a year-1 estimate at your 24.0% rate — not tax advice; consult a CPA.
Schools (NCES district)
- District
- Marion
- NCES district ID
- 1201260
- Math proficiency
- 42% ▼ -7.00%
- Reading proficiency
- 43% ▼ -4.00%
- Median HH income
- $40,015
- Composite
- 35.61/100
- National rank
- #4890
- State rank
- #61 of 73 in FL
Livability — Marion Oaks
No livability data for this city. (Only ~50 U.S. cities are tracked.)
Census & demographics
- Census place
- Marion Oaks, FL
- County
- Marion County · 315,796 people
- City population
- 25,030
- Metro
- Ocala, FL
- Population (ZIP)
- 26,813
- Household income
- $72,366
- Rent vs Own
- Severe rent burden
- 228.0
Population outlook (Marion County) Hauer SSP2
- Today (2025)
- 365,905 people
- By 2030
- 376,768 · +3.0%
- By 2040
- 396,555 · +8.4%
- By 2050
- 412,723 · +12.8%
- By 2075
- 446,090 · +21.9%
- By 2100
- 436,193 · +19.2%
Race, ethnicity, and origin ACS 2023
- Neighborhood character
- Diverse neighborhood (Simpson 0.69)
- Race & ethnicity
- White 34% Black 33% Hispanic / Latino 29% Two or more races 19% Asian 1%
- Hispanic origin (detail)
- Mexican 1% Puerto Rican 17% Cuban 3%
- Common ancestry
- Hispanic 3% Portuguese 2% Romanian 1%
- Foreign-born
- 17% · Canada, Jamaica
- Languages at home
- 67% English-only · Spanish 27% French/Haitian/Cajun 4% Other Indo-European 1%
Political lean MEDSL · Marion
- 2024 margin
- Solid R (+31.6) · D 33.8% · R 65.5%
- 2008→2024 swing
- -20.0pp toward R · 2008: -11.6pp · 2024: -31.6pp
- All cycles
- 2024: R+31.6 2020: R+25.9 2016: R+26.2 2012: R+16.2 2008: R+11.6
Not yet ingested
- Civics
- —
Market trends
- HPI YoY
- ▼ -45.25%
- Current HPI
- 224.3536
- Rent YoY
- ▼ -0.67%
- Metro
- Ocala, FL
- State GDP YoY
- ▲ 3.28%
- F500 in state
- 36
Industry mix (Fortune 500 HQ in FL)
| Industry | F500 HQs | Revenue |
|---|---|---|
| Industrial Technology | 2 | $29B |
|
||
| Insurance | 2 | $17B |
|
||
| Retail | 1 | $60B |
|
||
| Technology Distribution | 1 | $58B |
|
||
| Homebuilding | 1 | $35B |
|
||
| Technology Manufacturing | 1 | $35B |
|
||
Price history
+296.2% since first listed8 events — show timeline
- 2026-06-18 Pending — Stellar MLS as Distributed by MLS Grid
- 2026-06-02 Price Changed $189,000 Stellar MLS as Distributed by MLS Grid
- 2026-05-18 Listed $209,000 Stellar MLS as Distributed by MLS Grid
- 2009-02-02 Listing Removed — Stellar MLS as Distributed by MLS Grid
- 2008-02-04 Listed $118,590 Stellar MLS as Distributed by MLS Grid
- 2000-05-18 Sold (Public Records) $45,000 Public Records
- 1992-04-01 Sold (Public Records) $49,000 Public Records
- 1979-10-01 Sold (Public Records) $47,700 Public Records
Property tax history
+0.7%/yrLatest (2025): $1,094 · +24.6% YoY. Source: county tax records.
Cash-flow waterfall
monthlySold comps — $/sqft
last 12 mo · ≤1 miLoading sold comps…