 Duplex
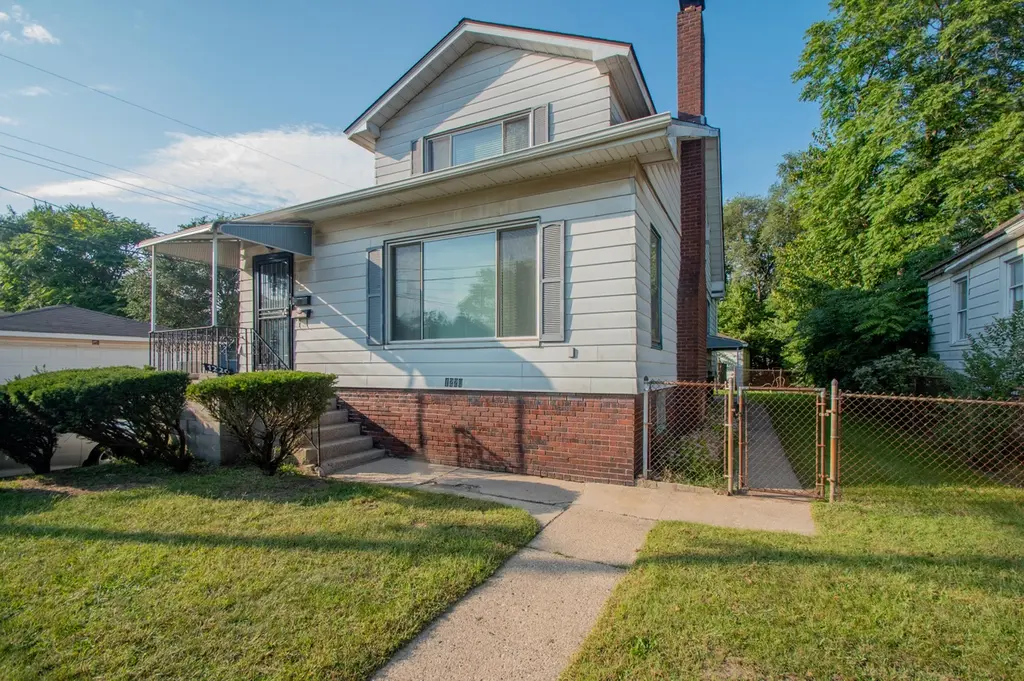
1220 W 41st Ave · Gary, IN
Flood risk 5/10 · Moderate
- FEMA flood zone
- X (unshaded)
- Chance of flooding over 30 yrs
- 0.66%
- Est. flood insurance / yr
- $507 – $1,088
Fire risk 1/10 · Minimal
- Est. fire insurance / yr
- $717 – $1,331
Heat risk 3/10 · Minor
- Hot days now (above 102°F)
- 7 days/yr
- Hot days in 30 yrs
- 15 days/yr
Wind risk 2/10 · Minimal
- Chance of severe wind over 30 yrs
- 0.0%
Air-quality risk 3/10 · Minor
- Unhealthy air days now
- 2 days/yr
- Unhealthy air days in 30 yrs
- 3 days/yr
Risk factors via First Street. Map © Google.
Why this score? — see what drove the D grade
The composite is a weighted blend of 9 inputs, each scored 0–100. Each bar is that input's sub-score; the figure is the points it added to the 100-point composite (weight × sub-score).
- Cash flow +17.3/30.0
- ARV discount +7.5/15.0
- DSCR +5.4/10.0
- 1% rule +4.3/10.0
- Livability +3.7/5.0
- Rent growth +2.5/5.0
- Condition / age +2.5/5.0
- Schools +0.5/10.0
- Appreciation +0.0/10.0
$219,900
🖨 Deal sheet 📄 Offer letter ✓ Due diligence
Multi-family units
County records classify this as Multi-Family (2-4 Unit). Listing-text estimate: 2 units. confirmed
Listing remarks MLS
GREAT INVESTMENT PROPERTY! Long time Owner has decided to sell and its Available to a New Owner! Property has been so well Maintained. Upper level has a long term tenant and is in great condition. Main Level has 2 Bedrooms, Large Living room with Fireplace (Decorative), Formal Dining room and Kitchen. Appliance stay on Main unit. Finished Basement with Egress windows. Fenced yard, 2 Car Garage. Low Taxes! Don't Miss This Great Opportunity!
Key facts
- Recently renovated
- 4,792 sq ft lot
- 2 garage spots
Tags
Property features AI
Exterior
- Parking: Alley access and on-street parking; Detached garage with 2 garage spaces
- Security: Smoke detector(s)
- Utilities: Public water; Public sewer
- Home design: Two-story building; Originally built in 1927
- Construction: Has a finished basement (daylight, walk-out access)
- Exterior features: Neighborhood view; Smoke detector(s)
Interior
- Kitchen: Gas range; Range hood; Refrigerator
- Bedrooms: Three-unit building with 1 efficiency, 1 one-bedroom unit and 1 two-bedroom unit
- Flooring: Carpet; Vinyl; Hardwood
- Bathrooms: Three full bathrooms (total)
- Heating & cooling: Central heating; No central cooling
- Interior features: Granite counters; Living room fireplace (1)
- Laundry & utility: Basement with daylight, walk-out access and finished space
Neighborhood map
What this means for you Summary
Snapshot
- This is a 2 × 1-bed/?-bath units multifamily listed at $220k.
Deal economics
- At list price, monthly cash flow is $163 ($2k/yr) — positive. Per door: $81/mo.
- The deal already cash-flows at list — no discount required.
- To meet the 1% rule (rent ≥ 1% of price), the offer needs to be $205k (6.6% below list).
- Recommended offer: $205k (6.6% below list) — sets the bar for 1% rule.
- Cap rate 7.2% vs local median 9.1% in Gary — below-typical yield; the buyer is paying a premium for something (appreciation thesis, condition, location) that the cap rate doesn't capture.
Location & tenants
- Location reads 73/100 on livability (#105 in IN) — a middle-class / working-renter tenant base. Strengths: commute A+, cost of living A+, housing A+; Watch: schools F, crime F, employment F.
- Gary Community School Corporation (urban): math 3% / reading 11% proficiency, ranked #299 of 301 in IN (top 99%) — low school quality limits family demand, transient renter base, plan for 1-2y turnover; 80% free/reduced lunch — lower-income household profile, screen leases tightly.
- Market conditions: 102 active listings in the ZIP; 6 comparable units currently listed for rent nearby; rentals leasing fast (median 11d on market — plan ~1-2 weeks tenant-placement turnaround); 1,642 units permitted in Lake County in 2024 (14 in 5+ unit buildings).
- At $2,054/mo this rent would consume 52% of the median local household income ($47k/yr) (locally 619% of renters already pay >50% of income on rent) — very limited rent-growth headroom before tenants either downsize or default.
Forward outlook
- Local home prices are declining (-3.0%/yr); year-one equity from $2k of loan paydown is wiped out by about $7k of value loss. Plan a longer hold.
- Lake County population projected to shrink 7% by 2050 — rents likely to lag national; underwrite the cash flow, not the appreciation.
Negotiation context
- Only 7 days on market — expect competitive offers; lowballing is unlikely to land.
- 7 sale attempts since 5y ago with the ask held roughly flat each time — persistent listings suggest the price (not the market) is what's stuck; bring a comps-based counter.
- Current owner paid $100k; list at $220k implies a 120% gain — meaningful room to come down on a strong offer.
Risks & watch-outs
- Watch-outs: built in 1927 — expect roof / HVAC / electrical / plumbing capex.
- Climate carrying-cost: moderate flood risk — expect insurance premiums to compound above CPI over the hold.
Questions for the listing agent
- Can we see the unit-by-unit rent roll, current vacancy, and any below-market leases? What's the average tenancy length?
- What capital expenditures (roof, boiler, parking lot, exteriors) have been made in the last 5 years, and what's planned in the next 2?
- Built in 1927 — when were the roof, HVAC, electrical panel, plumbing, and water heater last replaced?
- Is there a deadline driving the sale (1031 exchange, divorce, estate, relocation)? That informs how much negotiation room exists.
- Schools are F-rated, which usually means shorter tenancies and higher turnover. Who's the typical renter profile here, and what's been the actual vacancy rate?
- Crime grade is F in this area — have there been break-ins, vandalism, or insurance claims at this property in the last 3 years? What carrier currently insures it and at what premium?
- The area grade is low — what's the realistic commute time and amenity access for the typical tenant pool here? Any planned neighborhood developments (good or bad) we should know about?
- What's the average days-on-market for RENTAL listings here right now (not sales)? A rising rental-DOM trend means longer vacancies and softer asking-rent achievability than the comps imply.
- What's the recent tenant-quality profile in this submarket — average credit score on applications, eviction rate, late-payment / NSF rate, and stable-employment percentage? A property-management company in the area should have these aggregated.
- How much new apartment / multifamily construction is in the pipeline within 1–3 miles? Heavy new supply (>2% of stock underway) typically softens rents 12–24 months out; light construction supports rent growth.
Investment metrics
- 1% rule
- 0.93% ✗
- Cap rate
- 7.18%
- Cash-on-cash
- 3.17%
- DSCR
- 1.14
- GRM
- 8.9
CMA / ARV
No comps found within radius.
Projected returns pro-forma
-3.0% appreciation · 3.0% rent growth · sell at horizon
- IRR
- -11.3%
- Equity multiple
- 0.59×
- Total profit
- $-25,272
- Equity at exit
- $32,788
- IRR
- -2.1%
- Equity multiple
- 0.86×
- Total profit
- $-8,681
- Equity at exit
- $19,013
Cash invested: $61,572 (down + closing). Projections, not guarantees.
Landlord ↔ Tenant lean methodology
- Overall (STATE)
- 90 Strongly Landlord-Friendly
- State Indiana
- 90 Strongly Landlord-Friendly · R+11
- County
- — inherits STATE
- City
- — inherits STATE
ZIP-level market 46408
- Home prices YoY
- -31.6%
- Active inventory
- 102
- Price-to-rent
- 17.8×
Monthly cashflow live
- Estimated rent
- $2,054 high interval (Pro) →
- Mortgage (P&I)
- −$1,153
- Tax from tax record
- −$215 /mo · $2,581/yr
- Insurance
- −$92
- HOA
- −$0
- Vacancy / Maint / Mgmt
- −$431
- Net cashflow
- $163
Break-even live
2-unit breakdown (identical units grouped — click to expand)
| Units | Beds | Baths | Est. rent |
|---|---|---|---|
| 2× units | 1 | — | $2,054 |
| #1 | 1 | — | $1,027 |
| #2 | 1 | — | $1,027 |
| Total (2 units) | $2,054 | ||
UW: 25.0% down · 7.5% · 30yr · 1.5% tax · 5.0% vac · 8.0% maint · 8.0% mgmt
Financing live
Cash to close
- Down payment
- $54,975
- Closing costs
- $6,597
- Reserves months
- —
- Total cash needed
- —
Loan-product check · same deal, 3 products live
Conventional
25% down · 7.5% · 30yr
- Down + closing
- —
- Monthly P&I
- —
- Monthly cashflow
- —
- DSCR
- —
- Eligible?
- —
Personal DTI + credit; lowest rate.
DSCR
20% down · 8.5% · 30yr
- Down + closing
- —
- Monthly P&I
- —
- Monthly cashflow
- —
- DSCR
- —
- Eligible?
- —
No personal income docs; deal must DSCR.
Hard money
10% down · 12.0% · 12mo
- Down + closing
- —
- Monthly P&I
- —
- Monthly cashflow
- —
- DSCR
- —
- Eligible?
- —
Short-term bridge; refi at stabilization.
Rent comps 6 comps
| Address | Beds | Baths | Sqft | Rent | $/sqft | DOM | Units | Dist |
|---|---|---|---|---|---|---|---|---|
| 4208 Jackson St Gary, IN | 3.0 | 1.0 | 1411 | $1,350 | $0.96 | 44d | 1 | 0.39mi |
| 3612 Van Buren St Gary, IN | 3.0 | 1.0 | 1534 | $1,600 | $1.04 | 1d | 1 | 0.67mi |
| 4767 Harrison St Gary, IN | 3.0 | 1.0 | 1664 | $1,500 | $0.90 | 1d | 1 | 0.89mi |
| 4772 Jefferson St Gary, IN | 3.0 | 2.0 | 1956 | $1,595 | $0.82 | 18d | 1 | 1.02mi |
| 4854 Jefferson St Gary, IN | 3.0 | 1.0 | 2116 | $1,395 | $0.66 | 1d | 1 | 1.11mi |
| 4854 Jefferson St Gary, IN | 3.0 | 1.0 | 2116 | $1,395 | $0.66 | 10d | 1 | 1.11mi |
Listing history 7 events
-
2026-06-18days on market $219,900 Active 7 DOM
-
2026-06-17days on market $219,900 Active 6 DOM
-
2026-06-16days on market $219,900 Active 5 DOM
-
2026-06-15days on market $219,900 Active 4 DOM
-
2026-06-13days on market $219,900 Active 2 DOM
-
2026-06-13remarks 210-char remark
-
2026-06-13$219,900 Active 1 DOM
ⓘ Source: listings_history table (triggers on properties + properties_extension) + one-shot
backfill from property_details.listing_events for pre-trigger history.
Tax reassessment forecast IN · Partial reset (capped growth)
- Current annual tax
- $2,581 · $215/mo
- Projected year-2 tax
- $2,581 · $215/mo
- Expected delta
- $0/yr ($0/mo · 0.0%)
ⓘ Screening estimate from a state-policy table — verify with the county assessor before closing.
Climate risk First Street
- Flood 5/10 Major FEMA zone X (unshaded) · 66% chance over 30 yrs
- Wildfire 1/10 Low
- Heat 3/10 Moderate 7 d/yr ≥102°F today · 15 d/yr by 30 yrs out
- Wind 2/10 Low 0% chance of damaging wind over 30 yrs
- Air quality 3/10 Moderate 2 unhealthy d/yr today · 3 by 30 yrs out
Nearby sold comps map
Loading sold comps map…
Walkable amenities ~0.75 mi
Loading nearby amenities…
Taxation est. · year 1
- Rental income
- $24,648
- − Mortgage interest
- −$12,318
- − Property taxes
- −$2,581
- − Insurance
- −$1,100
- − Repairs & maintenance
- −$1,972
- − Management
- −$1,972
- − Depreciation
- −$6,397
- Taxable loss
- −$1,691
- Est. tax savings @ 24.0%
- +$406
- After-tax cash flow
- $2,359/yr
For passive investors: Depreciation is non-cash, so a rental often shows a tax loss while cash-flowing — sheltering income. Rental losses are passive: they offset passive income freely, and up to $25,000/yr can offset ordinary (W-2) income if you actively participate and your MAGI is under $100k (phasing out to $0 by $150k); unused losses carry forward. On sale, claimed depreciation is recaptured at up to 25%, and gains may owe capital-gains tax (a 1031 exchange can defer both). Figures are a year-1 estimate at your 24.0% rate — not tax advice; consult a CPA.
Schools (NCES district)
- District
- Gary Community School Corporation
- NCES district ID
- 1803870
- Math proficiency
- 3% ▼ -10.00%
- Reading proficiency
- 11% ▼ -6.00%
- Median HH income
- $27,739
- Composite
- 4.98/100
- National rank
- #10039
- State rank
- #299 of 301 in IN
Livability — Gary
- Score
- 73/100
- State rank
- #105
- US rank
- #5592
Category grades
Schools grade is shown separately in the Schools card above.
Census & demographics
- Census place
- Gary, IN
- County
- Lake County · 422,878 people
- City population
- 63,701
- Metro
- Chicago-Naperville-Elgin, IL-IN-WI
- Population (ZIP)
- 15,747
- Household income
- $47,453
- Rent vs Own
- Severe rent burden
- 619.0
Population outlook (Lake County) Hauer SSP2
- Today (2025)
- 484,026 people
- By 2030
- 478,091 · -1.2%
- By 2040
- 462,974 · -4.3%
- By 2050
- 449,894 · -7.1%
- By 2075
- 436,169 · -9.9%
- By 2100
- 426,607 · -11.9%
Race, ethnicity, and origin ACS 2023
- Neighborhood character
- Diverse neighborhood (Simpson 0.68)
- Race & ethnicity
- Black 41% White 32% Hispanic / Latino 22% Two or more races 12%
- Hispanic origin (detail)
- Mexican 14% Puerto Rican 7%
- Common ancestry
- Romanian 5% Iranian 1% Slovak 1%
- Foreign-born
- 4% · Canada, China
- Languages at home
- 87% English-only · Spanish 12% Chinese 1%
Political lean MEDSL · Lake
- 2024 margin
- Lean D (+5.6) · D 52.1% · R 46.5% · Other 1.5%
- 2008→2024 swing
- -28.6pp toward R · 2008: 34.3pp · 2024: 5.6pp
- All cycles
- 2024: D+5.6 2020: D+15.1 2016: D+20.6 2012: D+31.0 2008: D+34.3
Not yet ingested
- Civics
- —
Market trends
- HPI YoY
- ▼ -72.08%
- Current HPI
- 155.6238
- Rent YoY
- —
- Metro
- Chicago-Naperville-Elgin, IL-IN-WI
- State GDP YoY
- ▲ 2.90%
- F500 in state
- 18
Industry mix (Fortune 500 HQ in IN)
| Industry | F500 HQs | Revenue |
|---|---|---|
| Industrial Machinery | 2 | $37B |
|
||
| Healthcare | 1 | $177B |
|
||
| Pharmaceuticals | 1 | $45B |
|
||
| Metals / Steel | 1 | $18B |
|
||
| Agriculture | 1 | $17B |
|
||
| Packaging | 1 | $12B |
|
||
Price history
+120.1% since first listed13 events — show timeline
- 2026-06-11 Listed $219,900 NIRA MLS as Distributed by MLS Grid
- 2026-05-26 Rental Removed $695 RENTALBEAST
- 2026-04-27 Listed for Rent $695 RENTALBEAST
- 2026-04-25 Price Changed $795 RENTALBEAST
- 2026-03-13 Listed for Rent $695 RENTALBEAST
- 2024-11-10 Rental Removed $695 LEASESTAR
- 2024-11-05 Listed for Rent $695 LEASESTAR
- 2024-04-14 Rental Removed — BUILDIUM
- 2024-03-16 Listed for Rent — BUILDIUM
- 2023-12-29 Rental Removed — BUILDIUM
- 2023-11-04 Listed for Rent — BUILDIUM
- 2021-08-31 Sold (MLS) $99,900 NIRA MLS as Distributed by MLS Grid
- 2021-08-10 Listed $99,900 NIRA MLS as Distributed by MLS Grid
Property tax history
-1.7%/yrLatest (2024): $2,581 · +78.0% YoY. Source: county tax records.
Cash-flow waterfall
monthlySold comps — $/sqft
last 12 mo · ≤1 miLoading sold comps…