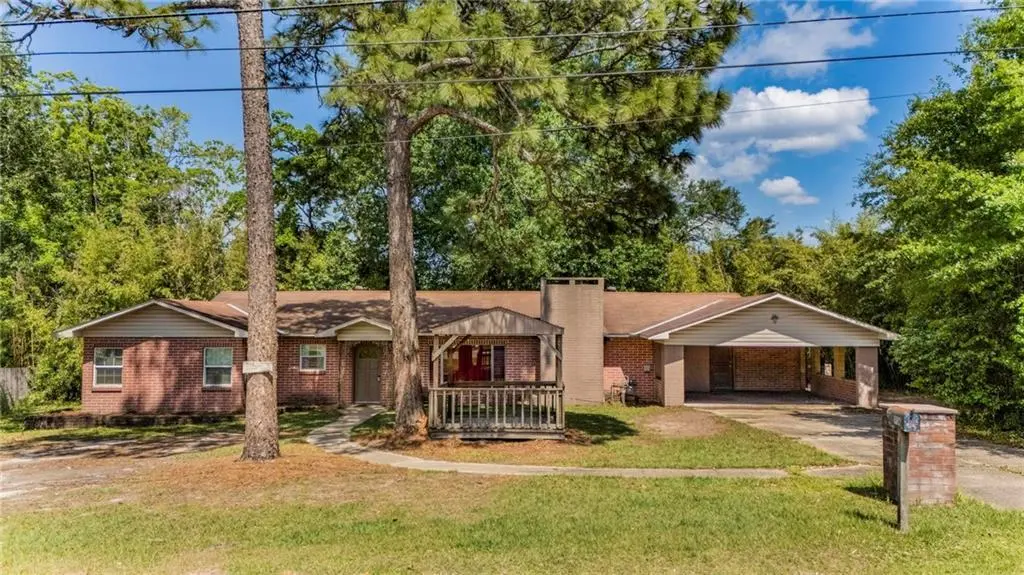
916 Leon St · Saraland, AL
Flood risk 1/10 · Minimal
- FEMA flood zone
- X (unshaded)
- Chance of flooding over 30 yrs
- 0.0%
- Est. flood insurance / yr
- $507 – $1,088
Fire risk 4/10 · Minor
- Est. fire insurance / yr
- $916 – $1,700
Heat risk 9/10 · Severe
- Hot days now (above 104°F)
- 7 days/yr
- Hot days in 30 yrs
- 22 days/yr
Wind risk 9/10 · Severe
- Chance of severe wind over 30 yrs
- 99.0%
Air-quality risk 2/10 · Minimal
- Unhealthy air days now
- 1 days/yr
- Unhealthy air days in 30 yrs
- 2 days/yr
Risk factors via First Street. Map © Google.
Why this score? — see what drove the C grade
The composite is a weighted blend of 9 inputs, each scored 0–100. Each bar is that input's sub-score; the figure is the points it added to the 100-point composite (weight × sub-score).
- Cash flow +17.9/30.0
- ARV discount +15.0/15.0
- DSCR +5.6/10.0
- Schools +5.3/10.0
- 1% rule +4.4/10.0
- Livability +3.4/5.0
- Rent growth +2.5/5.0
- Condition / age +2.5/5.0
- Appreciation +0.0/10.0
$169,000
🖨 Deal sheet 📄 Offer letter ✓ Due diligence
Listing remarks
Great opportunity in the sought-after Saraland School district! Motivated Seller! Bring All Offers! This spacious 3-bedroom, 2-bathroom, home offers approximately 2,028 sq. ft. and is full of potential for investors, flippers, or buyers looking to make it their own. With home having been a rental property for over 10 years, this property is a solid investment opportunity. Inside, you'll find a large family room featuring a cozy wood-burning fireplace, a spacious kitchen with abundant cabinet storage, breakfast bar, and a separate laundry room for added convenience. Ceramic tile runs throughout the main living areas, with carpet in the bedrooms. The screened sunroom which is located on the b
Key facts
- Sunroom
- Park and splash pad
- 0.37 acre lot
Tags
Property features AI
Exterior
- Parking: Carport (2 spaces)
- Utilities: Cable available; Electricity available (110V and 220V); Natural gas available; Phone available; Public sewer; Water available
- Home design: Single family residence; Residential property
- Construction: Brick on all sides; Shingle roof; Built in 1959; Slab foundation
- Exterior features: Back yard fencing; Property has a view; No pool or spa
Interior
- Kitchen: Dishwasher; Electric cooktop; Electric oven
- Bedrooms: 3 bedrooms
- Flooring: Carpet; Ceramic tile
- Bathrooms: 2 full bathrooms
- Heating & cooling: Central heating; Window unit cooling
- Interior features: Built-in bookcases; Wood-burning stove fireplace; Dining L area; Breakfast bar
Neighborhood map
What this means for you Summary
Snapshot
- This is a 3-bed/2.0-bath single-family listed at $169k.
Deal economics
- At list price, monthly cash flow is $143 ($2k/yr) — positive.
- The deal already cash-flows at list — no discount required.
- To meet the 1% rule (rent ≥ 1% of price), the offer needs to be $158k (6.4% below list).
- Recommended offer: $158k (6.4% below list) — sets the bar for 1% rule.
- Cap rate 7.3% vs local median 3.9% in Saraland — top-decile yield for the area; either an underpriced asset or a hidden risk that comps aren't pricing in. Stress-test before assuming the spread holds.
Location & tenants
- Location reads 68/100 on livability (#72 in AL) — a middle-class / working-renter tenant base. Strengths: cost of living A+, housing A+, crime A; Watch: amenities F, commute F, health & safety F.
- Saraland City (suburban): math 53% / reading 71% proficiency, ranked #6 of 129 in AL (top 5%) — acceptable for families but not a draw, mixed tenant base, ~2y average lease.
- Zoned schools: Saraland Elementary School (math 71% / reading 82%, grade A, #12 of 627 statewide, top 2%, 958 students, 49% FRL); Saraland High School (math 34% / reading 48%, grade F, #31 of 305 statewide, top 10%, 1,096 students, 50% FRL).
- Market conditions: 173 active listings in the ZIP; 1 comparable units currently listed for rent nearby; 1,678 units permitted in Mobile County in 2024 (264 in 5+ unit buildings).
- This rent runs 31% of the median local income ($62k/yr) — at the standard rent-burdened threshold; future hikes will face affordability resistance.
Forward outlook
- Local home prices are declining (-3.0%/yr); year-one equity from $1k of loan paydown is wiped out by about $5k of value loss. Plan a longer hold.
- Mobile County population projected to shrink 8% by 2050 — rents likely to lag national; underwrite the cash flow, not the appreciation.
Negotiation context
- It's been on market 25 days — a 2% lower offer ($166k) is reasonable based on typical stale-listing flexibility.
Risks & watch-outs
- Watch-outs: built in 1959 — expect roof / HVAC / electrical / plumbing capex.
- Climate carrying-cost: severe wind risk, 99% chance of damaging wind over 30y; extreme-heat days projected 7→22/yr by 2055 (HVAC capex compounding) — expect insurance premiums to compound above CPI over the hold.
Questions for the listing agent
- Built in 1959 — when were the roof, HVAC, electrical panel, plumbing, and water heater last replaced?
- Is there a deadline driving the sale (1031 exchange, divorce, estate, relocation)? That informs how much negotiation room exists.
- What's the average days-on-market for RENTAL listings here right now (not sales)? A rising rental-DOM trend means longer vacancies and softer asking-rent achievability than the comps imply.
- What's the recent tenant-quality profile in this submarket — average credit score on applications, eviction rate, late-payment / NSF rate, and stable-employment percentage? A property-management company in the area should have these aggregated.
- How much new for-sale + rental construction is in the pipeline within 1–3 miles? Heavy new supply typically softens prices + rents 12–24 months out; constrained supply supports both.
Investment metrics
- 1% rule
- 0.94% ✗
- Cap rate
- 7.31%
- Cash-on-cash
- 3.63%
- DSCR
- 1.16
- GRM
- 8.9
CMA / ARV
- ARV (median comp)
- $236,297
- List price
- $169,000
- Delta
- -28.48%
- Verdict
- UNDERPRICED
- Comps
- 20 within 1.0 mi
Show comp detail 9 sales within ~0.75 mi
| Address | Dist | Beds/Ba | Sqft | Sold | Price | $/sf | Match |
|---|---|---|---|---|---|---|---|
| 1113 4th Ave | 0.36mi | 3/2.0 | 1,971 (-3%) | 10mo | $187,000 | $95 | 70 |
| 1014 4th Ave | 0.25mi | 4/2.0 (+1) | 1,890 (-7%) | 8mo | $125,000 | $66 | 66 |
| 906 Edgefield Dr W | 0.51mi | 3/2.0 | 1,841 (-9%) | 3mo | $275,000 | $149 | 58 |
| 427 Strange Ave | 0.73mi | 3/2.0 | 2,000 (-1%) | 12mo | $282,900 | $141 | 54 |
| 108 Craig Dr | 0.49mi | 3/2.0 | 1,743 (-14%) | 6mo | $269,900 | $155 | 49 |
| 629 Pine St | 0.54mi | 3/2.0 | 1,749 (-14%) | 6mo | $273,000 | $156 | 47 |
| 1114 Timothy St | 0.43mi | 4/2.0 (+1) | 1,850 (-9%) | 20mo | $222,500 | $120 | 44 |
| 420 3rd Ave | 0.59mi | 4/2.0 (+1) | 1,781 (-12%) | 10mo | $272,500 | $153 | 38 |
| 510 Strange Ave | 0.66mi | 4/2.0 (+1) | 1,896 (-6%) | 23mo | $130,000 | $69 | 34 |
Match score weights: distance 35% · size 25% · config 20% · recency 20%. Top-matched comps best support the ARV.
Projected returns pro-forma
-3.0% appreciation · 3.0% rent growth · sell at horizon
- IRR
- -10.6%
- Equity multiple
- 0.61×
- Total profit
- $-18,279
- Equity at exit
- $25,198
- IRR
- -1.3%
- Equity multiple
- 0.91×
- Total profit
- $-4,230
- Equity at exit
- $14,612
Cash invested: $47,320 (down + closing). Projections, not guarantees.
Landlord ↔ Tenant lean methodology
- Overall (STATE)
- 90 Strongly Landlord-Friendly
- State Alabama
- 90 Strongly Landlord-Friendly · R+15
- County
- — inherits STATE
- City
- — inherits STATE
ZIP-level market 36571
- Home prices YoY
- -13.1%
- Active inventory
- 173
- Price-to-rent
- 8.9×
Monthly cashflow live
- Estimated rent
- $1,582 medium interval (Pro) →
- Mortgage (P&I)
- −$886
- Tax from tax record
- −$150 /mo · $1,802/yr
- Insurance
- −$70
- HOA
- −$0
- Vacancy / Maint / Mgmt
- −$332
- Net cashflow
- $143
Break-even live
UW: 25.0% down · 7.5% · 30yr · 1.5% tax · 5.0% vac · 8.0% maint · 8.0% mgmt
Financing live
Cash to close
- Down payment
- $42,250
- Closing costs
- $5,070
- Reserves months
- —
- Total cash needed
- —
Loan-product check · same deal, 3 products live
Conventional
25% down · 7.5% · 30yr
- Down + closing
- —
- Monthly P&I
- —
- Monthly cashflow
- —
- DSCR
- —
- Eligible?
- —
Personal DTI + credit; lowest rate.
DSCR
20% down · 8.5% · 30yr
- Down + closing
- —
- Monthly P&I
- —
- Monthly cashflow
- —
- DSCR
- —
- Eligible?
- —
No personal income docs; deal must DSCR.
Hard money
10% down · 12.0% · 12mo
- Down + closing
- —
- Monthly P&I
- —
- Monthly cashflow
- —
- DSCR
- —
- Eligible?
- —
Short-term bridge; refi at stabilization.
Rent comps 1 comps
| Address | Beds | Baths | Sqft | Rent | $/sqft | DOM | Units | Dist |
|---|---|---|---|---|---|---|---|---|
| 916 Shelton Beach Rd Saraland, AL | 4.0 | 2.0 | 1713 | $1,950 | $1.14 | 13d | 1 | 1.44mi |
Listing history 9 events
-
2026-06-09status $169,000 Pending 25 DOM
-
2026-06-08days on market $169,000 Active 25 DOM
-
2026-06-07days on market $169,000 Active 24 DOM
-
2026-06-03pricedays on market $169,000 Active 20 DOM
-
2026-06-02days on market $179,000 Active 19 DOM
-
2026-06-01days on market $179,000 Active 18 DOM
-
2026-05-31days on market $179,000 Active 17 DOM
-
2026-05-30days on market $179,000 Active 16 DOM
-
2026-05-14$189,000 Active 1248-char remark
ⓘ Source: listings_history table (triggers on properties + properties_extension) + one-shot
backfill from property_details.listing_events for pre-trigger history.
Tax reassessment forecast AL · Resets to sale price
- Current annual tax
- $1,802 · $150/mo
- Projected year-2 tax
- $1,802 · $150/mo
- Expected delta
- $0/yr ($0/mo · 0.0%)
ⓘ Screening estimate from a state-policy table — verify with the county assessor before closing.
Climate risk First Street
- Flood 1/10 Low FEMA zone X (unshaded) · 0% chance over 30 yrs
- Wildfire 4/10 Moderate
- Heat 9/10 Extreme 7 d/yr ≥104°F today · 22 d/yr by 30 yrs out
- Wind 9/10 Extreme 99% chance of damaging wind over 30 yrs
- Air quality 2/10 Low 1 unhealthy d/yr today · 2 by 30 yrs out
Nearby sold comps map
Loading sold comps map…
Walkable amenities ~0.75 mi
Loading nearby amenities…
Taxation est. · year 1
- Rental income
- $18,987
- − Mortgage interest
- −$9,467
- − Property taxes
- −$1,802
- − Insurance
- −$845
- − Repairs & maintenance
- −$1,519
- − Management
- −$1,519
- − Depreciation
- −$4,916
- Taxable loss
- −$1,080
- Est. tax savings @ 24.0%
- +$259
- After-tax cash flow
- $1,977/yr
For passive investors: Depreciation is non-cash, so a rental often shows a tax loss while cash-flowing — sheltering income. Rental losses are passive: they offset passive income freely, and up to $25,000/yr can offset ordinary (W-2) income if you actively participate and your MAGI is under $100k (phasing out to $0 by $150k); unused losses carry forward. On sale, claimed depreciation is recaptured at up to 25%, and gains may owe capital-gains tax (a 1031 exchange can defer both). Figures are a year-1 estimate at your 24.0% rate — not tax advice; consult a CPA.
Schools (NCES district)
- District
- Saraland City
- NCES district ID
- 0100185
- Math proficiency
- 53% ▼ -16.00%
- Reading proficiency
- 71% ▲ 7.00%
- Median HH income
- $51,173
- Composite
- 52.78/100
- National rank
- #1539
- State rank
- #6 of 129 in AL
Livability — Saraland
- Score
- 68/100
- State rank
- #72
- US rank
- #9880
Category grades
Schools grade is shown separately in the Schools card above.
Census & demographics
- Census place
- Saraland, AL
- County
- Mobile County · 246,577 people
- City population
- 17,143
- Metro
- Mobile, AL
- Population (ZIP)
- 17,143
- Household income
- $62,047
- Rent vs Own
- Severe rent burden
- 432.0
Population outlook (Mobile County) Hauer SSP2
- Today (2025)
- 415,303 people
- By 2030
- 411,755 · -0.9%
- By 2040
- 399,670 · -3.8%
- By 2050
- 382,616 · -7.9%
- By 2075
- 337,353 · -18.8%
- By 2100
- 283,391 · -31.8%
Race, ethnicity, and origin ACS 2023
- Neighborhood character
- Predominantly White (79%)
- Race & ethnicity
- White 79% Black 16% Two or more races 3%
- Common ancestry
- Italian 3% Lithuanian 2% Slovak 2%
- Foreign-born
- 1% · China
Political lean MEDSL · Mobile
- 2024 margin
- R (+16.4) · D 41.3% · R 57.7%
- 2008→2024 swing
- -7.7pp toward R · 2008: -8.7pp · 2024: -16.4pp
- All cycles
- 2024: R+16.4 2020: R+11.9 2016: R+13.9 2012: R+9.3 2008: R+8.7
Not yet ingested
- Civics
- —
Market trends
- HPI YoY
- ▼ -37.39%
- Current HPI
- 247.8527
- Rent YoY
- —
- Metro
- Mobile, AL
- State GDP YoY
- ▲ 2.94%
- F500 in state
- 4
Industry mix (Fortune 500 HQ in AL)
| Industry | F500 HQs | Revenue |
|---|---|---|
| Financial Services | 1 | $8B |
|
||
| Healthcare | 1 | $5B |
|
||
Price history
-10.6% since first listed4 events — show timeline
- 2026-06-08 Pending — GCMLS AL
- 2026-06-03 Price Changed $169,000 GCMLS AL
- 2026-05-21 Price Changed $179,000 GCMLS AL
- 2026-05-14 Listed $189,000 GCMLS AL
Property tax history
+4.9%/yrLatest (2025): $1,802 · +5.4% YoY. Source: county tax records.
Cash-flow waterfall
monthlySold comps — $/sqft
last 12 mo · ≤1 miLoading sold comps…