 Multi-family
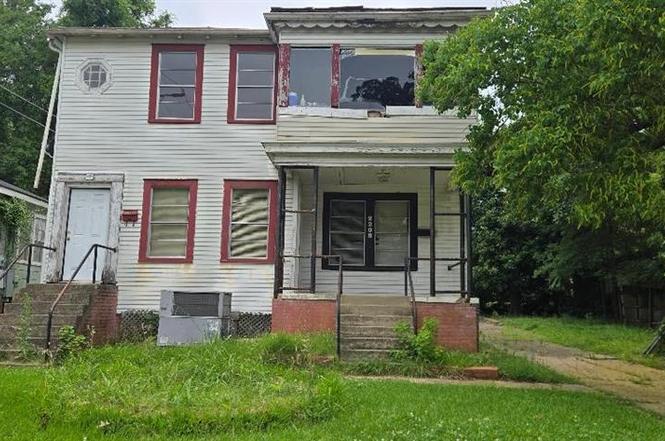
2208 Centenary Blvd · Shreveport, LA
Flood risk 1/10 · Minimal
- FEMA flood zone
- X (unshaded)
- Chance of flooding over 30 yrs
- 0.0%
- Est. flood insurance / yr
- $507 – $1,088
Fire risk 1/10 · Minimal
- Est. fire insurance / yr
- $1,269 – $2,357
Heat risk 7/10 · Major
- Hot days now (above 110°F)
- 7 days/yr
- Hot days in 30 yrs
- 22 days/yr
Wind risk 6/10 · Moderate
- Chance of severe wind over 30 yrs
- 66.0%
Air-quality risk 2/10 · Minimal
- Unhealthy air days now
- 1 days/yr
- Unhealthy air days in 30 yrs
- 2 days/yr
Risk factors via First Street. Map © Google.
Why this score? — see what drove the B- grade
The composite is a weighted blend of 9 inputs, each scored 0–100. Each bar is that input's sub-score; the figure is the points it added to the 100-point composite (weight × sub-score).
- Cash flow +30.0/30.0
- 1% rule +10.0/10.0
- DSCR +10.0/10.0
- ARV discount +7.5/15.0
- Rent growth +3.4/5.0
- Livability +3.0/5.0
- Condition / age +2.5/5.0
- Schools +2.2/10.0
- Appreciation +0.0/10.0
$50,000
🖨 Deal sheet 📄 Offer letter ✓ Due diligence
Multi-family units
County records classify this as Multi-Family (2-4 Unit). Listing-text estimate: 1 unit. estimate disagrees with records
Listing remarks
4 BED 2 BATH 2 two-story duplex Property is sold AS-Is no repairs . Home needs TLC . Owner turned home upstairs into music studio but can be turned back into an apartment . This will be a great investment property or a great flip. Seller wants to see all offers
Key facts
- Two-story duplex
- Music studio
- Investment property
Tags
Property features AI
Finance
- Financial info: No second mortgage
- HOA & community: No homeowners association
Exterior
- Parking: Carport with space for 6 vehicles; Common/shared parking
- Utilities: City water; City sewer; Not in a municipal utility district
- Home design: Single-family residence; Residential property; Two-story
- Construction: Wood construction; Built in 1940
- Exterior features: Lot under 0.5 acre (approximately 0.204 acres)
Interior
- Kitchen: No appliances listed
- Bedrooms: Four bedrooms (two on the first floor, two on the second floor; two labeled as primary bedrooms: one on first floor, one on second floor)
- Bathrooms: Two full bathrooms
- Interior features: Six total rooms; Two living areas; Two dining areas; Two levels
Neighborhood map
What this means for you Summary
Snapshot
- This is a 4-bed/2.0-bath multifamily listed at $50k.
Deal economics
- At list price, monthly cash flow is $649 ($8k/yr) — positive.
- The deal already cash-flows at list — no discount required.
- Meets the 1% rule at list price ($1k rent vs $50k).
- Cap rate 21.9% vs local median 5.7% in Shreveport — top-decile yield for the area; either an underpriced asset or a hidden risk that comps aren't pricing in. Stress-test before assuming the spread holds.
Location & tenants
- Location reads 59/100 on livability (#270 in LA) — a working-class tenant base; expect higher turnover. Strengths: cost of living A+, housing A; Watch: schools D+, crime F, amenities F.
- Caddo Parish (urban): math 21% / reading 32% proficiency, ranked #53 of 98 in LA (top 54%) — low school quality limits family demand, transient renter base, plan for 1-2y turnover; 64% free/reduced lunch — lower-income household profile, screen leases tightly.
- Market conditions: Rents rising (+3.6%/yr); 146 active listings in the ZIP; 9 comparable units currently listed for rent nearby; rentals lingering (median 44d on market — plan ~5-8 weeks vacancy on turnover, expect pricing pressure); 56% of comp listings sitting > 30 days — soft ceiling on asking rent; 221 units permitted in Caddo Parish in 2024 (0 in 5+ unit buildings).
Forward outlook
- Local home prices are declining (-3.0%/yr); year-one equity from $346 of loan paydown is wiped out by about $2k of value loss. Plan a longer hold.
- Caddo County population projected at -15% by 2050 — secular population decline; favor cash flow + early exit over multi-decade hold.
- At projected returns (-3.0% appreciation + 3.6% rent growth), your $14k cash investment doubles in ~3 years — after that, you're playing with house money.
Negotiation context
- Only 3 days on market — expect competitive offers; lowballing is unlikely to land.
Risks & watch-outs
- Watch-outs: property tax is 3.3% of price; built in 1940 — expect roof / HVAC / electrical / plumbing capex.
- Climate carrying-cost: major wind risk, 66% chance of damaging wind over 30y; extreme-heat days projected 7→22/yr by 2055 (HVAC capex compounding) — expect insurance premiums to compound above CPI over the hold.
Questions for the listing agent
- Built in 1940 — when were the roof, HVAC, electrical panel, plumbing, and water heater last replaced?
- Property tax is high relative to price — has the assessment been appealed recently, and will the sale trigger a re-assessment?
- Is there a deadline driving the sale (1031 exchange, divorce, estate, relocation)? That informs how much negotiation room exists.
- Schools are D-rated, which usually means shorter tenancies and higher turnover. Who's the typical renter profile here, and what's been the actual vacancy rate?
- Crime grade is F in this area — have there been break-ins, vandalism, or insurance claims at this property in the last 3 years? What carrier currently insures it and at what premium?
- What's the average days-on-market for RENTAL listings here right now (not sales)? A rising rental-DOM trend means longer vacancies and softer asking-rent achievability than the comps imply.
- What's the recent tenant-quality profile in this submarket — average credit score on applications, eviction rate, late-payment / NSF rate, and stable-employment percentage? A property-management company in the area should have these aggregated.
- How much new apartment / multifamily construction is in the pipeline within 1–3 miles? Heavy new supply (>2% of stock underway) typically softens rents 12–24 months out; light construction supports rent growth.
Investment metrics
- 1% rule
- 2.70% ✓
- Cap rate
- 21.87%
- Cash-on-cash
- 55.64%
- DSCR
- 3.48
- GRM
- 3.1
CMA / ARV
- ARV (on-the-fly)
- $158,032
- Comps found
- 2
Show comp detail 2 sales within ~0.75 mi
| Address | Dist | Beds/Ba | Sqft | Sold | Price | $/sf | Match |
|---|---|---|---|---|---|---|---|
| 318 Columbia St | 0.46mi | 4/3.0 | 2,213 (-5%) | 24mo | $149,900 | $68 | 47 |
| 621 Robinson | 0.59mi | 5/3.0 (+1) | 2,587 (+11%) | 13mo | $75,000 | $29 | 34 |
Match score weights: distance 35% · size 25% · config 20% · recency 20%. Top-matched comps best support the ARV.
Projected returns pro-forma
-3.0% appreciation · 3.56% rent growth · sell at horizon
- IRR
- 54.7%
- Equity multiple
- 3.43×
- Total profit
- $34,076
- Equity at exit
- $7,455
- IRR
- 60.0%
- Equity multiple
- 7.17×
- Total profit
- $86,357
- Equity at exit
- $4,323
Cash invested: $14,000 (down + closing). Projections, not guarantees.
Landlord ↔ Tenant lean methodology
- Overall (STATE)
- 90 Strongly Landlord-Friendly
- State Louisiana
- 90 Strongly Landlord-Friendly · R+12
- County
- — inherits STATE
- City
- — inherits STATE
ZIP-level market 71104
- Home prices YoY
- -32.2%
- Rents YoY
- 3.6%
- Active inventory
- 146
- Price-to-rent
- 3.1×
Monthly cashflow live
- Estimated rent
- $1,352 high interval (Pro) →
- Mortgage (P&I)
- −$262
- Tax from tax record
- −$136 /mo · $1,628/yr
- Insurance
- −$21
- HOA
- −$0
- Vacancy / Maint / Mgmt
- −$284
- Net cashflow
- $649
Break-even live
UW: 25.0% down · 7.5% · 30yr · 1.5% tax · 5.0% vac · 8.0% maint · 8.0% mgmt
Financing live
Cash to close
- Down payment
- $12,500
- Closing costs
- $1,500
- Reserves months
- —
- Total cash needed
- —
Loan-product check · same deal, 3 products live
Conventional
25% down · 7.5% · 30yr
- Down + closing
- —
- Monthly P&I
- —
- Monthly cashflow
- —
- DSCR
- —
- Eligible?
- —
Personal DTI + credit; lowest rate.
DSCR
20% down · 8.5% · 30yr
- Down + closing
- —
- Monthly P&I
- —
- Monthly cashflow
- —
- DSCR
- —
- Eligible?
- —
No personal income docs; deal must DSCR.
Hard money
10% down · 12.0% · 12mo
- Down + closing
- —
- Monthly P&I
- —
- Monthly cashflow
- —
- DSCR
- —
- Eligible?
- —
Short-term bridge; refi at stabilization.
Rent comps 9 comps
| Address | Beds | Baths | Sqft | Rent | $/sqft | DOM | Units | Dist |
|---|---|---|---|---|---|---|---|---|
| 419 Boulevard St Shreveport, LA | 3.0 | 2.0 | 1852 | $1,100 | $0.59 | 43d | 1 | 0.30mi |
| 442 Merrick St Shreveport, LA | 3.0 | 1.5 | 1595 | $1,000 | $0.63 | 43d | 1 | 0.37mi |
| 2109 Highland Ave Shreveport, LA | 3.0 | 1.0 | 1739 | $1,050 | $0.60 | 43d | 1 | 0.38mi |
| 222 Stephenson St Shreveport, LA | 3.0 | 2.5 | 2642 | $2,000 | $0.76 | 20d | 1 | 0.84mi |
| 320 Stephenson St Shreveport, LA | 3.0 | 2.0 | 1845 | $1,675 | $0.91 | 20d | 1 | 0.86mi |
| 320 Stephenson St Shreveport, LA | 3.0 | 2.0 | 1845 | $1,675 | $0.91 | 13d | 1 | 0.86mi |
| 3624 Gilbert Dr Shreveport, LA | 3.0 | 3.0 | 2088 | $1,900 | $0.91 | 43d | 1 | 1.08mi |
| 715 Camilla Dr Shreveport, LA | 3.0 | 1.0 | 1654 | $1,350 | $0.82 | 43d | 1 | 1.11mi |
| 2811 Samford Ave Shreveport, LA | 3.0 | 1.0 | 1612 | $850 | $0.53 | 13d | 1 | 1.41mi |
Listing history 4 events
-
2026-06-18days on market $50,000 Active 3 DOM
-
2026-06-17days on market $50,000 Active 2 DOM
-
2026-06-15remarks 264-char remark
-
2026-06-15$50,000 Active 1 DOM
ⓘ Source: listings_history table (triggers on properties + properties_extension) + one-shot
backfill from property_details.listing_events for pre-trigger history.
Tax reassessment forecast LA · Resets to sale price
- Current annual tax
- $1,628 · $136/mo
- Projected year-2 tax
- $1,628 · $136/mo
- Expected delta
- $0/yr ($0/mo · 0.0%)
ⓘ Screening estimate from a state-policy table — verify with the county assessor before closing.
Climate risk First Street
- Flood 1/10 Low FEMA zone X (unshaded) · 0% chance over 30 yrs
- Wildfire 1/10 Low
- Heat 7/10 Severe 7 d/yr ≥110°F today · 22 d/yr by 30 yrs out
- Wind 6/10 Major 66% chance of damaging wind over 30 yrs
- Air quality 2/10 Low 1 unhealthy d/yr today · 2 by 30 yrs out
Nearby sold comps map
Loading sold comps map…
Walkable amenities ~0.75 mi
Loading nearby amenities…
Taxation est. · year 1
- Rental income
- $16,221
- − Mortgage interest
- −$2,801
- − Property taxes
- −$1,628
- − Insurance
- −$250
- − Repairs & maintenance
- −$1,298
- − Management
- −$1,298
- − Depreciation
- −$1,455
- Taxable income
- $7,492
- Est. tax owed @ 24.0%
- −$1,798
- After-tax cash flow
- $5,992/yr
For passive investors: Depreciation is non-cash, so a rental often shows a tax loss while cash-flowing — sheltering income. Rental losses are passive: they offset passive income freely, and up to $25,000/yr can offset ordinary (W-2) income if you actively participate and your MAGI is under $100k (phasing out to $0 by $150k); unused losses carry forward. On sale, claimed depreciation is recaptured at up to 25%, and gains may owe capital-gains tax (a 1031 exchange can defer both). Figures are a year-1 estimate at your 24.0% rate — not tax advice; consult a CPA.
Schools (NCES district)
- District
- Caddo Parish
- NCES district ID
- 2200300
- Math proficiency
- 21% ▼ -33.00%
- Reading proficiency
- 32% ▼ -30.00%
- Median HH income
- $39,227
- Composite
- 22.23/100
- National rank
- #8148
- State rank
- #53 of 98 in LA
Livability — Shreveport
- Score
- 59/100
- State rank
- #270
- US rank
- #19730
Category grades
Schools grade is shown separately in the Schools card above.
Census & demographics
- Census place
- Shreveport, LA
- County
- Caddo Parish · 178,536 people
- City population
- 164,123
- Metro
- Shreveport-Bossier City, LA
- Population (ZIP)
- 12,975
- Household income
- $56,833
- Rent vs Own
- Severe rent burden
- 759.0
Population outlook (Caddo County) Hauer SSP2
- Today (2025)
- 243,190 people
- By 2030
- 237,231 · -2.5%
- By 2040
- 222,502 · -8.5%
- By 2050
- 206,516 · -15.1%
- By 2075
- 165,706 · -31.9%
- By 2100
- 122,262 · -49.7%
Race, ethnicity, and origin ACS 2023
- Neighborhood character
- Diverse neighborhood (Simpson 0.63)
- Race & ethnicity
- White 53% Black 28% Two or more races 10% Hispanic / Latino 10% Asian 3%
- Hispanic origin (detail)
- Mexican 7%
- Common ancestry
- Slovak 6% Lithuanian 4% Scottish 2%
- Foreign-born
- 5% · Canada, Vietnam
- Languages at home
- 90% English-only · Spanish 5% French/Haitian/Cajun 1% Tagalog/Filipino 1%
Political lean MEDSL · Caddo
- 2024 margin
- Toss-up / Even · D 51.6% · R 47.0% · Other 1.4%
- 2008→2024 swing
- +1.6pp toward D · 2008: 3.0pp · 2024: 4.6pp
- All cycles
- 2024: D+4.6 2020: D+6.8 2016: D+4.2 2012: D+4.9 2008: D+3.0
Not yet ingested
- Civics
- —
Market trends
- HPI YoY
- ▼ -49.61%
- Current HPI
- 104.3781
- Rent YoY
- ▲ 3.56%
- Metro
- Shreveport-Bossier City, LA
- State GDP YoY
- ▲ 3.29%
- F500 in state
- 10
Industry mix (Fortune 500 HQ in LA)
| Industry | F500 HQs | Revenue |
|---|---|---|
| Telecommunications | 2 | $23B |
|
||
| Utilities | 1 | $12B |
|
||
| Wholesale / Distribution | 1 | $5B |
|
||
| Advertising | 1 | $2B |
|
||
Price history
-41.2% since first listed5 events — show timeline
- 2026-06-15 Listed $50,000 NTREIS
- 2009-12-18 Sold (Public Records) $85,000 Public Records
- 2006-01-05 Sold (Public Records) — Public Records
- 2004-10-22 Sold (Public Records) — Public Records
- 2000-02-22 Sold (Public Records) — Public Records
Property tax history
+8.1%/yrLatest (2025): $1,628 · +0.4% YoY. Source: county tax records.
Cash-flow waterfall
monthlySold comps — $/sqft
last 12 mo · ≤1 miLoading sold comps…