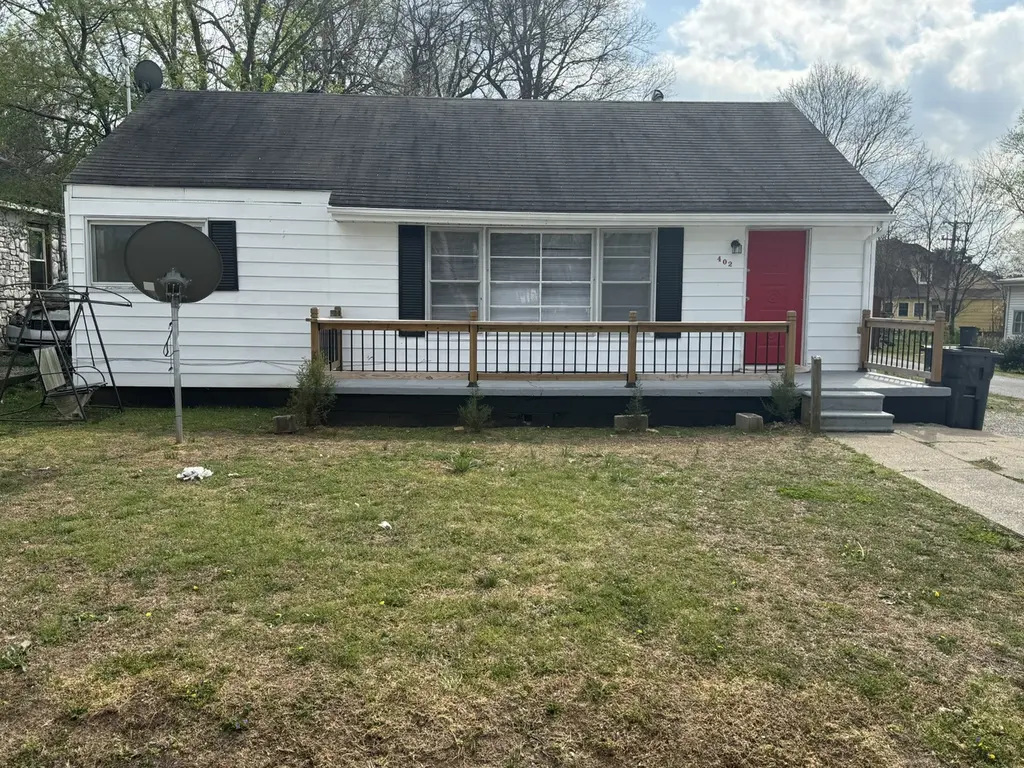
402 E Locust St · Princeton, KY
Flood risk 1/10 · Minimal
- FEMA flood zone
- X (unshaded)
- Chance of flooding over 30 yrs
- 0.0%
- Est. flood insurance / yr
- $473 – $860
Fire risk 3/10 · Minor
- Est. fire insurance / yr
- $839 – $1,559
Heat risk 6/10 · Moderate
- Hot days now (above 109°F)
- 7 days/yr
- Hot days in 30 yrs
- 21 days/yr
Wind risk 3/10 · Minor
- Chance of severe wind over 30 yrs
- 7.0%
Air-quality risk 2/10 · Minimal
- Unhealthy air days now
- 0 days/yr
- Unhealthy air days in 30 yrs
- 1 days/yr
Risk factors via First Street. Map © Google.
Why this score? — see what drove the B- grade
The composite is a weighted blend of 9 inputs, each scored 0–100. Each bar is that input's sub-score; the figure is the points it added to the 100-point composite (weight × sub-score).
- Cash flow +26.8/30.0
- ARV discount +15.0/15.0
- DSCR +9.2/10.0
- 1% rule +7.2/10.0
- Livability +3.8/5.0
- Schools +2.8/10.0
- Rent growth +2.5/5.0
- Condition / age +2.5/5.0
- Appreciation +0.0/10.0
$90,000
🖨 Deal sheet (PDF) 📄 Offer letter ✓ Due diligence
Listing remarks
Charming 3-Bed, 1-Bath Starter Home Nestled near local shops, schools and dining . This freshly painted, with interior updates , also new Refrigerator and stove 3-bedroom, 1-bath home offers 925 sq ft of comfortable, move-in-ready living. Thoughtful updates have been completed to give the home a clean, modern feel while preserving its affordability and potential. Bright living room, functional eat-in kitchen, and a practical floorplan. Home sold AS IS.
Key facts
- Built 1984
- Listed 80 days
Property features AI
Exterior
- Parking: No covered spaces reported; No total parking spaces reported
- Utilities: Water available; Public water; Public sewer
- Home design: Single-family residence; One story; Residential property
- Construction: Vinyl siding
- Exterior features: Public water available; Public sewer
Interior
- Kitchen: Electric oven, Electric range, Refrigerator
- Bedrooms: 3 bedrooms (all on the main level)
- Flooring: Carpet; Laminate; Vinyl
- Bathrooms: 1 full bathroom
- Heating & cooling: Central heating; Central air
- Interior features: Electric oven; Electric range; Refrigerator
Neighborhood map
What this means for you Summary
Snapshot
- This is a 3-bed/1.0-bath single-family listed at $90k.
Deal economics
- At list price, monthly cash flow is $245 ($3k/yr) — positive.
- The deal already cash-flows at list — no discount required.
- Meets the 1% rule at list price ($1k rent vs $90k).
- Recommended offer: $85k (6.0% below list) — sets the bar for market timing.
- Cap rate 9.6% vs local median 6.2% in Princeton — top-decile yield for the area; either an underpriced asset or a hidden risk that comps aren't pricing in. Stress-test before assuming the spread holds.
Location & tenants
- Location reads 76/100 on livability (#88 in KY, #3,490 nationally) — a middle-class / working-renter tenant base. Strengths: crime A+, cost of living A+, health & safety A+; Watch: employment D+, commute F.
- Caldwell County (rural): math 28% / reading 39% proficiency, ranked #78 of 165 in KY (top 47%) — families likely to look elsewhere, expect single-tenant / working-renter base with shorter leases.
- Zoned schools: Caldwell County Primary School (523 students, 64% FRL); Caldwell County High School (math 32% / reading 37%, grade F, #76 of 254 statewide, top 34%, 544 students, 43% FRL) — zoned schools at 53% FRL track the district average.
- Market conditions: 58 active listings in the ZIP.
Forward outlook
- Local home prices are declining (-3.0%/yr); year-one equity from $622 of loan paydown is wiped out by about $3k of value loss. Plan a longer hold.
- Caldwell County population projected at -13% by 2050 — secular population decline; favor cash flow + early exit over multi-decade hold.
- At projected returns (-3.0% appreciation + 3.0% rent growth), your $25k cash investment doubles in ~10 years — after that, you're playing with house money.
Negotiation context
- It's been on market 80 days — a 6% lower offer ($85k) is reasonable based on typical stale-listing flexibility.
- 4 sale attempts with the ask held roughly flat each time — persistent listings suggest the price (not the market) is what's stuck; bring a comps-based counter.
- Current owner paid $35k; list at $90k implies a 157% gain — meaningful room to come down on a strong offer.
Risks & watch-outs
- Climate carrying-cost: extreme-heat days projected 7→21/yr by 2055 (HVAC capex compounding) — expect insurance premiums to compound above CPI over the hold.
Questions for the listing agent
- It's been on market 80 days. Have you received any prior offers? Is the seller open to a 6% concession, seller financing, or rate buy-down credit?
- Why hasn't it sold? Are there any deal-killer items the seller is aware of (foundation, flood, title, zoning, code violations)?
- Is there a deadline driving the sale (1031 exchange, divorce, estate, relocation)? That informs how much negotiation room exists.
- Schools are D-rated, which usually means shorter tenancies and higher turnover. Who's the typical renter profile here, and what's been the actual vacancy rate?
- What's the average days-on-market for RENTAL listings here right now (not sales)? A rising rental-DOM trend means longer vacancies and softer asking-rent achievability than the comps imply.
- What's the recent tenant-quality profile in this submarket — average credit score on applications, eviction rate, late-payment / NSF rate, and stable-employment percentage? A property-management company in the area should have these aggregated.
- How much new for-sale + rental construction is in the pipeline within 1–3 miles? Heavy new supply typically softens prices + rents 12–24 months out; constrained supply supports both.
Investment metrics
- 1% rule
- 1.22% ✓
- Cap rate
- 9.56%
- Cash-on-cash
- 11.68%
- DSCR
- 1.52
- GRM
- 6.8
CMA / ARV
- ARV (on-the-fly)
- $109,150
- Comps found
- 9
Show comp detail 9 sales within ~0.75 mi
| Address | Dist | Beds/Ba | Sqft | Sold | Price | $/sf | Match |
|---|---|---|---|---|---|---|---|
| 303 White St | 0.38mi | 2/1.0 (-1) | 990 (+7%) | 14mo | $116,600 | $118 | 54 |
| 376 Sandlick Rd | 0.62mi | 3/1.0 | 960 (+4%) | 14mo | $130,000 | $135 | 53 |
| 521 N Plum St Unit 1/2 | 0.60mi | 3/1.0 | 960 (+4%) | 15mo | $124,000 | $129 | 53 |
| 212 Grace St | 0.40mi | 2/1.0 (-1) | 1,020 (+10%) | 9mo | $125,000 | $123 | 52 |
| 108 Ratliff St | 0.62mi | 2/1.0 (-1) | 914 (-1%) | 18mo | $68,000 | $74 | 49 |
| 510 E Main St | 0.19mi | 3/1.0 | 1,056 (+14%) | 22mo | $125,000 | $118 | 49 |
| 509 S Seminary St | 0.68mi | 3/1.0 | 1,050 (+14%) | 1mo | $120,000 | $114 | 45 |
| 400 Maple Ave | 0.56mi | 2/1.0 (-1) | 840 (-9%) | 11mo | $90,000 | $107 | 44 |
| 204 Ratliff St | 0.68mi | 3/1.0 | 1,062 (+15%) | 3mo | $103,000 | $97 | 41 |
Match score weights: distance 35% · size 25% · config 20% · recency 20%. Top-matched comps best support the ARV.
Projected returns pro-forma
-3.0% appreciation · 3.0% rent growth · sell at horizon
- IRR
- 1.1%
- Equity multiple
- 1.04×
- Total profit
- $1,055
- Equity at exit
- $13,419
- IRR
- 10.7%
- Equity multiple
- 1.84×
- Total profit
- $21,103
- Equity at exit
- $7,782
Cash invested: $25,200 (down + closing). Projections, not guarantees.
Landlord ↔ Tenant lean methodology
- Overall (STATE)
- 83 Strongly Landlord-Friendly
- State Kentucky
- 83 Strongly Landlord-Friendly · R+16
- County
- — inherits STATE
- City
- — inherits STATE
ZIP-level market 42445
- Home prices YoY
- -7.9%
- Active inventory
- 58
- Price-to-rent
- 6.8×
Monthly cashflow live
- Estimated rent
- $1,098 medium interval (Pro) →
- Mortgage (P&I)
- −$472
- Tax est. 1.5%
- −$112 /mo · $1,350/yr
- Insurance
- −$38
- HOA
- −$0
- Vacancy / Maint / Mgmt
- −$231
- Net cashflow
- $245
Break-even live
Sensitivity live
| Price | -10% $307 | -5% $276 | +0% $245 | +5% $214 | +10% $183 |
|---|---|---|---|---|---|
| Rent | -10% $159 | -5% $202 | +0% $245 | +5% $289 | +10% $332 |
| Rate | -1.0pp $291 | -0.5pp $268 | base $245 | +0.5pp $222 | +1.0pp $198 |
UW: 25.0% down · 7.5% · 30yr · 1.5% tax · 5.0% vac · 8.0% maint · 8.0% mgmt
Financing live
Cash to close
- Down payment
- $22,500
- Closing costs
- $2,700
- Reserves months
- —
- Total cash needed
- —
Loan-product check · same deal, 3 products live
Conventional
25% down · 7.5% · 30yr
- Down + closing
- —
- Monthly P&I
- —
- Monthly cashflow
- —
- DSCR
- —
- Eligible?
- —
Personal DTI + credit; lowest rate.
DSCR
20% down · 8.5% · 30yr
- Down + closing
- —
- Monthly P&I
- —
- Monthly cashflow
- —
- DSCR
- —
- Eligible?
- —
No personal income docs; deal must DSCR.
Hard money
10% down · 12.0% · 12mo
- Down + closing
- —
- Monthly P&I
- —
- Monthly cashflow
- —
- DSCR
- —
- Eligible?
- —
Short-term bridge; refi at stabilization.
Listing history 25 events
-
2026-06-21days on market $90,000 Active 80 DOM
-
2026-06-18days on market $90,000 Active 78 DOM
-
2026-06-17days on market $90,000 Active 77 DOM
-
2026-06-16days on market $90,000 Active 76 DOM
-
2026-06-15days on market $90,000 Active 75 DOM
-
2026-06-13days on market $90,000 Active 73 DOM
-
2026-06-12days on market $90,000 Active 72 DOM
-
2026-06-09days on market $90,000 Active 69 DOM
-
2026-06-08days on market $90,000 Active 68 DOM
-
2026-06-07days on market $90,000 Active 67 DOM
-
2026-06-07days on market $90,000 Active 66 DOM
-
2026-06-04days on market $90,000 Active 63 DOM
-
2026-06-02days on market $90,000 Active 62 DOM
-
2026-06-01days on market $90,000 Active 61 DOM
-
2026-05-31days on market $90,000 Active 60 DOM
-
2026-05-31days on market $90,000 Active 59 DOM
-
2026-05-16status Active
-
2026-05-13historical Active Under Contract
-
2026-04-09status Active
-
2026-04-05historical Active Under Contract
-
2026-04-01$90,000 Active
-
2026-03-31historical $90,000
-
2025-11-07price $99,900
-
2025-10-07$105,000 Active
-
1997-07-01soldstatus $35,000
ⓘ Source: listings_history table (triggers on properties + properties_extension) + one-shot
backfill from property_details.listing_events for pre-trigger history.
Climate risk First Street
- Flood 1/10 Low FEMA zone X (unshaded) · 0% chance over 30 yrs
- Wildfire 3/10 Moderate
- Heat 6/10 Major 7 d/yr ≥109°F today · 21 d/yr by 30 yrs out
- Wind 3/10 Moderate 7% chance of damaging wind over 30 yrs
- Air quality 2/10 Low 0 unhealthy d/yr today · 1 by 30 yrs out
Nearby sold comps map
Loading sold comps map…
Walkable amenities ~0.75 mi
Loading nearby amenities…
Taxation est. · year 1
- Rental income
- $13,174
- − Mortgage interest
- −$5,041
- − Property taxes
- −$1,350
- − Insurance
- −$450
- − Repairs & maintenance
- −$1,054
- − Management
- −$1,054
- − Depreciation
- −$2,618
- Taxable income
- $1,606
- Est. tax owed @ 24.0%
- −$385
- After-tax cash flow
- $2,558/yr
For passive investors: Depreciation is non-cash, so a rental often shows a tax loss while cash-flowing — sheltering income. Rental losses are passive: they offset passive income freely, and up to $25,000/yr can offset ordinary (W-2) income if you actively participate and your MAGI is under $100k (phasing out to $0 by $150k); unused losses carry forward. On sale, claimed depreciation is recaptured at up to 25%, and gains may owe capital-gains tax (a 1031 exchange can defer both). Figures are a year-1 estimate at your 24.0% rate — not tax advice; consult a CPA.
Schools (NCES district)
- District
- Caldwell County
- NCES district ID
- 2100840
- Math proficiency
- 28% ▼ -29.00%
- Reading proficiency
- 39% ▼ -19.00%
- Median HH income
- $40,080
- Composite
- 28.12/100
- National rank
- #6819
- State rank
- #78 of 165 in KY
Livability — Princeton
- Score
- 76/100
- State rank
- #88
- US rank
- #3490
Category grades
Schools grade is shown separately in the Schools card above.
Census & demographics
- Census place
- Princeton, KY
- Population (ZIP)
- 10,371
Population outlook (Caldwell County) Hauer SSP2
- Today (2025)
- 12,100 people
- By 2030
- 11,739 · -3.0%
- By 2040
- 11,088 · -8.4%
- By 2050
- 10,543 · -12.9%
- By 2075
- 9,406 · -22.3%
- By 2100
- 8,084 · -33.2%
Race, ethnicity, and origin ACS 2023
- Neighborhood character
- Predominantly White (88%)
- Race & ethnicity
- White 88% Black 6% Hispanic / Latino 3% Two or more races 3%
- Common ancestry
- Italian 3% Serbian 1% Slovak 1%
- Foreign-born
- 3% · Canada
- Languages at home
- 97% English-only · Spanish 2% German/W. Germanic 1%
Political lean MEDSL · Caldwell
- 2024 margin
- Solid R (+58.2) · D 20.3% · R 78.5% · Other 1.2%
- 2008→2024 swing
- -31.6pp toward R · 2008: -26.7pp · 2024: -58.2pp
- All cycles
- 2024: R+58.2 2020: R+54.0 2016: R+54.4 2012: R+35.0 2008: R+26.7
Not yet ingested
- Civics
- —
Market trends
- HPI YoY
- ▼ -20.07%
- Current HPI
- 232.7067
- Rent YoY
- —
- Metro
- —
- State GDP YoY
- ▲ 1.81%
- F500 in state
- 4
Industry mix (Fortune 500 HQ in KY)
| Industry | F500 HQs | Revenue |
|---|---|---|
| Healthcare | 1 | $118B |
|
||
| Food / Beverage | 1 | $7B |
|
||
Price history
+157.1% since first listed9 events — show timeline
- 2026-05-16 Relisted — REALTRACS as Distributed by MLS Grid
- 2026-05-13 Contingent — REALTRACS as Distributed by MLS Grid
- 2026-04-09 Relisted — REALTRACS as Distributed by MLS Grid
- 2026-04-05 Contingent — REALTRACS as Distributed by MLS Grid
- 2026-04-01 Listed $90,000 REALTRACS as Distributed by MLS Grid
- 2026-03-31 Coming Soon $90,000 REALTRACS as Distributed by MLS Grid
- 2025-11-07 Price Changed $99,900 WKRMLS
- 2025-10-07 Listed $105,000 WKRMLS
- 1997-07-01 Sold (Public Records) $35,000 Public Records
Property tax history
-3.1%/yrLatest (2025): $175 · -48.8% YoY. Source: county tax records.
Cash-flow waterfall
monthlySold comps — $/sqft
last 12 mo · ≤1 miLoading sold comps…