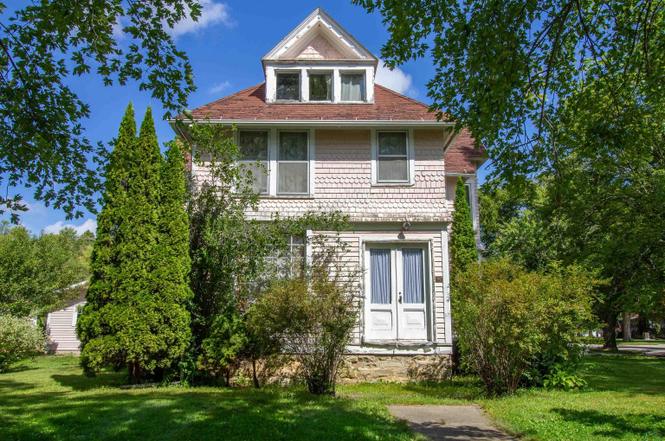
104 W Olive St · Laurens, IA
Flood risk 1/10 · Minimal
- FEMA flood zone
- X (unshaded)
- Chance of flooding over 30 yrs
- 0.0%
- Est. flood insurance / yr
- $473 – $860
Fire risk 1/10 · Minimal
- Est. fire insurance / yr
- $902 – $1,676
Heat risk 2/10 · Minimal
- Hot days now (above 100°F)
- 7 days/yr
- Hot days in 30 yrs
- 16 days/yr
Wind risk 2/10 · Minimal
- Chance of severe wind over 30 yrs
- —
Air-quality risk 1/10 · Minimal
- Unhealthy air days now
- 0 days/yr
- Unhealthy air days in 30 yrs
- 0 days/yr
Risk factors via First Street. Map © Google.
Why this score? — see what drove the B grade
The composite is a weighted blend of 9 inputs, each scored 0–100. Each bar is that input's sub-score; the figure is the points it added to the 100-point composite (weight × sub-score).
- Cash flow +28.5/30.0
- DSCR +10.0/10.0
- ARV discount +7.5/15.0
- 1% rule +7.4/10.0
- Schools +4.8/10.0
- Appreciation +4.7/10.0
- Livability +3.7/5.0
- Rent growth +2.5/5.0
- Condition / age +2.5/5.0
$84,900
🖨 Deal sheet 📄 Offer letter ✓ Due diligence
Listing remarks
Built in 1889, this Folk Victorian is brimming with charm, space, and potential! With more than 2,500 square feet on the main and second floors, you’ll find room after room filled with character. This property is back on the market, so now is your chance! The foyer greets you with a sweeping grand staircase, while a second staircase tucked off the kitchen adds everyday practicality. Pocket doors open between the main level rooms, showcasing detailed original woodwork that flows throughout. The parlor boasts an inlaid hardwood floor—just one of the many period touches waiting to be admired. The main floor also features a living room, dining room, breakfast nook alongside the kitc
Key facts
- Second staircase
- Grand staircase
- Original woodwork
Tags
Neighborhood map
What this means for you Summary
Snapshot
- This is a 5-bed/1.0-bath single-family listed at $85k.
Deal economics
- At list price, monthly cash flow is $278 ($3k/yr) — positive.
- The deal already cash-flows at list — no discount required.
- Meets the 1% rule at list price ($1k rent vs $85k).
Location & tenants
- Location reads 74/100 on livability (#248 in IA, #4,769 nationally) — a middle-class / working-renter tenant base. Strengths: crime A+, cost of living A+, housing A+; Watch: employment D, amenities F, commute F.
- Laurens-Marathon Community School District (rural): math 55% / reading 55% proficiency, ranked #311 of 330 in IA (top 94%) — acceptable for families but not a draw, mixed tenant base, ~2y average lease.
- Zoned schools: Laurens-Marathon Elementary School (math 74% / reading 54%, grade B, #317 of 616 statewide, top 58%, 140 students, 51% FRL) — zoned schools at 51% FRL track the district average.
- Market conditions: 13 active listings in the ZIP; 1 units permitted in Pocahontas County in 2024 (0 in 5+ unit buildings).
Forward outlook
- In year one you build about $110 of equity ($587 loan paydown + $-477 appreciation (-0.6% local appreciation)).
- At projected returns (-0.6% appreciation + 3.0% rent growth), your $24k cash investment doubles in ~6 years — after that, you're playing with house money.
Negotiation context
- Only 12 days on market — expect competitive offers; lowballing is unlikely to land.
- 2 sale attempts with the ask held roughly flat each time — persistent listings suggest the price (not the market) is what's stuck; bring a comps-based counter.
Risks & watch-outs
- Watch-outs: built in 1889 — expect roof / HVAC / electrical / plumbing capex.
Questions for the listing agent
- Built in 1889 — when were the roof, HVAC, electrical panel, plumbing, and water heater last replaced?
- Is there a deadline driving the sale (1031 exchange, divorce, estate, relocation)? That informs how much negotiation room exists.
- Schools are B-rated — typically a magnet for longer-tenancy family renters. What's the average tenant stay here, and is there a school-zone premium baked into asking?
- What's the average days-on-market for RENTAL listings here right now (not sales)? A rising rental-DOM trend means longer vacancies and softer asking-rent achievability than the comps imply.
- What's the recent tenant-quality profile in this submarket — average credit score on applications, eviction rate, late-payment / NSF rate, and stable-employment percentage? A property-management company in the area should have these aggregated.
- How much new for-sale + rental construction is in the pipeline within 1–3 miles? Heavy new supply typically softens prices + rents 12–24 months out; constrained supply supports both.
Investment metrics
- 1% rule
- 1.24% ✓
- Cap rate
- 10.22%
- Cash-on-cash
- 14.02%
- DSCR
- 1.62
- GRM
- 6.7
CMA / ARV
- ARV (on-the-fly)
- $198,044
- Comps found
- 3
Show comp detail 3 sales within ~0.75 mi
| Address | Dist | Beds/Ba | Sqft | Sold | Price | $/sf | Match |
|---|---|---|---|---|---|---|---|
| 318 Oak St | 0.49mi | 5/2.0 | 2,604 (+1%) | 10mo | $207,500 | $80 | 63 |
| 504 Bissell St | 0.33mi | 4/2.5 (-1) | 2,448 (-5%) | 15mo | $115,000 | $47 | 53 |
| 204 S 1st St | 0.03mi | 4/2.5 (-1) | 2,223 (-14%) | 18mo | $171,550 | $77 | 50 |
Match score weights: distance 35% · size 25% · config 20% · recency 20%. Top-matched comps best support the ARV.
Projected returns pro-forma
-0.56% appreciation · 3.0% rent growth · sell at horizon
- IRR
- 11.8%
- Equity multiple
- 1.55×
- Total profit
- $12,986
- Equity at exit
- $22,292
- IRR
- 17.3%
- Equity multiple
- 2.80×
- Total profit
- $42,770
- Equity at exit
- $24,978
Cash invested: $23,772 (down + closing). Projections, not guarantees.
Landlord ↔ Tenant lean methodology
- Overall (STATE)
- 83 Strongly Landlord-Friendly
- State Iowa
- 83 Strongly Landlord-Friendly · R+6
- County
- — inherits STATE
- City
- — inherits STATE
ZIP-level market 50554
- Home prices YoY
- -0.5%
- Active inventory
- 13
- Price-to-rent
- 6.7×
Monthly cashflow live
- Estimated rent
- $1,056 medium interval (Pro) →
- Mortgage (P&I)
- −$445
- Tax from tax record
- −$76 /mo · $906/yr
- Insurance
- −$35
- HOA
- −$0
- Vacancy / Maint / Mgmt
- −$222
- Net cashflow
- $278
Break-even live
UW: 25.0% down · 7.5% · 30yr · 1.5% tax · 5.0% vac · 8.0% maint · 8.0% mgmt
Financing live
Cash to close
- Down payment
- $21,225
- Closing costs
- $2,547
- Reserves months
- —
- Total cash needed
- —
Loan-product check · same deal, 3 products live
Conventional
25% down · 7.5% · 30yr
- Down + closing
- —
- Monthly P&I
- —
- Monthly cashflow
- —
- DSCR
- —
- Eligible?
- —
Personal DTI + credit; lowest rate.
DSCR
20% down · 8.5% · 30yr
- Down + closing
- —
- Monthly P&I
- —
- Monthly cashflow
- —
- DSCR
- —
- Eligible?
- —
No personal income docs; deal must DSCR.
Hard money
10% down · 12.0% · 12mo
- Down + closing
- —
- Monthly P&I
- —
- Monthly cashflow
- —
- DSCR
- —
- Eligible?
- —
Short-term bridge; refi at stabilization.
Listing history 4 events
-
2026-04-16status Pending
-
2025-10-31status Active
-
2025-10-06status Pending
-
2025-09-19$84,900 Active
ⓘ Source: listings_history table (triggers on properties + properties_extension) + one-shot
backfill from property_details.listing_events for pre-trigger history.
Tax reassessment forecast IA · Partial reset (capped growth)
- Current annual tax
- $906 · $76/mo
- Projected year-2 tax
- $1,119 · $93/mo
- Expected delta
- +$213/yr (+$18/mo · 23.6%)
ⓘ Screening estimate from a state-policy table — verify with the county assessor before closing.
Climate risk First Street
- Flood 1/10 Low FEMA zone X (unshaded) · 0% chance over 30 yrs
- Wildfire 1/10 Low
- Heat 2/10 Low 7 d/yr ≥100°F today · 16 d/yr by 30 yrs out
- Wind 2/10 Low
- Air quality 1/10 Low 0 unhealthy d/yr today · 0 by 30 yrs out
Nearby sold comps map
Loading sold comps map…
Walkable amenities ~0.75 mi
Loading nearby amenities…
Taxation est. · year 1
- Rental income
- $12,666
- − Mortgage interest
- −$4,756
- − Property taxes
- −$906
- − Insurance
- −$424
- − Repairs & maintenance
- −$1,013
- − Management
- −$1,013
- − Depreciation
- −$2,470
- Taxable income
- $2,084
- Est. tax owed @ 24.0%
- −$500
- After-tax cash flow
- $2,833/yr
For passive investors: Depreciation is non-cash, so a rental often shows a tax loss while cash-flowing — sheltering income. Rental losses are passive: they offset passive income freely, and up to $25,000/yr can offset ordinary (W-2) income if you actively participate and your MAGI is under $100k (phasing out to $0 by $150k); unused losses carry forward. On sale, claimed depreciation is recaptured at up to 25%, and gains may owe capital-gains tax (a 1031 exchange can defer both). Figures are a year-1 estimate at your 24.0% rate — not tax advice; consult a CPA.
Schools (NCES district)
- District
- Laurens-Marathon Community School District
- NCES district ID
- 1916420
- Math proficiency
- 55% ▼ -10.00%
- Reading proficiency
- 55% ▼ -10.00%
- Median HH income
- $42,146
- Composite
- 48.0/100
- National rank
- #4796
- State rank
- #311 of 330 in IA
Livability — Laurens
- Score
- 74/100
- State rank
- #248
- US rank
- #4769
Category grades
Schools grade is shown separately in the Schools card above.
Census & demographics
- Census place
- Laurens, IA
- City population
- 1,639
- Population (ZIP)
- 1,639
Population outlook (Pocahontas County) Hauer SSP2
- Today (2025)
- 6,624 people
- By 2030
- 6,482 · -2.1%
- By 2040
- 6,359 · -4.0%
- By 2050
- 6,439 · -2.8%
- By 2075
- 7,397 · +11.7%
- By 2100
- 8,428 · +27.2%
Race, ethnicity, and origin ACS 2023
- Neighborhood character
- Predominantly White (93%)
- Race & ethnicity
- White 93% Hispanic / Latino 4% Two or more races 2% Black 1%
- Common ancestry
- Portuguese 4% Iranian 3% Italian 2%
- Foreign-born
- 2% · Canada, Jamaica
- Languages at home
- 95% English-only · Spanish 4% German/W. Germanic 1%
Political lean MEDSL · Pocahontas
- 2024 margin
- Solid R (+54.0) · D 22.3% · R 76.3% · Other 1.4%
- 2008→2024 swing
- -45.6pp toward R · 2008: -8.4pp · 2024: -54.0pp
- All cycles
- 2024: R+54.0 2020: R+49.5 2016: R+45.2 2012: R+21.8 2008: R+8.4
Not yet ingested
- Civics
- —
Market trends
- HPI YoY
- ▼ -0.56%
- Current HPI
- 111.4699
- Rent YoY
- —
- Metro
- —
- State GDP YoY
- ▲ 2.48%
- F500 in state
- 4
Industry mix (Fortune 500 HQ in IA)
| Industry | F500 HQs | Revenue |
|---|---|---|
| Financial Services | 1 | $16B |
|
||
| Retail / Convenience | 1 | $15B |
|
||
Price history
4 events — show timeline
- 2026-04-16 Pending — NWIA
- 2025-10-31 Relisted — NWIA
- 2025-10-06 Pending — NWIA
- 2025-09-19 Listed $84,900 NWIA
Property tax history
+1.7%/yrLatest (2025): $906 · -11.7% YoY. Source: county tax records.
Cash-flow waterfall
monthlySold comps — $/sqft
last 12 mo · ≤1 miLoading sold comps…