500 S 8th St · Oquawka, IL
Flood risk 6/10 · Moderate
- FEMA flood zone
- X (shaded)
- Chance of flooding over 30 yrs
- 0.74%
- Est. flood insurance / yr
- $473 – $860
Fire risk 1/10 · Minimal
- Est. fire insurance / yr
- $804 – $1,492
Heat risk 3/10 · Minor
- Hot days now (above 105°F)
- 7 days/yr
- Hot days in 30 yrs
- 16 days/yr
Wind risk 2/10 · Minimal
- Chance of severe wind over 30 yrs
- —
Air-quality risk 2/10 · Minimal
- Unhealthy air days now
- 1 days/yr
- Unhealthy air days in 30 yrs
- 2 days/yr
Risk factors via First Street. Map © Google.
Why this score? — see what drove the B+ grade
The composite is a weighted blend of 9 inputs, each scored 0–100. Each bar is that input's sub-score; the figure is the points it added to the 100-point composite (weight × sub-score).
- Cash flow +30.0/30.0
- ARV discount +13.8/15.0
- 1% rule +10.0/10.0
- DSCR +10.0/10.0
- Appreciation +5.0/10.0
- Livability +3.2/5.0
- Rent growth +2.5/5.0
- Condition / age +2.5/5.0
- Schools +0.9/10.0
$73,000
🖨 Deal sheet (PDF) 📄 Offer letter ✓ Due diligence
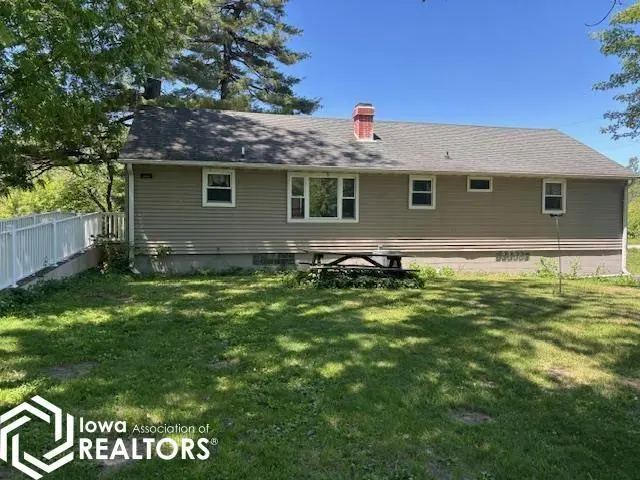
Listing remarks
Country feel on the edge of town. Beautiful large lot with plenty of room for many outside activities. Inside you will find 3 bedrooms, update bath with new walk-in shower, and nice size living room and kitchen. Call today.
Key facts
- 0.82 acre lot
- 2 garage spots
- Built 1968
Property features AI
Exterior
- Parking: 2-car garage (basement access)
- Utilities: Private well water; Septic system
- Home design: Single-family residence; Residential property
- Construction: Vinyl siding
- Exterior features: Private well water; Septic tank; Lot approximately 0.82 acres (99.66 x 361.35)
Interior
- Bathrooms: 1 full bathroom
- Heating & cooling: Central air conditioning; Forced air heating
- Interior features: Basement present
Neighborhood map
What this means for you Summary
Snapshot
- This is a 3-bed/1.0-bath single-family listed at $73k.
Deal economics
- At list price, monthly cash flow is $363 ($4k/yr) — positive.
- The deal already cash-flows at list — no discount required.
- Meets the 1% rule at list price ($1k rent vs $73k).
Location & tenants
- Location reads 64/100 on livability (#686 in IL) — a middle-class / working-renter tenant base. Strengths: cost of living A+, housing A+, crime A; Watch: health & safety C-, schools F, amenities F.
- West Central CUSD 235 (rural): math 8% / reading 10% proficiency, ranked #581 of 620 in IL (top 94%) — low school quality limits family demand, transient renter base, plan for 1-2y turnover.
- Market conditions: 5 active listings in the ZIP; 5 units permitted in Henderson County in 2024 (0 in 5+ unit buildings).
Forward outlook
- In year one you build about $3k of equity ($505 loan paydown + $2k appreciation (3.0% local appreciation)).
- Henderson County population projected at -31% by 2050 — secular population decline; favor cash flow + early exit over multi-decade hold.
- At projected returns (3.0% appreciation + 3.0% rent growth), your $20k cash investment doubles in ~3 years — after that, you're playing with house money.
Negotiation context
- Only 6 days on market — expect competitive offers; lowballing is unlikely to land.
Risks & watch-outs
- Climate carrying-cost: major flood risk — expect insurance premiums to compound above CPI over the hold.
Questions for the listing agent
- Built in 1968 — when were the roof, HVAC, electrical panel, plumbing, and water heater last replaced?
- Is there a deadline driving the sale (1031 exchange, divorce, estate, relocation)? That informs how much negotiation room exists.
- Schools are F-rated, which usually means shorter tenancies and higher turnover. Who's the typical renter profile here, and what's been the actual vacancy rate?
- What's the average days-on-market for RENTAL listings here right now (not sales)? A rising rental-DOM trend means longer vacancies and softer asking-rent achievability than the comps imply.
- What's the recent tenant-quality profile in this submarket — average credit score on applications, eviction rate, late-payment / NSF rate, and stable-employment percentage? A property-management company in the area should have these aggregated.
- How much new for-sale + rental construction is in the pipeline within 1–3 miles? Heavy new supply typically softens prices + rents 12–24 months out; constrained supply supports both.
Investment metrics
- 1% rule
- 1.51% ✓
- Cap rate
- 12.25%
- Cash-on-cash
- 21.28%
- DSCR
- 1.95
- GRM
- 5.5
CMA / ARV
- ARV (on-the-fly)
- $84,864
- Comps found
- 1
Show comp detail 1 sale within ~0.75 mi
| Address | Dist | Beds/Ba | Sqft | Sold | Price | $/sf | Match |
|---|---|---|---|---|---|---|---|
| 200 N 6th St | 0.54mi | 2/1.0 (-1) | 1,294 (+4%) | 17mo | $88,000 | $68 | 50 |
Match score weights: distance 35% · size 25% · config 20% · recency 20%. Top-matched comps best support the ARV.
Projected returns pro-forma
3.0% appreciation · 3.0% rent growth · sell at horizon
- IRR
- 27.5%
- Equity multiple
- 2.56×
- Total profit
- $31,904
- Equity at exit
- $32,824
- IRR
- 28.1%
- Equity multiple
- 4.98×
- Total profit
- $81,254
- Equity at exit
- $50,586
Cash invested: $20,440 (down + closing). Projections, not guarantees.
Landlord ↔ Tenant lean methodology
- Overall (STATE)
- 43 Moderately Tenant-Leaning
- State Illinois
- 43 Moderately Tenant-Leaning · D+7
- County
- — inherits STATE
- City
- — inherits STATE
ZIP-level market 61418
- Active inventory
- 5
- Price-to-rent
- 5.5×
Monthly cashflow live
- Estimated rent
- $1,105 medium interval (Pro) →
- Mortgage (P&I)
- −$383
- Tax from tax record
- −$97 /mo · $1,166/yr
- Insurance
- −$30
- HOA
- −$0
- Vacancy / Maint / Mgmt
- −$232
- Net cashflow
- $363
Break-even live
Sensitivity live
| Price | -10% $404 | -5% $383 | +0% $363 | +5% $342 | +10% $321 |
|---|---|---|---|---|---|
| Rent | -10% $275 | -5% $319 | +0% $363 | +5% $406 | +10% $450 |
| Rate | -1.0pp $399 | -0.5pp $381 | base $363 | +0.5pp $344 | +1.0pp $324 |
UW: 25.0% down · 7.5% · 30yr · 1.5% tax · 5.0% vac · 8.0% maint · 8.0% mgmt
Financing live
Cash to close
- Down payment
- $18,250
- Closing costs
- $2,190
- Reserves months
- —
- Total cash needed
- —
Loan-product check · same deal, 3 products live
Conventional
25% down · 7.5% · 30yr
- Down + closing
- —
- Monthly P&I
- —
- Monthly cashflow
- —
- DSCR
- —
- Eligible?
- —
Personal DTI + credit; lowest rate.
DSCR
20% down · 8.5% · 30yr
- Down + closing
- —
- Monthly P&I
- —
- Monthly cashflow
- —
- DSCR
- —
- Eligible?
- —
No personal income docs; deal must DSCR.
Hard money
10% down · 12.0% · 12mo
- Down + closing
- —
- Monthly P&I
- —
- Monthly cashflow
- —
- DSCR
- —
- Eligible?
- —
Short-term bridge; refi at stabilization.
Listing history 8 events
-
2026-06-19days on market $73,000 Active 6 DOM
-
2026-06-18days on market $73,000 Active 5 DOM
-
2026-06-17days on market $73,000 Active 4 DOM
-
2026-06-16days on market $73,000 Active 3 DOM
-
2026-06-16price $73,000 Active 2 DOM
-
2026-06-15days on market $73,000,000 Active 2 DOM
-
2026-06-14remarks 223-char remark
-
2026-06-14$73,000,000 Active 1 DOM
ⓘ Source: listings_history table (triggers on properties + properties_extension) + one-shot
backfill from property_details.listing_events for pre-trigger history.
Tax reassessment forecast IL · Partial reset (capped growth)
- Current annual tax
- $1,166 · $97/mo
- Projected year-2 tax
- $1,411 · $118/mo
- Expected delta
- +$246/yr (+$20/mo · 21.1%)
ⓘ Screening estimate from a state-policy table — verify with the county assessor before closing.
Climate risk First Street
- Flood 6/10 Major FEMA zone X (shaded) · 74% chance over 30 yrs
- Wildfire 1/10 Low
- Heat 3/10 Moderate 7 d/yr ≥105°F today · 16 d/yr by 30 yrs out
- Wind 2/10 Low
- Air quality 2/10 Low 1 unhealthy d/yr today · 2 by 30 yrs out
Nearby sold comps map
Loading sold comps map…
Walkable amenities ~0.75 mi
Loading nearby amenities…
Taxation est. · year 1
- Rental income
- $13,259
- − Mortgage interest
- −$4,089
- − Property taxes
- −$1,166
- − Insurance
- −$365
- − Repairs & maintenance
- −$1,061
- − Management
- −$1,061
- − Depreciation
- −$2,124
- Taxable income
- $3,394
- Est. tax owed @ 24.0%
- −$815
- After-tax cash flow
- $3,536/yr
For passive investors: Depreciation is non-cash, so a rental often shows a tax loss while cash-flowing — sheltering income. Rental losses are passive: they offset passive income freely, and up to $25,000/yr can offset ordinary (W-2) income if you actively participate and your MAGI is under $100k (phasing out to $0 by $150k); unused losses carry forward. On sale, claimed depreciation is recaptured at up to 25%, and gains may owe capital-gains tax (a 1031 exchange can defer both). Figures are a year-1 estimate at your 24.0% rate — not tax advice; consult a CPA.
Schools (NCES district)
- District
- West Central CUSD 235
- NCES district ID
- 1700319
- Math proficiency
- 8% ▼ -3.00%
- Reading proficiency
- 10% ▼ -9.00%
- Median HH income
- $47,424
- Composite
- 8.55/100
- National rank
- #9902
- State rank
- #581 of 620 in IL
Livability — Oquawka
- Score
- 64/100
- State rank
- #686
- US rank
- #14037
Category grades
Schools grade is shown separately in the Schools card above.
Census & demographics
- Census place
- Oquawka, IL
- Population (ZIP)
- 601
Population outlook (Henderson County) Hauer SSP2
- Today (2025)
- 6,231 people
- By 2030
- 5,815 · -6.7%
- By 2040
- 5,016 · -19.5%
- By 2050
- 4,310 · -30.8%
- By 2075
- 3,166 · -49.2%
- By 2100
- 2,285 · -63.3%
Race, ethnicity, and origin ACS 2023
- Neighborhood character
- Predominantly White (95%)
- Race & ethnicity
- White 95% Two or more races 4%
- Common ancestry
- Slovak 2% Portuguese 1% Iranian 1%
- Foreign-born
- 1%
- Languages at home
- 99% English-only · Other Asian/Pacific 1%
Political lean MEDSL · Henderson
- 2024 margin
- Solid R (+38.8) · D 29.6% · R 68.4% · Other 1.9%
- 2008→2024 swing
- -56.5pp toward R · 2008: 17.7pp · 2024: -38.8pp
- All cycles
- 2024: R+38.8 2020: R+33.0 2016: R+28.8 2012: D+12.3 2008: D+17.7
Not yet ingested
- Civics
- —
Market trends
- HPI YoY
- —
- Current HPI
- —
- Rent YoY
- —
- Metro
- —
- State GDP YoY
- ▲ 1.59%
- F500 in state
- 60
Industry mix (Fortune 500 HQ in IL)
| Industry | F500 HQs | Revenue |
|---|---|---|
| Insurance | 4 | $201B |
|
||
| Consumer Goods | 4 | $87B |
|
||
| Industrial Machinery | 3 | $64B |
|
||
| Healthcare | 2 | $55B |
|
||
| Retail / Pharmacy | 1 | $148B |
|
||
| Agriculture / Food | 1 | $86B |
|
||
Price history
1 event — show timeline
- 2026-05-27 Listed $73,000,000 IAR
Property tax history
+19.2%/yrLatest (2024): $1,166 · +8.8% YoY. Source: county tax records.
Cash-flow waterfall
monthlySold comps — $/sqft
last 12 mo · ≤1 miLoading sold comps…