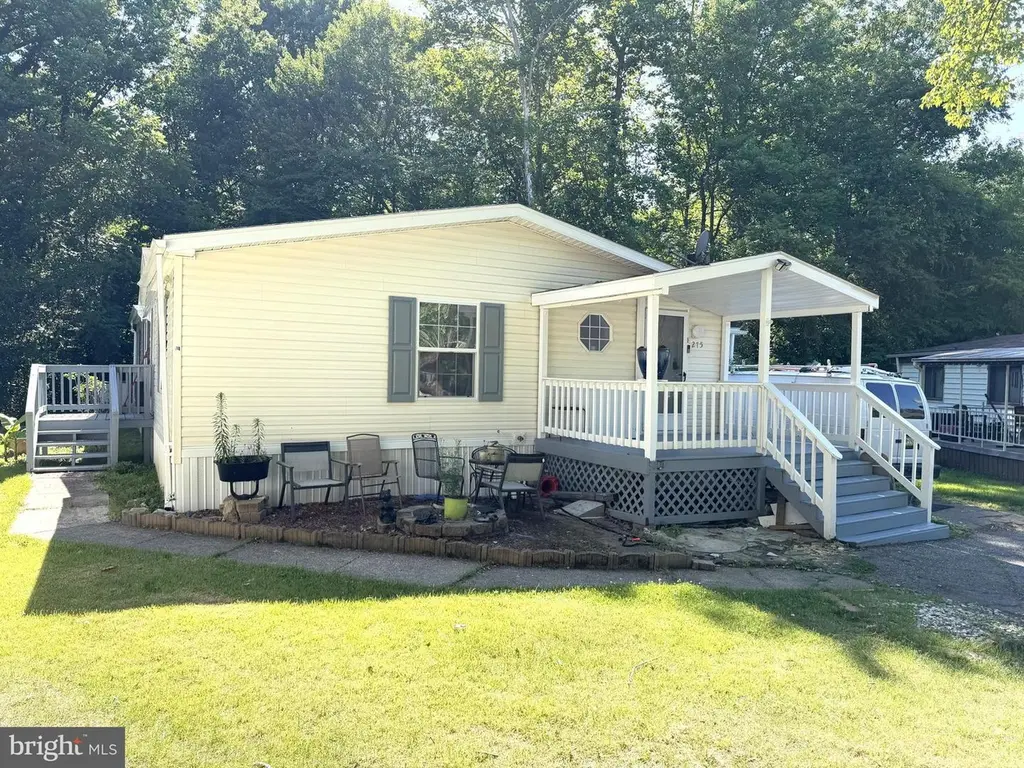
275 Janets Ct · Marlboro Meadows, MD
Flood risk 1/10 · Minimal
- FEMA flood zone
- X (unshaded)
- Chance of flooding over 30 yrs
- 0.0%
- Est. flood insurance / yr
- $507 – $1,088
Fire risk 1/10 · Minimal
- Est. fire insurance / yr
- $755 – $1,403
Heat risk 9/10 · Severe
- Hot days now (above 103°F)
- 7 days/yr
- Hot days in 30 yrs
- 17 days/yr
Wind risk 6/10 · Moderate
- Chance of severe wind over 30 yrs
- 27.0%
Air-quality risk 3/10 · Minor
- Unhealthy air days now
- 2 days/yr
- Unhealthy air days in 30 yrs
- 3 days/yr
Risk factors via First Street. Map © Google.
Why this score? — see what drove the C- grade
The composite is a weighted blend of 9 inputs, each scored 0–100. Each bar is that input's sub-score; the figure is the points it added to the 100-point composite (weight × sub-score).
- Cash flow +26.4/30.0
- DSCR +9.0/10.0
- 1% rule +7.1/10.0
- Livability +3.1/5.0
- Schools +2.9/10.0
- Rent growth +2.5/5.0
- Condition / age +2.5/5.0
- ARV discount +0.0/15.0
- Appreciation +0.0/10.0
$169,900
🖨 Deal sheet 📄 Offer letter ✓ Due diligence
Listing remarks MLS
Over 1800 sq ft in spacious triple wide. Large & bright rooms w/ lots of natural light. Kitchen appliances less than 1 yr old. 3 bedrooms/2 full baths. Soaking tub & sep shower in master bath. Great outdoor space too - deck, covered front porch, patio. Picturesque lot in woodland setting. Plenty of offstreet parking. Comm pool, b-ball ct, tennis, tot lots. New dog park on it's way. Lot rent $660/mo
Key facts
- Quartz counters
- Large family room
- New cabinets
Tags
Property features AI
Finance
- Other: Pets allowed with size/weight and breed restrictions; Land lease years remaining: 100
- HOA & community: Community pool; Land lease monthly payment applies (amount provided separately)
Exterior
- Parking: Concrete driveway; Driveway parking with 3 spaces (plus total of 3 garage/parking spaces)
- Utilities: Community water; Community septic tank; Electric hot water; Central A/C (electric); Propane heat (leased)
- Home design: Manufactured triple-wide home; Estimated effective remodel year 2025; Land lease ownership (land lease monthly); Facing/entry level information not provided
- Construction: Vinyl siding; Architectural shingle roof; Above-grade structures; Width approximately 24 ft, length approximately 60 ft; Make: CFCH
- Exterior features: Deck(s); Porch(es); Secure storage; Sidewalks; Property backs to trees; Located on a cul-de-sac; Community pool; Shed
Interior
- Kitchen: Refrigerator; Gas range/oven; Dishwasher; Built-in microwave; Upgraded countertops
- Bedrooms: 3 bedrooms on the main level
- Flooring: Ceramic tile; Luxury vinyl plank; Carpet
- Bathrooms: 2 full bathrooms on the main level; 2 full bathrooms total
- Heating & cooling: Forced air heating; Propane (leased) heating fuel; Central air conditioning (electric)
- Interior features: Soaking tub; Stall shower; Tub/shower combination; Ceiling fans; Crown moldings; Family room adjacent to the kitchen; Traditional floor plan; Formal dining room; Country-style kitchen; Bay-front master bedroom; Skylights; Upgraded countertops; Cathedral ceilings; Mantel on fireplace
- Laundry & utility: Washer; Dryer
Neighborhood map
What this means for you Summary
Snapshot
- This is a 3-bed/2.0-bath single-family listed at $170k.
Deal economics
- At list price, monthly cash flow is $443 ($5k/yr) — positive.
- The deal already cash-flows at list — no discount required.
- Meets the 1% rule at list price ($2k rent vs $170k).
Location & tenants
- Location reads 62/100 on livability (#327 in MD) — a middle-class / working-renter tenant base. Strengths: employment A+, housing A+, crime A-; Watch: amenities F, commute F, cost of living D-.
- Anne Arundel County Public Schools (suburban): math 20% / reading 37% proficiency, ranked #10 of 24 in MD (top 42%) — low school quality limits family demand, transient renter base, plan for 1-2y turnover.
- Zoned schools: Traceys Elementary (math 13% / reading 15%, grade F, #513 of 860 statewide, top 60%, 437 students, 60% FRL); Southern Middle (math 8% / reading 39%, grade F, #118 of 225 statewide, top 54%, 755 students, 45% FRL); Southern High (math 52% / reading 73%, grade B-, #62 of 222 statewide, top 29%, 1,066 students, 40% FRL) — zoned schools average 48% FRL vs 25% district-wide (23 pts higher); higher-poverty schools than district average — tighter screening recommended.
- Market conditions: 50 active listings in the ZIP; 1,303 units permitted in Anne Arundel County in 2024 (299 in 5+ unit buildings).
Forward outlook
- Local home prices are declining (-3.0%/yr); year-one equity from $1k of loan paydown is wiped out by about $5k of value loss. Plan a longer hold.
- Anne Arundel County population projected at +17% by 2050 — long-run rental-demand tailwind backs the buy-and-hold thesis.
- At projected returns (-3.0% appreciation + 3.0% rent growth), your $48k cash investment doubles in ~10 years — after that, you're playing with house money.
Negotiation context
- Only 12 days on market — expect competitive offers; lowballing is unlikely to land.
- 6 sale attempts since 13y ago with the ask held roughly flat each time — persistent listings suggest the price (not the market) is what's stuck; bring a comps-based counter.
- Current owner paid $65k; list at $170k implies a 161% gain — meaningful room to come down on a strong offer.
Risks & watch-outs
- Climate carrying-cost: major wind risk, 27% chance of damaging wind over 30y; extreme-heat days projected 7→17/yr by 2055 (HVAC capex compounding) — expect insurance premiums to compound above CPI over the hold.
Questions for the listing agent
- Is there a deadline driving the sale (1031 exchange, divorce, estate, relocation)? That informs how much negotiation room exists.
- Schools are D-rated, which usually means shorter tenancies and higher turnover. Who's the typical renter profile here, and what's been the actual vacancy rate?
- What's the average days-on-market for RENTAL listings here right now (not sales)? A rising rental-DOM trend means longer vacancies and softer asking-rent achievability than the comps imply.
- What's the recent tenant-quality profile in this submarket — average credit score on applications, eviction rate, late-payment / NSF rate, and stable-employment percentage? A property-management company in the area should have these aggregated.
- How much new for-sale + rental construction is in the pipeline within 1–3 miles? Heavy new supply typically softens prices + rents 12–24 months out; constrained supply supports both.
Investment metrics
- 1% rule
- 1.21% ✓
- Cap rate
- 9.42%
- Cash-on-cash
- 11.19%
- DSCR
- 1.50
- GRM
- 6.9
CMA / ARV
- ARV (on-the-fly)
- $138,700
- Comps found
- 12
Show comp detail 12 sales within ~0.75 mi
| Address | Dist | Beds/Ba | Sqft | Sold | Price | $/sf | Match |
|---|---|---|---|---|---|---|---|
| 460 Sarah Anne Dr | 0.20mi | 3/2.0 | 1,920 (+1%) | 3mo | $160,000 | $83 | 86 |
| 308 Berts Dr | 0.09mi | 4/2.0 (+1) | 1,900 (0%) | 9mo | $138,000 | $73 | 83 |
| 255 Rips Dr | 0.04mi | 4/2.0 (+1) | 1,900 (0%) | 18mo | $127,500 | $67 | 78 |
| 448 Sarah Anne Dr | 0.15mi | 4/2.0 (+1) | 1,960 (+3%) | 7mo | $155,000 | $79 | 77 |
| 474 Sarah Anne Dr | 0.17mi | 3/2.0 | 1,848 (-3%) | 19mo | $135,000 | $73 | 72 |
| 442 Sarah Anne Dr | 0.19mi | 4/2.0 (+1) | 1,900 (0%) | 21mo | $148,000 | $78 | 69 |
| 88 Edward Ln | 0.14mi | 3/2.0 | 1,750 (-8%) | 14mo | $94,000 | $54 | 69 |
| 302 Berts Dr | 0.12mi | 3/2.0 | 1,620 (-15%) | 8mo | $165,000 | $102 | 63 |
| 91 Berts Dr | 0.12mi | 3/2.0 | 1,660 (-13%) | 13mo | $160,000 | $96 | 62 |
| 222 Ella Welch Way | 0.08mi | 4/2.0 (+1) | 1,700 (-10%) | 17mo | $120,000 | $71 | 60 |
| 324 Boones Dr | 0.38mi | 3/2.0 | 1,780 (-6%) | 17mo | $130,400 | $73 | 58 |
| 95 Mary Lou Dr | 0.14mi | 3/2.0 | 2,100 (+10%) | 23mo | $130,000 | $62 | 56 |
Match score weights: distance 35% · size 25% · config 20% · recency 20%. Top-matched comps best support the ARV.
Projected returns pro-forma
-3.0% appreciation · 3.0% rent growth · sell at horizon
- IRR
- 0.4%
- Equity multiple
- 1.02×
- Total profit
- $743
- Equity at exit
- $25,333
- IRR
- 10.1%
- Equity multiple
- 1.78×
- Total profit
- $37,141
- Equity at exit
- $14,690
Cash invested: $47,572 (down + closing). Projections, not guarantees.
Landlord ↔ Tenant lean methodology
- Overall (STATE)
- 27 Tenant-Leaning
- State Maryland
- 27 Tenant-Leaning · D+14
- County
- — inherits STATE
- City
- — inherits STATE
ZIP-level market 20711
- Active inventory
- 50
- Price-to-rent
- 6.9×
Monthly cashflow live
- Estimated rent
- $2,048 medium interval (Pro) →
- Mortgage (P&I)
- −$891
- Tax est. 1.5%
- −$212 /mo · $2,548/yr
- Insurance
- −$71
- HOA
- −$0
- Vacancy / Maint / Mgmt
- −$430
- Net cashflow
- $443
Break-even live
UW: 25.0% down · 7.5% · 30yr · 1.5% tax · 5.0% vac · 8.0% maint · 8.0% mgmt
Financing live
Cash to close
- Down payment
- $42,475
- Closing costs
- $5,097
- Reserves months
- —
- Total cash needed
- —
Loan-product check · same deal, 3 products live
Conventional
25% down · 7.5% · 30yr
- Down + closing
- —
- Monthly P&I
- —
- Monthly cashflow
- —
- DSCR
- —
- Eligible?
- —
Personal DTI + credit; lowest rate.
DSCR
20% down · 8.5% · 30yr
- Down + closing
- —
- Monthly P&I
- —
- Monthly cashflow
- —
- DSCR
- —
- Eligible?
- —
No personal income docs; deal must DSCR.
Hard money
10% down · 12.0% · 12mo
- Down + closing
- —
- Monthly P&I
- —
- Monthly cashflow
- —
- DSCR
- —
- Eligible?
- —
Short-term bridge; refi at stabilization.
Listing history 9 events
-
2026-06-18days on market $169,900 Active 12 DOM
-
2026-06-17days on market $169,900 Active 11 DOM
-
2026-06-16days on market $169,900 Active 10 DOM
-
2026-06-15days on market $169,900 Active 9 DOM
-
2026-06-13days on market $169,900 Active 7 DOM
-
2026-06-09days on market $169,900 Active 3 DOM
-
2026-06-08days on market $169,900 Active 2 DOM
-
2026-06-07remarks 699-char remark
-
2026-06-07$169,900 Active 1 DOM
ⓘ Source: listings_history table (triggers on properties + properties_extension) + one-shot
backfill from property_details.listing_events for pre-trigger history.
Climate risk First Street
- Flood 1/10 Low FEMA zone X (unshaded) · 0% chance over 30 yrs
- Wildfire 1/10 Low
- Heat 9/10 Extreme 7 d/yr ≥103°F today · 17 d/yr by 30 yrs out
- Wind 6/10 Major 27% chance of damaging wind over 30 yrs
- Air quality 3/10 Moderate 2 unhealthy d/yr today · 3 by 30 yrs out
Nearby sold comps map
Loading sold comps map…
Walkable amenities ~0.75 mi
Loading nearby amenities…
Taxation est. · year 1
- Rental income
- $24,571
- − Mortgage interest
- −$9,517
- − Property taxes
- −$2,548
- − Insurance
- −$850
- − Repairs & maintenance
- −$1,966
- − Management
- −$1,966
- − Depreciation
- −$4,943
- Taxable income
- $2,782
- Est. tax owed @ 24.0%
- −$668
- After-tax cash flow
- $4,654/yr
For passive investors: Depreciation is non-cash, so a rental often shows a tax loss while cash-flowing — sheltering income. Rental losses are passive: they offset passive income freely, and up to $25,000/yr can offset ordinary (W-2) income if you actively participate and your MAGI is under $100k (phasing out to $0 by $150k); unused losses carry forward. On sale, claimed depreciation is recaptured at up to 25%, and gains may owe capital-gains tax (a 1031 exchange can defer both). Figures are a year-1 estimate at your 24.0% rate — not tax advice; consult a CPA.
Schools (NCES district)
- District
- Anne Arundel County Public Schools
- NCES district ID
- 2400060
- Math proficiency
- 20% ▼ -21.00%
- Reading proficiency
- 37% ▼ -13.00%
- Median HH income
- $87,880
- Composite
- 28.52/100
- National rank
- #6733
- State rank
- #10 of 24 in MD
Livability — Marlboro Meadows
- Score
- 62/100
- State rank
- #327
- US rank
- #17129
Category grades
Schools grade is shown separately in the Schools card above.
Census & demographics
- Population (ZIP)
- 7,629
Population outlook (Anne Arundel County) Hauer SSP2
- Today (2025)
- 617,384 people
- By 2030
- 642,094 · +4.0%
- By 2040
- 686,621 · +11.2%
- By 2050
- 723,031 · +17.1%
- By 2075
- 809,346 · +31.1%
- By 2100
- 837,658 · +35.7%
Race, ethnicity, and origin ACS 2023
- Neighborhood character
- Diverse neighborhood (Simpson 0.57)
- Race & ethnicity
- White 60% Hispanic / Latino 24% Two or more races 12% Black 11%
- Hispanic origin (detail)
- Mexican 2% Puerto Rican 2%
- Common ancestry
- Portuguese 3% Scotch-Irish 2% Italian 1%
- Foreign-born
- 10% · Canada
- Languages at home
- 86% English-only · Spanish 10% Other Asian/Pacific 2%
Political lean MEDSL · Anne Arundel
- 2024 margin
- D (+13.9) · D 55.7% · R 41.7% · Other 2.6%
- 2008→2024 swing
- +15.7pp toward D · 2008: -1.8pp · 2024: 13.9pp
- All cycles
- 2024: D+13.9 2020: D+14.5 2016: D+0.7 2012: R+0.9 2008: R+1.8
Not yet ingested
- Civics
- —
Market trends
- HPI YoY
- ▼ -131.12%
- Current HPI
- 232.1067
- Rent YoY
- —
- Metro
- —
- State GDP YoY
- ▲ 2.97%
- F500 in state
- 12
Industry mix (Fortune 500 HQ in MD)
| Industry | F500 HQs | Revenue |
|---|---|---|
| Aerospace / Defense | 1 | $71B |
|
||
| Utilities | 1 | $25B |
|
||
| Hotels | 1 | $24B |
|
||
| Consumer Goods | 1 | $7B |
|
||
| Real Estate | 1 | $6B |
|
||
| Chemicals | 1 | $2B |
|
||
Price history
+150.2% since first listed16 events — show timeline
- 2026-06-06 Listed $169,900 BRIGHT MLS
- 2020-10-31 Listing Removed — BRIGHT MLS
- 2020-08-16 Listed $94,500 BRIGHT MLS
- 2014-10-20 Sold (MLS) $65,000 BRIGHT MLS
- 2014-10-20 Sold (MLS) $65,000 MRIS
- 2014-09-03 Pending — MRIS
- 2014-09-03 Delisted — MRIS
- 2014-09-03 Listing Removed — BRIGHT MLS
- 2014-08-11 Listed $67,500 MRIS
- 2014-08-11 Listed $67,500 BRIGHT MLS
- 2013-08-23 Sold (MLS) $65,000 MRIS
- 2013-08-23 Sold (MLS) $65,000 BRIGHT MLS
- 2013-07-09 Pending — MRIS
- 2013-07-09 Listing Removed — BRIGHT MLS
- 2013-05-21 Listed $67,900 MRIS
- 2013-05-20 Listed $67,900 BRIGHT MLS
Cash-flow waterfall
monthlySold comps — $/sqft
last 12 mo · ≤1 miLoading sold comps…