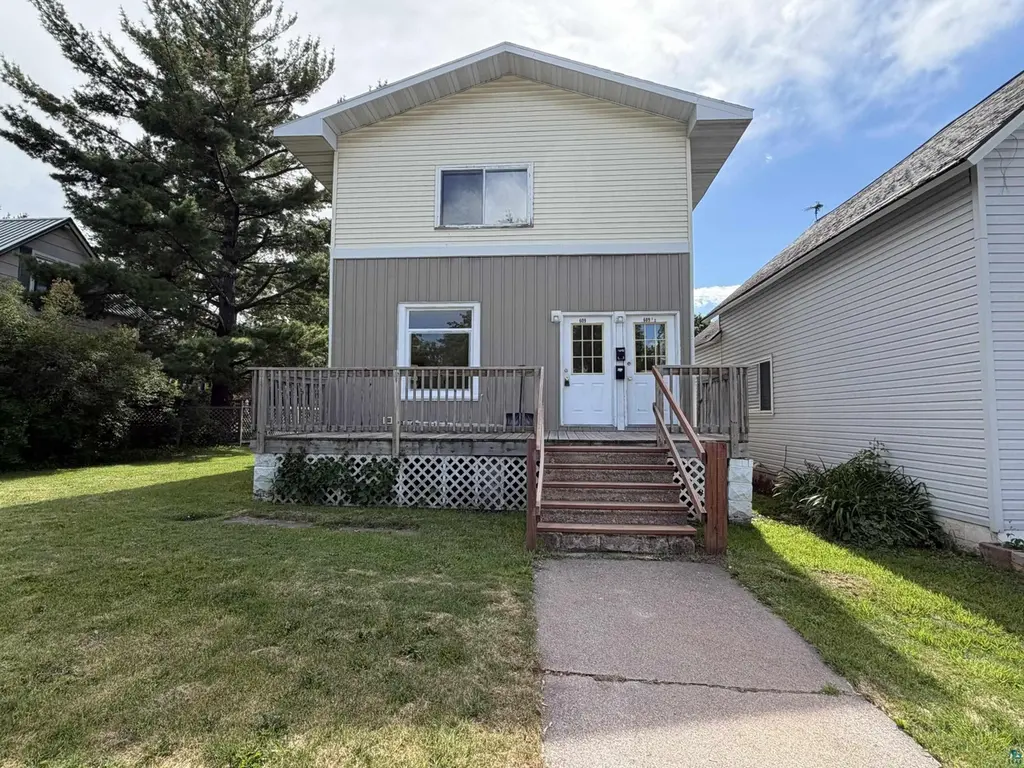
 Duplex
609 10th Ave Ave W · Ashland, WI
Flood risk 1/10 · Minimal
- FEMA flood zone
- X
- Chance of flooding over 30 yrs
- 0.0%
- Est. flood insurance / yr
- $473 – $860
Fire risk 1/10 · Minimal
- Est. fire insurance / yr
- $636 – $1,182
Heat risk 1/10 · Minimal
- Hot days now (above 92°F)
- 7 days/yr
- Hot days in 30 yrs
- 13 days/yr
Wind risk 1/10 · Minimal
- Chance of severe wind over 30 yrs
- —
Air-quality risk 1/10 · Minimal
- Unhealthy air days now
- 0 days/yr
- Unhealthy air days in 30 yrs
- 0 days/yr
Risk factors via First Street. Map © Google.
Why this score? — see what drove the D grade
The composite is a weighted blend of 9 inputs, each scored 0–100. Each bar is that input's sub-score; the figure is the points it added to the 100-point composite (weight × sub-score).
- Cash flow +15.0/30.0
- ARV discount +7.5/15.0
- 1% rule +5.0/10.0
- DSCR +5.0/10.0
- Livability +4.2/5.0
- Rent growth +2.5/5.0
- Condition / age +2.5/5.0
- Schools +1.9/10.0
- Appreciation +0.0/10.0
$1,200
🖨 Deal sheet 📄 Offer letter ✓ Due diligence
Multi-family units
County records classify this as Multi-Family (2-4 Unit). Listing-text estimate: 2 units. confirmed
Listing remarks MLS
Well maintained duplex featuring 2 -2 bedroom, 1 full bath units. Each unit offers comfortable layout with spacious living areas and functional kitchens. The property includes a full basement providing additional storage and washer dryer hookup. Utilities include separate electrical for each unit, along with one furnace and one hot water heater serving the building. Outside you will find off street parking adding convenience for tenants or owners. This property is a great opportunity for an investment property or owner occupied rental.
Key facts
- Pet-friendly
- Forced air heat
- Off-street parking
Tags
Property features AI
Exterior
- Parking: No on‑site parking listed
- Utilities: Public water; Public sewer
- Home design: Duplex (residential income property); 2 stories total
- Construction: Above-grade finished area 1,728; Below-grade finished area 864
- Exterior features: Lot dimensions approximately 140 x 50; Lot size about 0.16 acres
Interior
- Bedrooms: Two 2‑bedroom units
- Bathrooms: One unit with 2 bathrooms; one unit with 1 bathroom
- Heating & cooling: Forced air heating
- Interior features: Full basement; Has heating
Neighborhood map
What this means for you Summary
Snapshot
- This is a 2 × 2-bed/1.5-bath units multifamily listed at $1k.
Deal economics
- At list price, monthly cash flow is $2k ($21k/yr) — positive. Per door: $881/mo.
- The deal already cash-flows at list — no discount required.
- Meets the 1% rule at list price ($2k rent vs $1k).
- Cap rate 1767.6% vs local median 3.5% in Ashland — top-decile yield for the area; either an underpriced asset or a hidden risk that comps aren't pricing in. Stress-test before assuming the spread holds.
Location & tenants
- Location reads 84/100 on livability (#37 in WI, #750 nationally) — a professional / high-income tenant draw. Strengths: cost of living A+, health & safety A+, commute A; Watch: schools C-, employment F.
- Ashland School District (town): math 16% / reading 30% proficiency, ranked #325 of 342 in WI (top 95%) — low school quality limits family demand, transient renter base, plan for 1-2y turnover.
- Market conditions: 85 active listings in the ZIP; 30 units permitted in Ashland County in 2024 (0 in 5+ unit buildings).
Forward outlook
- Local home prices are declining (-3.0%/yr); year-one equity from $8 of loan paydown is wiped out by about $36 of value loss. Plan a longer hold.
- Ashland County population projected at -22% by 2050 — secular population decline; favor cash flow + early exit over multi-decade hold.
- At projected returns (-3.0% appreciation + 3.0% rent growth), your $336 cash investment doubles in ~1 year — after that, you're playing with house money.
Negotiation context
- Only 2 days on market — expect competitive offers; lowballing is unlikely to land.
- 3 sale attempts with the ask held roughly flat each time — persistent listings suggest the price (not the market) is what's stuck; bring a comps-based counter.
Risks & watch-outs
- Watch-outs: built in 1920 — expect roof / HVAC / electrical / plumbing capex.
Questions for the listing agent
- Can we see the unit-by-unit rent roll, current vacancy, and any below-market leases? What's the average tenancy length?
- What capital expenditures (roof, boiler, parking lot, exteriors) have been made in the last 5 years, and what's planned in the next 2?
- Built in 1920 — when were the roof, HVAC, electrical panel, plumbing, and water heater last replaced?
- Is there a deadline driving the sale (1031 exchange, divorce, estate, relocation)? That informs how much negotiation room exists.
- The area grade is low — what's the realistic commute time and amenity access for the typical tenant pool here? Any planned neighborhood developments (good or bad) we should know about?
- What's the average days-on-market for RENTAL listings here right now (not sales)? A rising rental-DOM trend means longer vacancies and softer asking-rent achievability than the comps imply.
- What's the recent tenant-quality profile in this submarket — average credit score on applications, eviction rate, late-payment / NSF rate, and stable-employment percentage? A property-management company in the area should have these aggregated.
- How much new apartment / multifamily construction is in the pipeline within 1–3 miles? Heavy new supply (>2% of stock underway) typically softens rents 12–24 months out; light construction supports rent growth.
Investment metrics
- 1% rule
- 186.67% ✓
- Cap rate
- 1767.60%
- Cash-on-cash
- 6290.38%
- DSCR
- 280.89
- GRM
- 0.0
CMA / ARV
No comps found within radius.
Projected returns pro-forma
-3.0% appreciation · 3.0% rent growth · sell at horizon
- IRR
- —
- Equity multiple
- 334.39×
- Total profit
- $112,018
- Equity at exit
- $179
- IRR
- —
- Equity multiple
- 721.62×
- Total profit
- $242,128
- Equity at exit
- $104
Cash invested: $336 (down + closing). Projections, not guarantees.
Landlord ↔ Tenant lean methodology
- Overall (STATE)
- 73 Landlord-Friendly
- State Wisconsin
- 73 Landlord-Friendly · R+2
- County
- — inherits STATE
- City
- — inherits STATE
ZIP-level market 54806
- Active inventory
- 85
- Price-to-rent
- 0.1×
Monthly cashflow live
- Estimated rent
- $2,240 medium interval (Pro) →
- Mortgage (P&I)
- −$6
- Tax est. 1.5%
- −$2 /mo · $18/yr
- Insurance
- −$0
- HOA
- −$0
- Vacancy / Maint / Mgmt
- −$470
- Net cashflow
- $1,761
Break-even live
2-unit breakdown (identical units grouped — click to expand)
| Units | Beds | Baths | Est. rent |
|---|---|---|---|
| 2× units | 2 | 1.5 | $2,240 |
| #1 | 2 | 1.5 | $1,120 |
| #2 | 2 | 1.5 | $1,120 |
| Total (2 units) | $2,240 | ||
UW: 25.0% down · 7.5% · 30yr · 1.5% tax · 5.0% vac · 8.0% maint · 8.0% mgmt
Financing live
Cash to close
- Down payment
- $300
- Closing costs
- $36
- Reserves months
- —
- Total cash needed
- —
Loan-product check · same deal, 3 products live
Conventional
25% down · 7.5% · 30yr
- Down + closing
- —
- Monthly P&I
- —
- Monthly cashflow
- —
- DSCR
- —
- Eligible?
- —
Personal DTI + credit; lowest rate.
DSCR
20% down · 8.5% · 30yr
- Down + closing
- —
- Monthly P&I
- —
- Monthly cashflow
- —
- DSCR
- —
- Eligible?
- —
No personal income docs; deal must DSCR.
Hard money
10% down · 12.0% · 12mo
- Down + closing
- —
- Monthly P&I
- —
- Monthly cashflow
- —
- DSCR
- —
- Eligible?
- —
Short-term bridge; refi at stabilization.
Listing history 3 events
-
2026-06-18days on market $1,200 Active 2 DOM
-
2026-06-17remarks 401-char remark
-
2026-06-17$1,200 Active 1 DOM
ⓘ Source: listings_history table (triggers on properties + properties_extension) + one-shot
backfill from property_details.listing_events for pre-trigger history.
Climate risk First Street
- Flood 1/10 Low FEMA zone X · 0% chance over 30 yrs
- Wildfire 1/10 Low
- Heat 1/10 Low 7 d/yr ≥92°F today · 13 d/yr by 30 yrs out
- Wind 1/10 Low
- Air quality 1/10 Low 0 unhealthy d/yr today · 0 by 30 yrs out
Nearby sold comps map
Loading sold comps map…
Walkable amenities ~0.75 mi
Loading nearby amenities…
Taxation est. · year 1
- Rental income
- $26,880
- − Mortgage interest
- −$67
- − Property taxes
- −$18
- − Insurance
- −$6
- − Repairs & maintenance
- −$2,150
- − Management
- −$2,150
- − Depreciation
- −$35
- Taxable income
- $22,453
- Est. tax owed @ 24.0%
- −$5,389
- After-tax cash flow
- $15,747/yr
For passive investors: Depreciation is non-cash, so a rental often shows a tax loss while cash-flowing — sheltering income. Rental losses are passive: they offset passive income freely, and up to $25,000/yr can offset ordinary (W-2) income if you actively participate and your MAGI is under $100k (phasing out to $0 by $150k); unused losses carry forward. On sale, claimed depreciation is recaptured at up to 25%, and gains may owe capital-gains tax (a 1031 exchange can defer both). Figures are a year-1 estimate at your 24.0% rate — not tax advice; consult a CPA.
Schools (NCES district)
- District
- Ashland School District
- NCES district ID
- 5500510
- Math proficiency
- 16% ▼ -16.00%
- Reading proficiency
- 30% ▼ -4.00%
- Median HH income
- $40,114
- Composite
- 19.4/100
- National rank
- #8782
- State rank
- #325 of 342 in WI
Livability — Ashland
- Score
- 84/100
- State rank
- #37
- US rank
- #750
Category grades
Schools grade is shown separately in the Schools card above.
Census & demographics
- Census place
- Ashland, WI
- Population (ZIP)
- 11,708
Population outlook (Ashland County) Hauer SSP2
- Today (2025)
- 15,204 people
- By 2030
- 14,639 · -3.7%
- By 2040
- 13,198 · -13.2%
- By 2050
- 11,841 · -22.1%
- By 2075
- 9,755 · -35.8%
- By 2100
- 8,675 · -42.9%
Race, ethnicity, and origin ACS 2023
- Neighborhood character
- Predominantly White (81%)
- Race & ethnicity
- White 81% Native American 9% Two or more races 6% Hispanic / Latino 4%
- Common ancestry
- Romanian 8% Portuguese 6% Lithuanian 2%
- Foreign-born
- 2% · Canada
- Languages at home
- 96% English-only · Spanish 1% Other Indo-European 1%
Political lean MEDSL · Ashland
- 2024 margin
- Toss-up / Even · D 51.6% · R 46.9% · Other 1.5%
- 2008→2024 swing
- -32.4pp toward R · 2008: 37.1pp · 2024: 4.7pp
- All cycles
- 2024: D+4.7 2020: D+11.0 2016: D+8.9 2012: D+30.8 2008: D+37.1
Not yet ingested
- Civics
- —
Market trends
- HPI YoY
- ▼ -142.11%
- Current HPI
- 168.3012
- Rent YoY
- —
- Metro
- —
- State GDP YoY
- ▲ 2.10%
- F500 in state
- 20
Industry mix (Fortune 500 HQ in WI)
| Industry | F500 HQs | Revenue |
|---|---|---|
| Industrial Machinery | 4 | $23B |
|
||
| Industrial Technology | 2 | $36B |
|
||
| Insurance | 1 | $36B |
|
||
| Professional Services | 1 | $19B |
|
||
| Utilities | 1 | $9B |
|
||
| Consumer Goods | 1 | $3B |
|
||
Price history
-99.2% since first listed7 events — show timeline
- 2026-06-16 Listed $1,200 LSAR
- 2026-04-30 Sold (MLS) $166,000 SAAR
- 2026-04-30 Sold (MLS) $166,000 LSAR
- 2026-03-19 Pending — LSAR
- 2026-03-19 Pending — SAAR
- 2026-03-12 Listed $160,000 SAAR
- 2026-03-12 Listed $160,000 LSAR
Cash-flow waterfall
monthlySold comps — $/sqft
last 12 mo · ≤1 miLoading sold comps…