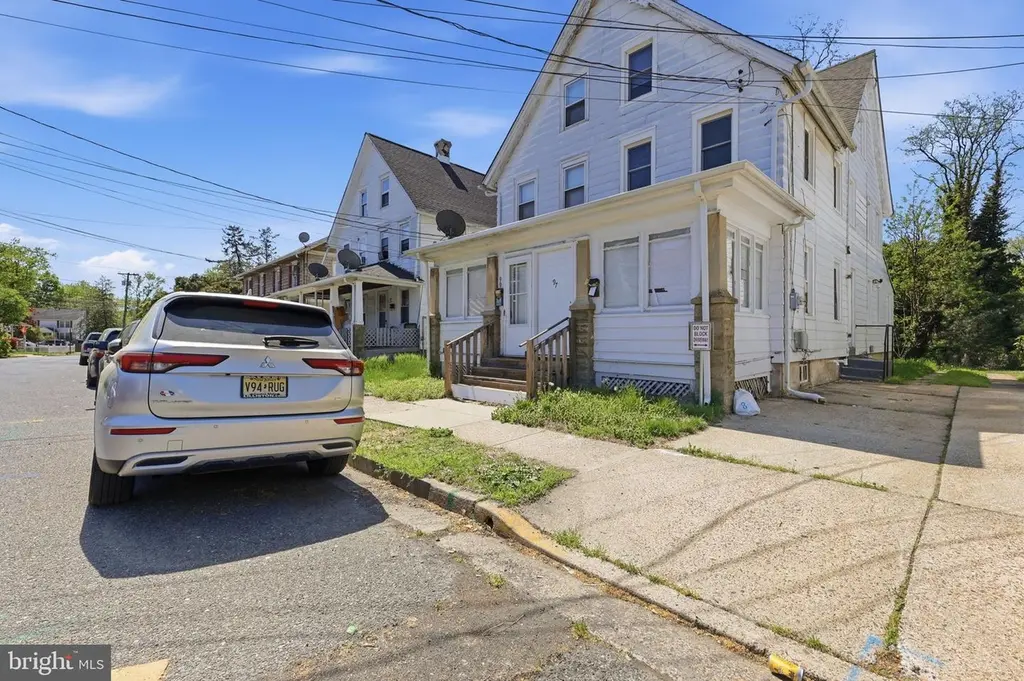
99 Chestnut St · Salem, NJ
Flood risk 9/10 · Severe
- FEMA flood zone
- X (shaded)
- Chance of flooding over 30 yrs
- 0.99%
- Est. flood insurance / yr
- $507 – $1,088
Fire risk 2/10 · Minimal
- Est. fire insurance / yr
- $526 – $976
Heat risk 7/10 · Major
- Hot days now (above 103°F)
- 7 days/yr
- Hot days in 30 yrs
- 15 days/yr
Wind risk 6/10 · Moderate
- Chance of severe wind over 30 yrs
- 27.0%
Air-quality risk 3/10 · Minor
- Unhealthy air days now
- 2 days/yr
- Unhealthy air days in 30 yrs
- 4 days/yr
Risk factors via First Street. Map © Google.
Why this score? — see what drove the B grade
The composite is a weighted blend of 9 inputs, each scored 0–100. Each bar is that input's sub-score; the figure is the points it added to the 100-point composite (weight × sub-score).
- Cash flow +27.5/30.0
- ARV discount +11.2/15.0
- DSCR +9.6/10.0
- 1% rule +7.7/10.0
- Appreciation +4.8/10.0
- Livability +3.1/5.0
- Rent growth +2.5/5.0
- Condition / age +2.5/5.0
- Schools +1.2/10.0
$125,000
🖨 Deal sheet 📄 Offer letter ✓ Due diligence
Listing remarks
99 Chestnut St is being offered individually, providing a great opportunity for investors or owner-occupants alike. This 3-bedroom, 1-bath home offers strong potential with a traditional layout, generous living space, and solid structural bones ready for your vision and improvements. Whether you're looking to renovate for increased rental income, add value through cosmetic updates, or customize the home as a primary residence, the possibilities are endless. Located within Salem’s redevelopment area, the property stands to benefit from ongoing revitalization and future growth throughout the neighborhood. With long-term upside potential and flexibility, 99 Chestnut St is an excellent op
Key facts
- Built 1925
- Listed 31 days
Tags
Property features AI
Exterior
- Parking: On-street parking
- Utilities: Public water; Public sewer; Electric service available; Natural gas available; Cable TV available; Natural gas hot water
- Home design: Semi-detached property; Main entrance faces west; Entry level is 1; Urban location
- Construction: Aluminum siding; Brick/mortar foundation; Above- and below-grade structures; Year built estimated; major renovation effective 2025
- Exterior features: Front yard; Rear yard; Property located in a federal flood zone
Interior
- Kitchen: Eat-in kitchen
- Bedrooms: Two bedrooms on the first upper level; One bedroom on the second upper level
- Flooring: Carpet; Hardwood; Vinyl
- Bathrooms: One full bathroom (all upper levels)
- Heating & cooling: Radiator heat; Natural gas heating and hot water
- Interior features: Open floor plan; Dining area; Kitchen with eat-in space; Carpeted areas
- Laundry & utility: Laundry in the basement
Neighborhood map
What this means for you Summary
Snapshot
- This is a 3-bed/1.0-bath townhouse listed at $125k.
Deal economics
- At list price, monthly cash flow is $303 ($4k/yr) — positive.
- The deal already cash-flows at list — no discount required.
- Meets the 1% rule at list price ($2k rent vs $125k).
- Recommended offer: $121k (3.0% below list) — sets the bar for market timing.
Location & tenants
- Location reads 61/100 on livability (#462 in NJ) — a middle-class / working-renter tenant base. Strengths: cost of living A+, health & safety A+, crime B; Watch: schools D, amenities F, commute F.
- Salem City School District (town): math 6% / reading 24% proficiency, ranked #464 of 472 in NJ (top 98%) — low school quality limits family demand, transient renter base, plan for 1-2y turnover; 85% free/reduced lunch — lower-income household profile, screen leases tightly.
- Market conditions: 100 active listings in the ZIP; 10 comparable units currently listed for rent nearby; rentals leasing fast (median 2d on market — plan ~1-2 weeks tenant-placement turnaround); 95 units permitted in Salem County in 2024 (0 in 5+ unit buildings).
- This rent runs 35% of the median local income ($55k/yr) — at the standard rent-burdened threshold; future hikes will face affordability resistance.
Forward outlook
- In year one you build about $389 of equity ($864 loan paydown + $-475 appreciation (-0.4% local appreciation)).
- Salem County population projected at -23% by 2050 — secular population decline; favor cash flow + early exit over multi-decade hold.
- At projected returns (-0.4% appreciation + 3.0% rent growth), your $35k cash investment doubles in ~7 years — after that, you're playing with house money.
Negotiation context
- It's been on market 31 days — a 3% lower offer ($121k) is reasonable based on typical stale-listing flexibility.
- 9 sale attempts since 7y ago with the ask held roughly flat each time — persistent listings suggest the price (not the market) is what's stuck; bring a comps-based counter.
- Current owner paid $69k; list at $125k implies a 82% gain — meaningful room to come down on a strong offer.
Risks & watch-outs
- Watch-outs: flood insurance adds $66/mo; built in 1925 — expect roof / HVAC / electrical / plumbing capex.
- Climate carrying-cost: severe flood risk; major wind risk, 27% chance of damaging wind over 30y; extreme-heat days projected 7→15/yr by 2055 (HVAC capex compounding) — expect insurance premiums to compound above CPI over the hold.
Questions for the listing agent
- It's been on market 31 days. Have you received any prior offers? Is the seller open to a 3% concession, seller financing, or rate buy-down credit?
- Built in 1925 — when were the roof, HVAC, electrical panel, plumbing, and water heater last replaced?
- What's the actual annual flood-insurance premium (NFIP or private), and is the property in a SFHA with mandatory coverage?
- Is there a deadline driving the sale (1031 exchange, divorce, estate, relocation)? That informs how much negotiation room exists.
- Schools are D-rated, which usually means shorter tenancies and higher turnover. Who's the typical renter profile here, and what's been the actual vacancy rate?
- What's the average days-on-market for RENTAL listings here right now (not sales)? A rising rental-DOM trend means longer vacancies and softer asking-rent achievability than the comps imply.
- What's the recent tenant-quality profile in this submarket — average credit score on applications, eviction rate, late-payment / NSF rate, and stable-employment percentage? A property-management company in the area should have these aggregated.
- How much new for-sale + rental construction is in the pipeline within 1–3 miles? Heavy new supply typically softens prices + rents 12–24 months out; constrained supply supports both.
Investment metrics
- 1% rule
- 1.27% ✓
- Cap rate
- 9.84%
- Cash-on-cash
- 12.68%
- DSCR
- 1.56
- GRM
- 6.5
CMA / ARV
- ARV (on-the-fly)
- $136,224
- Comps found
- 8
Show comp detail 8 sales within ~0.75 mi
| Address | Dist | Beds/Ba | Sqft | Sold | Price | $/sf | Match |
|---|---|---|---|---|---|---|---|
| 183 E Broadway Unit C-8 | 0.28mi | 3/— | 967 (-6%) | 2mo | $60,000 | $62 | 75 |
| 229 Sinnickson St | 0.27mi | 3/1.0 | 888 (-14%) | 7mo | $105,000 | $118 | 59 |
| 14 Church St | 0.29mi | 3/2.0 | 1,080 (+5%) | 23mo | $149,900 | $139 | 56 |
| 183 E Broadway | 0.28mi | 2/1.0 (-1) | 888 (-14%) | 7mo | $118,000 | $133 | 53 |
| 284 Morrison Ave | 0.53mi | 3/1.0 | 1,176 (+14%) | 1mo | $155,000 | $132 | 51 |
| 286 Morrison Ave | 0.53mi | 2/1.0 (-1) | 1,176 (+14%) | 1mo | $35,000 | $30 | 46 |
| 311 E Broadway | 0.41mi | 2/1.0 (-1) | 1,168 (+13%) | 24mo | $83,000 | $71 | 34 |
| 106 Eighth St | 0.59mi | 4/2.0 (+1) | 1,170 (+13%) | 10mo | $154,500 | $132 | 33 |
Match score weights: distance 35% · size 25% · config 20% · recency 20%. Top-matched comps best support the ARV.
Projected returns pro-forma
-0.38% appreciation · 3.0% rent growth · sell at horizon
- IRR
- 8.3%
- Equity multiple
- 1.39×
- Total profit
- $13,536
- Equity at exit
- $33,938
- IRR
- 13.8%
- Equity multiple
- 2.46×
- Total profit
- $50,939
- Equity at exit
- $38,958
Cash invested: $35,000 (down + closing). Projections, not guarantees.
Landlord ↔ Tenant lean methodology
- Overall (STATE)
- 21 Tenant-Leaning
- State New Jersey
- 21 Tenant-Leaning · D+6
- County
- — inherits STATE
- City
- — inherits STATE
ZIP-level market 08079
- Home prices YoY
- -0.1%
- Active inventory
- 100
- Price-to-rent
- 6.5×
Monthly cashflow live
- Estimated rent
- $1,592 high interval (Pro) →
- Mortgage (P&I)
- −$656
- Tax from tax record
- −$180 /mo · $2,166/yr
- Insurance
- −$52
- Flood insurance flood zone
- −$66 /mo · $798/yr
- HOA
- −$0
- Vacancy / Maint / Mgmt
- −$334
- Net cashflow
- $303
Break-even live
UW: 25.0% down · 7.5% · 30yr · 1.5% tax · 5.0% vac · 8.0% maint · 8.0% mgmt
Financing live
Cash to close
- Down payment
- $31,250
- Closing costs
- $3,750
- Reserves months
- —
- Total cash needed
- —
Loan-product check · same deal, 3 products live
Conventional
25% down · 7.5% · 30yr
- Down + closing
- —
- Monthly P&I
- —
- Monthly cashflow
- —
- DSCR
- —
- Eligible?
- —
Personal DTI + credit; lowest rate.
DSCR
20% down · 8.5% · 30yr
- Down + closing
- —
- Monthly P&I
- —
- Monthly cashflow
- —
- DSCR
- —
- Eligible?
- —
No personal income docs; deal must DSCR.
Hard money
10% down · 12.0% · 12mo
- Down + closing
- —
- Monthly P&I
- —
- Monthly cashflow
- —
- DSCR
- —
- Eligible?
- —
Short-term bridge; refi at stabilization.
Rent comps 10 comps
| Address | Beds | Baths | Sqft | Rent | $/sqft | DOM | Units | Dist |
|---|---|---|---|---|---|---|---|---|
| 26 Walnut St Unit A Salem, NJ | 2.0 | 1.0 | 1000 | $1,225 | $1.23 | 1d | 1 | 0.24mi |
| 218 Sinnickson St Salem, NJ | 2.0 | 1.0 | 1008 | $1,500 | $1.49 | 1d | 1 | 0.27mi |
| 56 Olive St Salem, NJ | 2.0 | 1.0 | 700 | $1,200 | $1.71 | 1d | 1 | 0.37mi |
| 1 9th St Salem, NJ | 2.0 | 1.0 | 900 | $1,450 | $1.61 | 1d | 1 | 0.42mi |
| 242 Grant St Unit 1ST FLOOR Salem, NJ | 2.0 | 1.0 | 925 | $1,675 | $1.81 | 1d | 1 | 0.50mi |
| 380 E Broadway Salem, NJ | 2.0 | 1.0 | 1300 | $1,350 | $1.04 | 1d | 1 | 0.63mi |
| 37 Eighth St Salem, NJ | 3.0 | 1.0 | 1092 | $1,850 | $1.69 | 1d | 1 | 0.72mi |
| 23 7th St Unit B Salem, NJ | 3.0 | 1.0 | 1000 | $1,450 | $1.45 | 3d | 1 | 0.72mi |
| 124 Yorke St Unit 37 Salem, NJ | 2.0 | 1.0 | 1220 | $1,350 | $1.11 | 2d | 1 | 0.86mi |
| 124 Yorke St Unit 2BR Salem, NJ | 2.0 | 1.0 | 750 | $1,400 | $1.87 | 10d | 1 | 0.86mi |
Listing history 40 events
-
2026-06-18days on market $125,000 Active 31 DOM
-
2026-06-17days on market $125,000 Active 30 DOM
-
2026-06-16days on market $125,000 Active 29 DOM
-
2026-06-16price $125,000 Active 28 DOM
-
2026-06-15days on market $130,000 Active 28 DOM
-
2026-06-13days on market $130,000 Active 26 DOM
-
2026-06-13days on market $130,000 Active 25 DOM
-
2026-06-09days on market $130,000 Active 22 DOM
-
2026-06-08days on market $130,000 Active 21 DOM
-
2026-06-07days on market $130,000 Active 20 DOM
-
2026-06-04days on market $130,000 Active 17 DOM
-
2026-06-03days on market $130,000 Active 16 DOM
-
2026-06-02days on market $130,000 Active 15 DOM
-
2026-06-01days on market $130,000 Active 14 DOM
-
2026-05-31days on market $130,000 Active 13 DOM
-
2026-05-17status Pending
-
2026-05-06$130,000 Active
-
2026-04-25historical
-
2026-04-24$235,000 Active
-
2026-02-02historical $1,450
-
2026-01-31price $1,450
-
2025-12-17$1,550
-
2025-12-05historical $1,550
-
2025-12-03$1,550
-
2025-10-04historical $1,550
-
2025-09-15historical
-
2025-08-28price $1,550
-
2025-08-25$1,700
-
2025-08-08soldstatus $68,750
-
2025-07-08price $124,999
-
2025-06-18$129,999 Active
-
2025-06-18historical
-
2025-05-30price $139,000
-
2025-05-10$145,000 Active
-
2024-12-06historical
-
2024-08-20$80,000 Active
-
2019-08-13soldstatus $49,900
-
2019-06-13historical
-
2019-06-10$49,900 Active
-
2008-09-02soldstatus $55,000
ⓘ Source: listings_history table (triggers on properties + properties_extension) + one-shot
backfill from property_details.listing_events for pre-trigger history.
Tax reassessment forecast NJ · Partial reset (capped growth)
- Current annual tax
- $2,166 · $180/mo
- Projected year-2 tax
- $2,639 · $220/mo
- Expected delta
- +$473/yr (+$39/mo · 21.9%)
ⓘ Screening estimate from a state-policy table — verify with the county assessor before closing.
Climate risk First Street
- Flood 9/10 Extreme FEMA zone X (shaded) · 99% chance over 30 yrs
- Wildfire 2/10 Low
- Heat 7/10 Severe 7 d/yr ≥103°F today · 15 d/yr by 30 yrs out
- Wind 6/10 Major 27% chance of damaging wind over 30 yrs
- Air quality 3/10 Moderate 2 unhealthy d/yr today · 4 by 30 yrs out
Nearby sold comps map
Loading sold comps map…
Walkable amenities ~0.75 mi
Loading nearby amenities…
Taxation est. · year 1
- Rental income
- $19,109
- − Mortgage interest
- −$7,002
- − Property taxes
- −$2,166
- − Insurance
- −$1,422
- − Repairs & maintenance
- −$1,529
- − Management
- −$1,529
- − Depreciation
- −$3,636
- Taxable income
- $1,825
- Est. tax owed @ 24.0%
- −$438
- After-tax cash flow
- $3,204/yr
For passive investors: Depreciation is non-cash, so a rental often shows a tax loss while cash-flowing — sheltering income. Rental losses are passive: they offset passive income freely, and up to $25,000/yr can offset ordinary (W-2) income if you actively participate and your MAGI is under $100k (phasing out to $0 by $150k); unused losses carry forward. On sale, claimed depreciation is recaptured at up to 25%, and gains may owe capital-gains tax (a 1031 exchange can defer both). Figures are a year-1 estimate at your 24.0% rate — not tax advice; consult a CPA.
Schools (NCES district)
- District
- Salem City School District
- NCES district ID
- 3414550
- Math proficiency
- 6% ▼ -1.00%
- Reading proficiency
- 24% ▲ 2.00%
- Median HH income
- $27,118
- Composite
- 11.51/100
- National rank
- #9702
- State rank
- #464 of 472 in NJ
Livability — Salem
- Score
- 61/100
- State rank
- #462
- US rank
- #17533
Category grades
Schools grade is shown separately in the Schools card above.
Census & demographics
- Census place
- Salem, NJ
- County
- Salem County · 24,175 people
- City population
- 10,762
- Metro
- Philadelphia-Camden-Wilmington, PA-NJ-DE-MD
- Population (ZIP)
- 10,762
- Household income
- $54,641
- Rent vs Own
- Severe rent burden
- 663.0
Population outlook (Salem County) Hauer SSP2
- Today (2025)
- 59,905 people
- By 2030
- 57,351 · -4.3%
- By 2040
- 51,837 · -13.5%
- By 2050
- 46,356 · -22.6%
- By 2075
- 36,452 · -39.2%
- By 2100
- 28,907 · -51.7%
Race, ethnicity, and origin ACS 2023
- Neighborhood character
- Diverse neighborhood (Simpson 0.55)
- Race & ethnicity
- White 59% Black 31% Hispanic / Latino 6% Two or more races 5% Asian 1%
- Hispanic origin (detail)
- Puerto Rican 5%
- Common ancestry
- Romanian 3% Lithuanian 2% Italian 1%
- Foreign-born
- 2% · Canada
- Languages at home
- 94% English-only · Spanish 4% Tagalog/Filipino 1%
Political lean MEDSL · Salem
- 2024 margin
- R (+19.2) · D 39.6% · R 58.8% · Other 1.6%
- 2008→2024 swing
- -23.1pp toward R · 2008: 3.9pp · 2024: -19.2pp
- All cycles
- 2024: R+19.2 2020: R+12.8 2016: R+15.4 2012: D+0.8 2008: D+3.9
Not yet ingested
- Civics
- —
Market trends
- HPI YoY
- ▼ -0.38%
- Current HPI
- 258.0047
- Rent YoY
- —
- Metro
- Philadelphia-Camden-Wilmington, PA-NJ-DE-MD
- State GDP YoY
- ▲ 2.05%
- F500 in state
- 34
Industry mix (Fortune 500 HQ in NJ)
| Industry | F500 HQs | Revenue |
|---|---|---|
| Consumer Goods | 3 | $31B |
|
||
| Pharmaceuticals | 2 | $153B |
|
||
| Technology | 2 | $21B |
|
||
| Insurance | 2 | $20B |
|
||
| Healthcare | 2 | $19B |
|
||
| Financial Services | 1 | $70B |
|
||
Price history
+136.4% since first listed25 events — show timeline
- 2026-05-17 Pending — BRIGHT MLS
- 2026-05-06 Listed $130,000 BRIGHT MLS
- 2026-04-25 Listing Removed — BRIGHT MLS
- 2026-04-24 Listed $235,000 BRIGHT MLS
- 2026-02-02 Rental Removed $1,450 APPFOLIO
- 2026-01-31 Price Changed $1,450 APPFOLIO
- 2025-12-17 Listed for Rent $1,550 APPFOLIO
- 2025-12-05 Rental Removed $1,550 APPFOLIO
- 2025-12-03 Listed for Rent $1,550 APPFOLIO
- 2025-10-04 Rental Removed $1,550 APPFOLIO
- 2025-09-15 Listing Removed — BRIGHT MLS
- 2025-08-28 Price Changed $1,550 APPFOLIO
- 2025-08-25 Listed for Rent $1,700 APPFOLIO
- 2025-08-08 Sold (Public Records) $68,750 Public Records
- 2025-07-08 Price Changed $124,999 BRIGHT MLS
- 2025-06-18 Listing Removed — BRIGHT MLS
- 2025-06-18 Listed $129,999 BRIGHT MLS
- 2025-05-30 Price Changed $139,000 BRIGHT MLS
- 2025-05-10 Listed $145,000 BRIGHT MLS
- 2024-12-06 Listing Removed — BRIGHT MLS
- 2024-08-20 Listed $80,000 BRIGHT MLS
- 2019-08-13 Sold (Public Records) $49,900 Public Records
- 2019-06-13 Listing Removed — BRIGHT MLS
- 2019-06-10 Listed $49,900 BRIGHT MLS
- 2008-09-02 Sold (Public Records) $55,000 Public Records
Property tax history
-0.8%/yrLatest (2025): $2,166 · +4.9% YoY. Source: county tax records.
Cash-flow waterfall
monthlySold comps — $/sqft
last 12 mo · ≤1 miLoading sold comps…