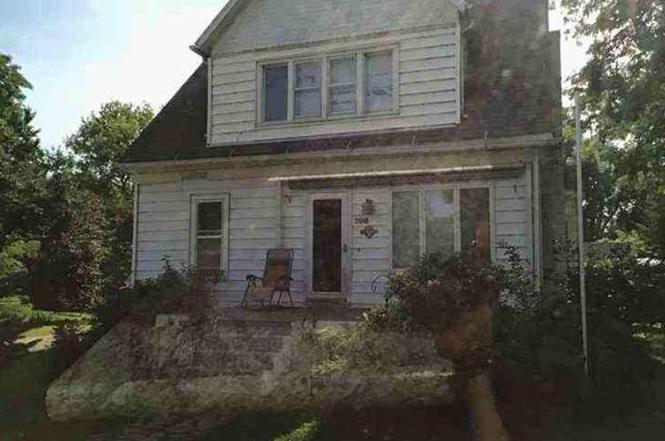
208 N 3rd St St · Wallingford, IA
Flood risk 1/10 · Minimal
- FEMA flood zone
- X
- Chance of flooding over 30 yrs
- 0.0%
- Est. flood insurance / yr
- $508 – $851
Fire risk 2/10 · Minimal
- Est. fire insurance / yr
- $902 – $1,676
Heat risk 2/10 · Minimal
- Hot days now (above threshold)
- 7 days/yr
- Hot days in 30 yrs
- 16 days/yr
Wind risk No data
- Chance of severe wind over 30 yrs
- —
Air-quality risk 2/10 · Minimal
- Unhealthy air days now
- 1 days/yr
- Unhealthy air days in 30 yrs
- 1 days/yr
Risk factors via First Street. Map © Google.
Why this score? — see what drove the B+ grade
The composite is a weighted blend of 9 inputs, each scored 0–100. Each bar is that input's sub-score; the figure is the points it added to the 100-point composite (weight × sub-score).
- Cash flow +30.0/30.0
- 1% rule +10.0/10.0
- DSCR +10.0/10.0
- Appreciation +7.7/10.0
- ARV discount +7.5/15.0
- Schools +5.2/10.0
- Livability +3.3/5.0
- Rent growth +2.5/5.0
- Condition / age +2.5/5.0
$43,900
🖨 Deal sheet 📄 Offer letter ✓ Due diligence
Listing remarks
REO Occupied – NO ACCESS OR VIEWINGS of this property. Please DO NOT DISTURB the occupant. "As is" cash only sale with no contingencies or inspections. Buyer will be responsible for obtaining possession of the property upon closing. Great Opportunity to own this single-family home built in 1889 featuring 4 bedrooms and 1 bathroom. * * * SPECIAL NOTES: (1) This is a CASH ONLY transaction. (2) Seller to pay Taxes, HOA, and Municipal/Utility Liens. (3) Please read the Auction disclaimers carefully before placing a bid or submitting an offer. * * *
Key facts
- 0.37 acre lot
- Garage
- Built 1889
Property features AI
Exterior
- Parking: Detached carport (1 space)
- Utilities: Public water; Public sewer
- Home design: Single-family residential
- Construction: Other construction materials
- Exterior features: Shingle/asphalt roof; Road surface: other; Lot approximately 0.37 acres (132 x 122); Zoned A-R
Interior
- Bathrooms: 1 full bathroom
- Heating & cooling: Central air conditioning; Forced air heating (natural gas)
- Interior features: Basement (unfinished); No fireplace
Neighborhood map
What this means for you Summary
Snapshot
- This is a 4-bed/1.0-bath single-family listed at $44k.
Deal economics
- At list price, monthly cash flow is $650 ($8k/yr) — positive.
- The deal already cash-flows at list — no discount required.
- Meets the 1% rule at list price ($1k rent vs $44k).
- Recommended offer: $39k (12.0% below list) — sets the bar for market timing.
Location & tenants
- Location reads 66/100 on livability (#536 in IA) — a middle-class / working-renter tenant base. Strengths: cost of living A+, housing A+; Watch: health & safety C-, amenities F, commute F.
- Estherville Lincoln Central Community School District (town): math 57% / reading 67% proficiency, ranked #229 of 289 in IA (top 79%) — acceptable for families but not a draw, mixed tenant base, ~2y average lease.
- Zoned schools: Estherville Lincoln Central Middle School (math 57% / reading 61%, grade B, #193 of 246 statewide, top 78%, 312 students, 53% FRL); Estherville Lincoln Central High School (math 57% / reading 78%, grade B, #186 of 336 statewide, top 57%, 384 students, 47% FRL).
- Market conditions: 3 active listings in the ZIP; 11 units permitted in Emmet County in 2024 (0 in 5+ unit buildings).
Forward outlook
- In year one you build about $3k of equity ($304 loan paydown + $2k appreciation (5.4% local appreciation)).
- Emmet County population projected at -23% by 2050 — secular population decline; favor cash flow + early exit over multi-decade hold.
- At projected returns (5.4% appreciation + 3.0% rent growth), your $12k cash investment doubles in ~2 years — after that, you're playing with house money.
Negotiation context
- It's been on market 171 days — a 12% lower offer ($39k) is reasonable based on typical stale-listing flexibility.
Risks & watch-outs
- Watch-outs: built in 1889 — expect roof / HVAC / electrical / plumbing capex.
Questions for the listing agent
- It's been on market 171 days. Have you received any prior offers? Is the seller open to a 12% concession, seller financing, or rate buy-down credit?
- Built in 1889 — when were the roof, HVAC, electrical panel, plumbing, and water heater last replaced?
- Why hasn't it sold? Are there any deal-killer items the seller is aware of (foundation, flood, title, zoning, code violations)?
- Is there a deadline driving the sale (1031 exchange, divorce, estate, relocation)? That informs how much negotiation room exists.
- Schools are D-rated, which usually means shorter tenancies and higher turnover. Who's the typical renter profile here, and what's been the actual vacancy rate?
- What's the average days-on-market for RENTAL listings here right now (not sales)? A rising rental-DOM trend means longer vacancies and softer asking-rent achievability than the comps imply.
- What's the recent tenant-quality profile in this submarket — average credit score on applications, eviction rate, late-payment / NSF rate, and stable-employment percentage? A property-management company in the area should have these aggregated.
- How much new for-sale + rental construction is in the pipeline within 1–3 miles? Heavy new supply typically softens prices + rents 12–24 months out; constrained supply supports both.
Investment metrics
- 1% rule
- 2.78% ✓
- Cap rate
- 24.06%
- Cash-on-cash
- 63.44%
- DSCR
- 3.82
- GRM
- 3.0
CMA / ARV
- ARV (on-the-fly)
- $123,951
- Comps found
- 2
Show comp detail 2 sales within ~0.75 mi
| Address | Dist | Beds/Ba | Sqft | Sold | Price | $/sf | Match |
|---|---|---|---|---|---|---|---|
| 314 St James St | 0.06mi | 4/1.0 | 1,462 (-7%) | 2mo | $115,000 | $79 | 84 |
| 120 N 2nd St | 0.07mi | 5/2.5 (+1) | 1,704 (+9%) | 21mo | $47,500 | $28 | 54 |
Match score weights: distance 35% · size 25% · config 20% · recency 20%. Top-matched comps best support the ARV.
Projected returns pro-forma
5.39% appreciation · 3.0% rent growth · sell at horizon
- IRR
- 70.6%
- Equity multiple
- 5.27×
- Total profit
- $52,520
- Equity at exit
- $25,930
- IRR
- 68.2%
- Equity multiple
- 10.97×
- Total profit
- $122,602
- Equity at exit
- $45,648
Cash invested: $12,292 (down + closing). Projections, not guarantees.
Landlord ↔ Tenant lean methodology
- Overall (STATE)
- 83 Strongly Landlord-Friendly
- State Iowa
- 83 Strongly Landlord-Friendly · R+6
- County
- — inherits STATE
- City
- — inherits STATE
ZIP-level market 51365
- Home prices YoY
- 3.9%
- Active inventory
- 3
- Price-to-rent
- 3.0×
Monthly cashflow live
- Estimated rent
- $1,219 medium interval (Pro) →
- Mortgage (P&I)
- −$230
- Tax from tax record
- −$65 /mo · $780/yr
- Insurance
- −$18
- HOA
- −$0
- Vacancy / Maint / Mgmt
- −$256
- Net cashflow
- $650
Break-even live
UW: 25.0% down · 7.5% · 30yr · 1.5% tax · 5.0% vac · 8.0% maint · 8.0% mgmt
Financing live
Cash to close
- Down payment
- $10,975
- Closing costs
- $1,317
- Reserves months
- —
- Total cash needed
- —
Loan-product check · same deal, 3 products live
Conventional
25% down · 7.5% · 30yr
- Down + closing
- —
- Monthly P&I
- —
- Monthly cashflow
- —
- DSCR
- —
- Eligible?
- —
Personal DTI + credit; lowest rate.
DSCR
20% down · 8.5% · 30yr
- Down + closing
- —
- Monthly P&I
- —
- Monthly cashflow
- —
- DSCR
- —
- Eligible?
- —
No personal income docs; deal must DSCR.
Hard money
10% down · 12.0% · 12mo
- Down + closing
- —
- Monthly P&I
- —
- Monthly cashflow
- —
- DSCR
- —
- Eligible?
- —
Short-term bridge; refi at stabilization.
Listing history 17 events
-
2026-06-18days on market $43,900 Active 171 DOM
-
2026-06-17days on market $43,900 Active 170 DOM
-
2026-06-16days on market $43,900 Active 169 DOM
-
2026-06-15days on market $43,900 Active 168 DOM
-
2026-06-13days on market $43,900 Active 166 DOM
-
2026-06-12days on market $43,900 Active 165 DOM
-
2026-06-09days on market $43,900 Active 162 DOM
-
2026-06-08days on market $43,900 Active 161 DOM
-
2026-06-07days on market $43,900 Active 160 DOM
-
2026-06-05days on market $43,900 Active 158 DOM
-
2026-06-04days on market $43,900 Active 156 DOM
-
2026-06-02days on market $43,900 Active 155 DOM
-
2026-06-01days on market $43,900 Active 154 DOM
-
2026-05-31days on market $43,900 Active 153 DOM
-
2026-05-31days on market $43,900 Active 152 DOM
-
2025-12-29$43,900 Active
-
2012-06-15soldstatus $64,000
ⓘ Source: listings_history table (triggers on properties + properties_extension) + one-shot
backfill from property_details.listing_events for pre-trigger history.
Tax reassessment forecast IA · Partial reset (capped growth)
- Current annual tax
- $780 · $65/mo
- Projected year-2 tax
- $780 · $65/mo
- Expected delta
- $0/yr ($0/mo · 0.0%)
ⓘ Screening estimate from a state-policy table — verify with the county assessor before closing.
Climate risk First Street
- Flood 1/10 Low FEMA zone X · 0% chance over 30 yrs
- Wildfire 2/10 Low
- Heat 2/10 Low
- Air quality 2/10 Low 1 unhealthy d/yr today · 1 by 30 yrs out
Nearby sold comps map
Loading sold comps map…
Walkable amenities ~0.75 mi
Loading nearby amenities…
Taxation est. · year 1
- Rental income
- $14,633
- − Mortgage interest
- −$2,459
- − Property taxes
- −$780
- − Insurance
- −$220
- − Repairs & maintenance
- −$1,171
- − Management
- −$1,171
- − Depreciation
- −$1,277
- Taxable income
- $7,556
- Est. tax owed @ 24.0%
- −$1,813
- After-tax cash flow
- $5,984/yr
For passive investors: Depreciation is non-cash, so a rental often shows a tax loss while cash-flowing — sheltering income. Rental losses are passive: they offset passive income freely, and up to $25,000/yr can offset ordinary (W-2) income if you actively participate and your MAGI is under $100k (phasing out to $0 by $150k); unused losses carry forward. On sale, claimed depreciation is recaptured at up to 25%, and gains may owe capital-gains tax (a 1031 exchange can defer both). Figures are a year-1 estimate at your 24.0% rate — not tax advice; consult a CPA.
Schools (NCES district)
- District
- Estherville Lincoln Central Community School District
- NCES district ID
- 1911070
- Math proficiency
- 57% ▼ -1.00%
- Reading proficiency
- 67% ▲ 5.00%
- Median HH income
- $46,185
- Composite
- 52.33/100
- National rank
- #1588
- State rank
- #229 of 289 in IA
Livability — Wallingford
- Score
- 66/100
- State rank
- #536
- US rank
- #11976
Category grades
Schools grade is shown separately in the Schools card above.
Census & demographics
- Census place
- Wallingford, IA
- Population (ZIP)
- 475
Population outlook (Emmet County) Hauer SSP2
- Today (2025)
- 9,084 people
- By 2030
- 8,626 · -5.0%
- By 2040
- 7,751 · -14.7%
- By 2050
- 6,991 · -23.0%
- By 2075
- 5,854 · -35.6%
- By 2100
- 5,563 · -38.8%
Race, ethnicity, and origin ACS 2023
- Neighborhood character
- Predominantly White (80%)
- Race & ethnicity
- White 80% Hispanic / Latino 10% Black 8% Two or more races 7%
- Hispanic origin (detail)
- Mexican 9% Puerto Rican 1%
- Common ancestry
- Portuguese 16% Iranian 5% Scottish 4%
- Foreign-born
- 3% · Canada
- Languages at home
- 94% English-only · Spanish 5%
Political lean MEDSL · Emmet
- 2024 margin
- Solid R (+44.0) · D 27.5% · R 71.5% · Other 1.0%
- 2008→2024 swing
- -48.0pp toward R · 2008: 3.9pp · 2024: -44.0pp
- All cycles
- 2024: R+44.0 2020: R+36.0 2016: R+37.5 2012: R+8.9 2008: D+3.9
Not yet ingested
- Civics
- —
Market trends
- HPI YoY
- ▲ 5.39%
- Current HPI
- 143.7335
- Rent YoY
- —
- Metro
- —
- State GDP YoY
- ▲ 2.48%
- F500 in state
- 4
Industry mix (Fortune 500 HQ in IA)
| Industry | F500 HQs | Revenue |
|---|---|---|
| Financial Services | 1 | $16B |
|
||
| Retail / Convenience | 1 | $15B |
|
||
Price history
-31.4% since first listed2 events — show timeline
- 2025-12-29 Listed $43,900 NEIRBR as distributed by MLS GRID
- 2012-06-15 Sold (Public Records) $64,000 Public Records
Property tax history
-0.5%/yrLatest (2025): $780 · +8.3% YoY. Source: county tax records.
Cash-flow waterfall
monthlySold comps — $/sqft
last 12 mo · ≤1 miLoading sold comps…