 🌊 Lakefront
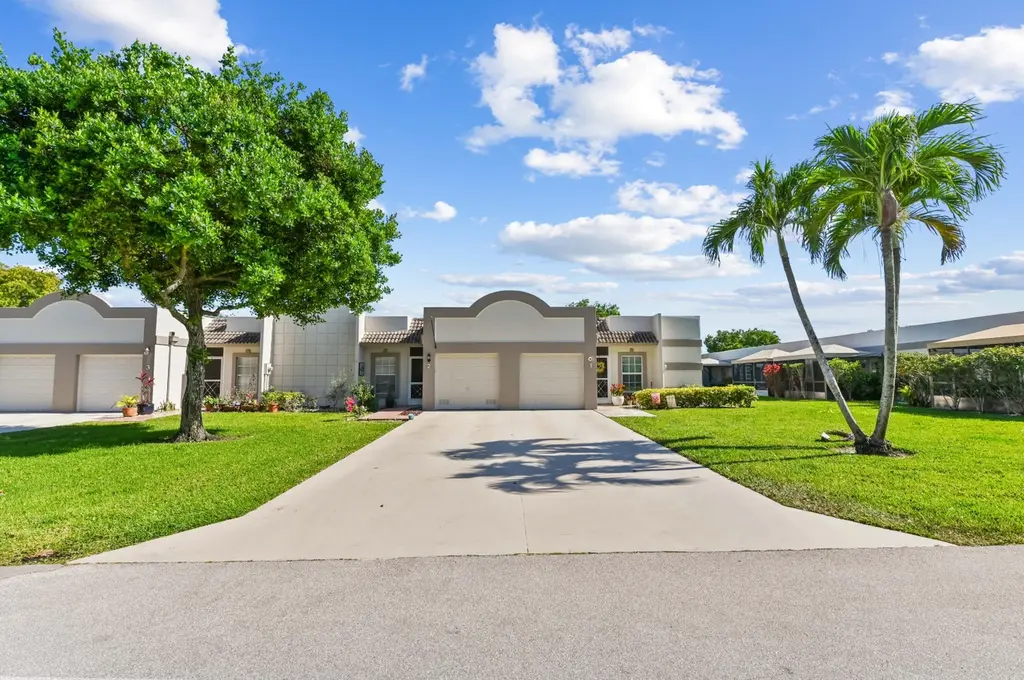
9244 Flynn Cir #2 · Boca Raton, FL
Flood risk 1/10 · Minimal
- FEMA flood zone
- X (unshaded)
- Chance of flooding over 30 yrs
- 0.0%
- Est. flood insurance / yr
- $507 – $1,088
Fire risk 1/10 · Minimal
- Est. fire insurance / yr
- $947 – $1,759
Heat risk 9/10 · Severe
- Hot days now (above 107°F)
- 7 days/yr
- Hot days in 30 yrs
- 26 days/yr
Wind risk 10/10 · Severe
- Chance of severe wind over 30 yrs
- 99.0%
Air-quality risk 2/10 · Minimal
- Unhealthy air days now
- 2 days/yr
- Unhealthy air days in 30 yrs
- 2 days/yr
Risk factors via First Street. Map © Google.
Why this score? — see what drove the D grade
The composite is a weighted blend of 9 inputs, each scored 0–100. Each bar is that input's sub-score; the figure is the points it added to the 100-point composite (weight × sub-score).
- Appreciation +10.0/10.0
- ARV discount +7.5/15.0
- Cash flow +6.5/30.0
- Schools +4.3/10.0
- Livability +3.9/5.0
- Rent growth +3.1/5.0
- Condition / age +2.5/5.0
- 1% rule +2.3/10.0
- DSCR +0.8/10.0
$375,000
🖨 Deal sheet (PDF) 📄 Offer letter ✓ Due diligence
Listing remarks
Beautiful & spacious (1,227 sf) 2/2 villa with serene lakefront & patio at the Town Villas 55+ community, off of Yamato & Lyons Rd. Renovated open kitchen with marble countertops & stone backsplash, slow-close cabinets, double sinks & top-tier stainless steel appliances. Beds boast wood vinyl floors, ensuite bath & walk-in closet in the primary. Ceiling fans in every room, washer & dryer, NEW interior doors & NEWLY updated plumbing system (2023). Enjoy direct lake views from screened porch. Garage has NEW motor + long double driveway for extra parking. Olive & lime trees, as well as tomatoes in the front & back yards. LOW HOA of $3
Key facts
- Lakefront
- Slow-close cabinets
- Marble countertops
Tags
Property features AI
Finance
- Financial info: Pets allowed (may have number/size limits and restrictions)
- HOA & community: Association managed by Campbell Property Management; Monthly HOA fee; Association amenities include clubhouse, heated pool, spa/hot tub, fitness center, billiard and game rooms, tennis and shuffleboard courts, bocce ball, library, recreation facilities, manager on site, maintenance of grounds, sidewalks and street lights, parking and common area maintenance
Exterior
- Parking: Attached 3-car garage; Attached carport with 2 spaces; Covered parking (total 5 covered spaces); Driveway and guest parking; Total 3 parking spaces reported with 2 open parking spaces
- Utilities: Public water; Public sewer; Electric service (three phase); Cable available; Electricity available
- Home design: Villa; One story; Resale property; Property faces north; Private road frontage
- Construction: Block, concrete and stucco construction; Tile roof (also listed as Other)
- Exterior features: Covered patio; Screened patio; Patio; Fruit trees on lot; Waterfront
Interior
- Kitchen: Dishwasher; Electric range; Microwave; Refrigerator; Electric water heater
- Bedrooms: 2 bedrooms on main level
- Flooring: Ceramic tile; Laminate; Tile; Wood
- Bathrooms: 2 full bathrooms on main level
- Heating & cooling: Central heating (electric); Central air conditioning; Ceiling fan(s)
- Interior features: Built-in features; Walk-in closet(s); Split bedroom layout; Closet cabinetry; Blinds on windows
- Laundry & utility: Inside laundry in a laundry closet
Neighborhood map
What this means for you Summary
Snapshot
- This is a 2-bed/2.0-bath single-family listed at $375k.
Deal economics
- At list price, monthly cash flow is $-635 ($-8k/yr) — negative.
- To cash-flow at today's rent, offer at most $263k (29.9% below list).
- To meet the 1% rule (rent ≥ 1% of price), the offer needs to be $275k (26.6% below list).
- Recommended offer: $263k (29.9% below list) — sets the bar for cash-flow.
- Cap rate 4.3% vs local median 2.7% in Boca Raton — top-decile yield for the area; either an underpriced asset or a hidden risk that comps aren't pricing in. Stress-test before assuming the spread holds.
Location & tenants
- Location reads 77/100 on livability (#192 in FL, #3,070 nationally) — a middle-class / working-renter tenant base. Strengths: employment A+, health & safety A+, crime B+; Watch: amenities D, cost of living F.
- Palm Beach (suburban): math 46% / reading 53% proficiency, ranked #34 of 73 in FL (top 47%) — families likely to look elsewhere, expect single-tenant / working-renter base with shorter leases.
- Zoned schools: Whispering Pines Elementary School (math 62% / reading 69%, grade B+, #500 of 2,144 statewide, top 24%, 1,015 students, 25% FRL); Omni Middle School (math 66% / reading 66%, grade A-, #93 of 571 statewide, top 16%, 1,128 students, 29% FRL); Olympic Heights Community High (math 52% / reading 64%, grade C, #120 of 667 statewide, top 18%, 2,602 students, 30% FRL) — zoned schools average 28% FRL vs 52% district-wide (24 pts lower); this property's tenant base skews higher-income than the district average.
- Zoned-school proficiency averages 63% at this address vs 50% district-wide (+14 pts) — the actual schools serving this property are materially stronger than the Palm Beach average implies; a family-tenant draw the district grade alone would hide.
- Market conditions: Rents rising (+2.3%/yr); 332 active listings in the ZIP; 40 comparable units currently listed for rent nearby; rentals at typical pace (median 25d on market — plan ~3-4 weeks tenant-placement turnaround); high-income renter base; 3,974 units permitted in Palm Beach County in 2024 (1,012 in 5+ unit buildings).
Forward outlook
- In year one you build about $40k of equity ($3k loan paydown + $38k appreciation (10.0% local appreciation)).
- Palm Beach County population projected at +30% by 2050 — long-run rental-demand tailwind backs the buy-and-hold thesis.
- By year 2, paydown + projected appreciation supports a ~$64k cash-out refi (75% LTV) — recoverable capital for the next deal without selling this one.
Negotiation context
- It's been on market 54 days — a 3% lower offer ($364k) is reasonable based on typical stale-listing flexibility.
- 8 sale attempts since 3y ago with the ask held roughly flat each time — persistent listings suggest the price (not the market) is what's stuck; bring a comps-based counter.
- Current owner paid $290k; 29% above their basis — modest negotiation headroom, anchor on the comps not their cost.
Risks & watch-outs
- Climate carrying-cost: severe wind risk, 99% chance of damaging wind over 30y; extreme-heat days projected 7→26/yr by 2055 (HVAC capex compounding) — expect insurance premiums to compound above CPI over the hold.
Questions for the listing agent
- What do current leases actually rent for vs. the listed asking? Can we see a recent rent roll and the last 12 months of T-12 income?
- It's been on market 54 days. Have you received any prior offers? Is the seller open to a 30% concession, seller financing, or rate buy-down credit?
- What does the HOA fee cover, when was the last increase, and are there any pending special assessments or reserve-fund shortfalls?
- Is there a deadline driving the sale (1031 exchange, divorce, estate, relocation)? That informs how much negotiation room exists.
- Schools are A-rated — typically a magnet for longer-tenancy family renters. What's the average tenant stay here, and is there a school-zone premium baked into asking?
- The area grade is low — what's the realistic commute time and amenity access for the typical tenant pool here? Any planned neighborhood developments (good or bad) we should know about?
- This sits on a lake — are riparian / water-frontage rights deeded with the parcel? Any dock permits, shoreline easements, or HOA water-use restrictions?
- What's the documented flood / surge / shoreline-erosion history here (FEMA AND non-FEMA — e.g., storm surge, creek backup, septic-field saturation)?
- Any water-quality or seasonal algae-bloom issues that affect tenant satisfaction or short-term-rental demand?
- What's the average days-on-market for RENTAL listings here right now (not sales)? A rising rental-DOM trend means longer vacancies and softer asking-rent achievability than the comps imply.
- What's the recent tenant-quality profile in this submarket — average credit score on applications, eviction rate, late-payment / NSF rate, and stable-employment percentage? A property-management company in the area should have these aggregated.
- How much new for-sale + rental construction is in the pipeline within 1–3 miles? Heavy new supply typically softens prices + rents 12–24 months out; constrained supply supports both.
Investment metrics
- 1% rule
- 0.73% ✗
- Cap rate
- 4.26%
- Cash-on-cash
- -7.26%
- DSCR
- 0.68
- GRM
- 11.3
CMA / ARV
No comps found within radius.
Projected returns pro-forma
10.0% appreciation · 2.31% rent growth · sell at horizon
- IRR
- 19.0%
- Equity multiple
- 2.54×
- Total profit
- $162,052
- Equity at exit
- $337,830
- IRR
- 17.4%
- Equity multiple
- 5.82×
- Total profit
- $505,639
- Equity at exit
- $728,543
Cash invested: $105,000 (down + closing). Projections, not guarantees.
Landlord ↔ Tenant lean methodology
- Overall (STATE)
- 87 Strongly Landlord-Friendly
- State Florida
- 87 Strongly Landlord-Friendly · R+3
- County
- — inherits STATE
- City
- — inherits STATE
ZIP-level market 33496
- Home prices YoY
- 3.5%
- Rents YoY
- 2.3%
- Active inventory
- 332
- Price-to-rent
- 11.3×
Monthly cashflow live
- Estimated rent
- $2,754 high interval (Pro) →
- Mortgage (P&I)
- −$1,967
- Tax from tax record
- −$309 /mo · $3,708/yr
- Insurance
- −$156
- HOA
- −$379
- Lot rent
- −$0
- Vacancy / Maint / Mgmt
- −$578
- Net cashflow
- $-635
Break-even live
Sensitivity live
| Price | -10% $-423 | -5% $-529 | +0% $-635 | +5% $-741 | +10% $-848 |
|---|---|---|---|---|---|
| Rent | -10% $-853 | -5% $-744 | +0% $-635 | +5% $-526 | +10% $-418 |
| Rate | -1.0pp $-446 | -0.5pp $-540 | base $-635 | +0.5pp $-732 | +1.0pp $-831 |
UW: 25.0% down · 7.5% · 30yr · 1.5% tax · 5.0% vac · 8.0% maint · 8.0% mgmt
Financing live
Cash to close
- Down payment
- $93,750
- Closing costs
- $11,250
- Reserves months
- —
- Total cash needed
- —
Loan-product check · same deal, 3 products live
Conventional
25% down · 7.5% · 30yr
- Down + closing
- —
- Monthly P&I
- —
- Monthly cashflow
- —
- DSCR
- —
- Eligible?
- —
Personal DTI + credit; lowest rate.
DSCR
20% down · 8.5% · 30yr
- Down + closing
- —
- Monthly P&I
- —
- Monthly cashflow
- —
- DSCR
- —
- Eligible?
- —
No personal income docs; deal must DSCR.
Hard money
10% down · 12.0% · 12mo
- Down + closing
- —
- Monthly P&I
- —
- Monthly cashflow
- —
- DSCR
- —
- Eligible?
- —
Short-term bridge; refi at stabilization.
Rent comps 40 comps
| Address | Beds | Baths | Sqft | Rent | $/sqft | DOM | Units | Dist |
|---|---|---|---|---|---|---|---|---|
| 18730 Stewart Cir #5 Boca Raton, FL | 2.0 | 2.0 | 1227 | $2,500 | $2.04 | 26d | 1 | 0.05mi |
| 9110 Fairbanks Ln #4 Boca Raton, FL | 2.0 | 2.0 | 1227 | $2,400 | $1.96 | 26d | 1 | 0.26mi |
| 18855 Candlewick Dr Boca Raton, FL | 2.0 | 2.0 | 1022 | $2,600 | $2.54 | 26d | 1 | 0.26mi |
| 18890 Candlewick Dr Unit B Boca Raton, FL | 2.0 | 2.0 | 1044 | $2,600 | $2.49 | 26d | 1 | 0.26mi |
| 18595 Egret Way #18595 Boca Raton, FL | 2.0 | 2.0 | 1000 | $2,200 | $2.20 | 26d | 1 | 0.26mi |
| 18765 Candlewick Dr Boca Raton, FL | 2.0 | 2.0 | 863 | $2,300 | $2.67 | 26d | 1 | 0.27mi |
| 9104 Affirmed Ln Boca Raton, FL | 3.0 | 2.0 | 1266 | $3,215 | $2.54 | 1d | 1 | 0.33mi |
| 9448 Saddlebrook Dr Boca Raton, FL | 3.0 | 2.0 | 1243 | $3,500 | $2.82 | 23d | 1 | 0.41mi |
| 9448 Saddlebrook Dr Unit 9448 Boca Raton, FL | 3.0 | 2.0 | 1243 | $3,500 | $2.82 | 26d | 1 | 0.41mi |
| 9708 Erica Ct Boca Raton, FL | 2.0 | 2.0 | 1410 | $4,800 | $3.40 | 26d | 1 | 0.49mi |
| 4007 Yarmouth a Boca Raton, FL | 2.0 | 2.0 | 1132 | $2,200 | $1.94 | 26d | 1 | 0.57mi |
| 9238 Vineland Ct Unit G Boca Raton, FL | 3.0 | 2.0 | 1318 | $3,100 | $2.35 | 1d | 1 | 0.58mi |
| 8664 Jasmine Way Boca Raton, FL | 2.0 | 2.0 | 1162 | $1,795 | $1.54 | 26d | 1 | 0.60mi |
| 1072 Yarmouth E #1072 Boca Raton, FL | 1.0 | 1.5 | 738 | $1,950 | $2.64 | 26d | 1 | 0.60mi |
| 8705 Via Giula #4 Boca Raton, FL | 3.0 | 2.0 | 1477 | $3,400 | $2.30 | 17d | 1 | 0.61mi |
| 8705 Via Giula #4 Boca Raton, FL | 3.0 | 2.0 | 1477 | $3,500 | $2.37 | 26d | 1 | 0.61mi |
| 68 Suffolk F Unit 68 Boca Raton, FL | 1.0 | 1.5 | 720 | $2,750 | $3.82 | 26d | 1 | 0.61mi |
| 209 Suffolk F Unit F Boca Raton, FL | 1.0 | 1.5 | 720 | $1,400 | $1.94 | 26d | 1 | 0.61mi |
| 169 Suffolk F Unit F Boca Raton, FL | 2.0 | 1.5 | 840 | $1,750 | $2.08 | 1d | 1 | 0.61mi |
| 250 Suffolk F #250 Boca Raton, FL | 1.0 | 1.5 | 720 | $1,450 | $2.01 | 5d | 1 | 0.61mi |
| 171 Suffolk F #171 Boca Raton, FL | 1.0 | 1.5 | 720 | $1,500 | $2.08 | 13d | 1 | 0.61mi |
| 4067 Yarmouth D Boca Raton, FL | 1.0 | 1.5 | 738 | $1,650 | $2.24 | 5d | 1 | 0.62mi |
| 3057 Yarmouth C Boca Raton, FL | 2.0 | 2.0 | 916 | $2,450 | $2.67 | 1d | 1 | 0.65mi |
| 9785 Ridgecreek Rd Boca Raton, FL | 2.0 | 2.0 | 1172 | $3,450 | $2.94 | 7d | 1 | 0.66mi |
| 9785 Ridgecreek Rd Boca Raton, FL | 3.0 | 2.0 | 1172 | $3,600 | $3.07 | 21d | 1 | 0.66mi |
| 9841 Ridgecreek Rd Boca Raton, FL | 3.0 | 2.0 | 1435 | $4,500 | $3.14 | 26d | 1 | 0.66mi |
| 9850 Ridgecreek Rd Boca Raton, FL | 3.0 | 2.0 | 1364 | $3,600 | $2.64 | 26d | 1 | 0.68mi |
| 9713 Boca Gardens Pkwy Unit D Boca Raton, FL | 3.0 | 3.5 | 1325 | $3,995 | $3.02 | 17d | 1 | 0.70mi |
| 3049 Wolverton E Unit 3049 Boca Raton, FL | 2.0 | 2.0 | 896 | $2,200 | $2.46 | 10d | 1 | 0.74mi |
| 18813 Cloud Lake Cir Boca Raton, FL | 3.0 | 2.0 | 1132 | $3,500 | $3.09 | 7d | 1 | 0.74mi |
| 18813 Cloud Lake Cir Boca Raton, FL | 3.0 | 2.0 | 1132 | $3,400 | $3.00 | 6d | 1 | 0.74mi |
| 4049 Wolverton C Unit C Boca Raton, FL | 2.0 | 2.0 | 896 | $2,500 | $2.79 | 4d | 1 | 0.76mi |
| 18917 Cloud Lake Cir Boca Raton, FL | 3.0 | 2.0 | 1132 | $3,350 | $2.96 | 26d | 1 | 0.76mi |
| 149 Preston Way #149 Boca Raton, FL | 1.0 | 1.5 | 720 | $1,300 | $1.81 | 4d | 1 | 0.79mi |
| 74 Preston Way Boca Raton, FL | 2.0 | 1.5 | 840 | $1,750 | $2.08 | 24d | 1 | 0.79mi |
| 204 Preston Way #204 Boca Raton, FL | 1.0 | 1.0 | 810 | $1,500 | $1.85 | 3d | 1 | 0.79mi |
| 74 Preston Way Boca Raton, FL | 2.0 | 1.5 | 840 | $1,750 | $2.08 | 26d | 1 | 0.79mi |
| 149 Preston Way #149 Boca Raton, FL | 1.0 | 1.5 | 720 | $1,350 | $1.88 | 26d | 1 | 0.79mi |
| 3049 Wolverton C #3049 Boca Raton, FL | 2.0 | 2.0 | 896 | $2,200 | $2.46 | 10d | 1 | 0.81mi |
| 4030 Rexford A Unit 403 Boca Raton, FL | 2.0 | 2.0 | 896 | $1,700 | $1.90 | 10d | 1 | 0.86mi |
HOA detail
- Monthly dues
- $379 · $4,548/yr
Listing history 44 events
-
2026-06-22days on market $375,000 Active 54 DOM
-
2026-06-21days on market $375,000 Active 53 DOM
-
2026-06-18days on market $375,000 Active 50 DOM
-
2026-06-17days on market $375,000 Active 49 DOM
-
2026-06-16days on market $375,000 Active 48 DOM
-
2026-06-15days on market $375,000 Active 47 DOM
-
2026-06-13days on market $375,000 Active 45 DOM
-
2026-06-09days on market $375,000 Active 41 DOM
-
2026-06-08days on market $375,000 Active 40 DOM
-
2026-06-07days on market $375,000 Active 39 DOM
-
2026-06-04days on market $375,000 Active 36 DOM
-
2026-06-03days on market $375,000 Active 35 DOM
-
2026-06-02days on market $375,000 Active 34 DOM
-
2026-06-01days on market $375,000 Active 33 DOM
-
2026-05-31days on market $375,000 Active 32 DOM
-
2026-04-29$375,000 Active
-
2026-04-16historical
-
2026-01-26price $375,000
-
2025-10-16$359,500 Active
-
2025-09-26historical
-
2025-08-25price $367,000
-
2025-07-11$375,000 Active
-
2025-06-18historical
-
2025-05-27historical $2,750
-
2025-05-26price $363,999
-
2025-04-29price $2,750
-
2025-04-28price $366,999
-
2025-03-10price $369,999
-
2025-02-25$375,000 Active
-
2025-02-05price $2,800
-
2024-12-24$2,950
-
2024-12-02historical
-
2024-11-18price $359,999
-
2024-10-01price $364,999
-
2024-08-09$369,900 Active
-
2024-08-02historical
-
2024-07-16price $369,900
-
2024-05-31price $375,000
-
2024-04-17$379,999 Active
-
2024-04-17historical
-
2023-06-06soldstatus $290,000
-
2023-05-31soldstatus $290,000 Closed
-
2023-04-24status Pending
-
2023-04-20$330,000 Active
ⓘ Source: listings_history table (triggers on properties + properties_extension) + one-shot
backfill from property_details.listing_events for pre-trigger history.
Tax reassessment forecast FL · Resets to sale price
- Current annual tax
- $3,708 · $309/mo
- Projected year-2 tax
- $3,708 · $309/mo
- Expected delta
- $0/yr ($0/mo · 0.0%)
ⓘ Screening estimate from a state-policy table — verify with the county assessor before closing.
Climate risk First Street
- Flood 1/10 Low FEMA zone X (unshaded) · 0% chance over 30 yrs
- Wildfire 1/10 Low
- Heat 9/10 Extreme 7 d/yr ≥107°F today · 26 d/yr by 30 yrs out
- Wind 10/10 Extreme 99% chance of damaging wind over 30 yrs
- Air quality 2/10 Low 2 unhealthy d/yr today · 2 by 30 yrs out
Nearby sold comps map
Loading sold comps map…
Walkable amenities ~0.75 mi
Loading nearby amenities…
Taxation est. · year 1
- Rental income
- $33,046
- − Mortgage interest
- −$21,006
- − Property taxes
- −$3,708
- − Insurance
- −$1,875
- − Repairs & maintenance
- −$2,644
- − Management
- −$2,644
- − HOA
- −$4,548
- − Depreciation
- −$10,909
- Taxable loss
- −$14,287
- Est. tax savings @ 24.0%
- +$3,429
- After-tax cash flow
- $-4,194/yr
For passive investors: Depreciation is non-cash, so a rental often shows a tax loss while cash-flowing — sheltering income. Rental losses are passive: they offset passive income freely, and up to $25,000/yr can offset ordinary (W-2) income if you actively participate and your MAGI is under $100k (phasing out to $0 by $150k); unused losses carry forward. On sale, claimed depreciation is recaptured at up to 25%, and gains may owe capital-gains tax (a 1031 exchange can defer both). Figures are a year-1 estimate at your 24.0% rate — not tax advice; consult a CPA.
Schools (NCES district)
- District
- Palm Beach
- NCES district ID
- 1201500
- Math proficiency
- 46% ▼ -16.00%
- Reading proficiency
- 53% ▼ -4.00%
- Median HH income
- $53,943
- Composite
- 42.72/100
- National rank
- #3160
- State rank
- #34 of 73 in FL
Livability — Boca Raton
- Score
- 77/100
- State rank
- #192
- US rank
- #3070
Category grades
Schools grade is shown separately in the Schools card above.
Census & demographics
- County
- Palm Beach County · 1,438,312 people
- City population
- 250,102
- Metro
- Miami-Fort Lauderdale-Pompano Beach, FL
- Population (ZIP)
- 26,579
- Household income
- $114,885
- Rent vs Own
- Severe rent burden
- 464.0
Population outlook (Palm Beach County) Hauer SSP2
- Today (2025)
- 1,637,487 people
- By 2030
- 1,743,255 · +6.5%
- By 2040
- 1,948,712 · +19.0%
- By 2050
- 2,132,979 · +30.3%
- By 2075
- 2,530,027 · +54.5%
- By 2100
- 2,706,979 · +65.3%
Race, ethnicity, and origin ACS 2023
- Neighborhood character
- Predominantly White (79%)
- Race & ethnicity
- White 79% Hispanic / Latino 11% Two or more races 8% Asian 5% Black 2%
- Hispanic origin (detail)
- Puerto Rican 3%
- Common ancestry
- Scotch-Irish 13% Romanian 9% Italian 3%
- Foreign-born
- 24% · Canada, Jamaica, Dominican Republic
- Languages at home
- 75% English-only · Spanish 9% Other Indo-European 5% Russian/Polish/Slavic 4%
Political lean MEDSL · Palm Beach
- 2024 margin
- Toss-up / Even · D 50.0% · R 49.2%
- 2008→2024 swing
- -22.1pp toward R · 2008: 22.9pp · 2024: 0.8pp
- All cycles
- 2024: D+0.8 2020: D+12.8 2016: D+15.3 2012: D+17.0 2008: D+22.9
Not yet ingested
- Civics
- —
Market trends
- HPI YoY
- ▲ 10.48%
- Current HPI
- 313.9058
- Rent YoY
- ▲ 2.31%
- Metro
- Miami-Fort Lauderdale-Pompano Beach, FL
- State GDP YoY
- ▲ 3.28%
- F500 in state
- 36
Industry mix (Fortune 500 HQ in FL)
| Industry | F500 HQs | Revenue |
|---|---|---|
| Industrial Technology | 2 | $29B |
|
||
| Insurance | 2 | $17B |
|
||
| Retail | 1 | $60B |
|
||
| Technology Distribution | 1 | $58B |
|
||
| Homebuilding | 1 | $35B |
|
||
| Technology Manufacturing | 1 | $35B |
|
||
Price history
+13.6% since first listed29 events — show timeline
- 2026-04-29 Listed $375,000 Beaches MLS
- 2026-04-16 Listing Removed — Beaches MLS
- 2026-01-26 Price Changed $375,000 Beaches MLS
- 2025-10-16 Listed $359,500 Beaches MLS
- 2025-09-26 Listing Removed — Beaches MLS
- 2025-08-25 Price Changed $367,000 Beaches MLS
- 2025-07-11 Listed $375,000 Beaches MLS
- 2025-06-18 Listing Removed — Beaches MLS
- 2025-05-27 Rental Removed $2,750 GFLMLS
- 2025-05-26 Price Changed $363,999 Beaches MLS
- 2025-04-29 Price Changed $2,750 GFLMLS
- 2025-04-28 Price Changed $366,999 Beaches MLS
- 2025-03-10 Price Changed $369,999 Beaches MLS
- 2025-02-25 Listed $375,000 Beaches MLS
- 2025-02-05 Price Changed $2,800 GFLMLS
- 2024-12-24 Listed for Rent $2,950 GFLMLS
- 2024-12-02 Listing Removed — Beaches MLS
- 2024-11-18 Price Changed $359,999 Beaches MLS
- 2024-10-01 Price Changed $364,999 Beaches MLS
- 2024-08-09 Listed $369,900 Beaches MLS
- 2024-08-02 Listing Removed — Beaches MLS
- 2024-07-16 Price Changed $369,900 Beaches MLS
- 2024-05-31 Price Changed $375,000 Beaches MLS
- 2024-04-17 Listed $379,999 Beaches MLS
- 2024-04-17 Coming Soon — Beaches MLS
- 2023-06-06 Sold (Public Records) $290,000 Public Records
- 2023-05-31 Sold (MLS) $290,000 Beaches MLS
- 2023-04-24 Pending — Beaches MLS
- 2023-04-20 Listed $330,000 Beaches MLS
Property tax history
+10.3%/yrLatest (2025): $3,708 · -15.0% YoY. Source: county tax records.
Cash-flow waterfall
monthlySold comps — $/sqft
last 12 mo · ≤1 miLoading sold comps…