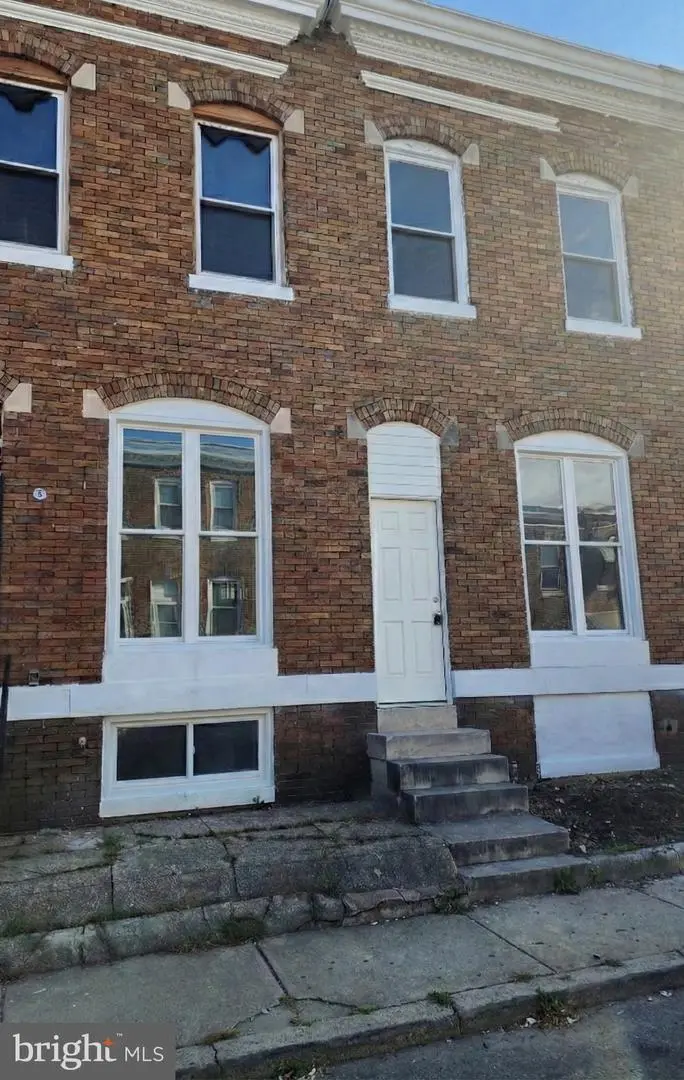
39 N Gorman Ave · Baltimore, MD
Flood risk 1/10 · Minimal
- FEMA flood zone
- X (unshaded)
- Chance of flooding over 30 yrs
- 0.0%
- Est. flood insurance / yr
- $473 – $860
Fire risk 1/10 · Minimal
- Est. fire insurance / yr
- $755 – $1,403
Heat risk 8/10 · Major
- Hot days now (above 103°F)
- 7 days/yr
- Hot days in 30 yrs
- 15 days/yr
Wind risk 6/10 · Moderate
- Chance of severe wind over 30 yrs
- 27.0%
Air-quality risk 3/10 · Minor
- Unhealthy air days now
- 3 days/yr
- Unhealthy air days in 30 yrs
- 4 days/yr
Risk factors via First Street. Map © Google.
Why this score? — see what drove the B grade
The composite is a weighted blend of 9 inputs, each scored 0–100. Each bar is that input's sub-score; the figure is the points it added to the 100-point composite (weight × sub-score).
- Cash flow +30.0/30.0
- ARV discount +12.9/15.0
- DSCR +10.0/10.0
- 1% rule +9.1/10.0
- Rent growth +4.4/5.0
- Livability +3.8/5.0
- Condition / age +2.5/5.0
- Schools +1.0/10.0
- Appreciation +0.0/10.0
$134,500
🖨 Deal sheet 📄 Offer letter ✓ Due diligence
Listing remarks MLS
Nestled in the charming Lexington neighborhood, this exquisite AirLite townhouse offers a perfect blend of comfort and sophistication. With three spacious bedrooms and a beautifully appointed full bathroom, this home is designed for both relaxation and entertaining. The classic brick exterior exudes timeless elegance, while the inviting interior beckons you to unwind. Step inside to discover a thoughtfully laid-out floor plan that maximizes space and natural light. The potential for customization is limitless, allowing you to tailor the space to your unique lifestyle. Enjoy the convenience of on-street parking, making it easy for guests to visit. The surrounding community is rich with amenities, offering a vibrant lifestyle just moments from your doorstep. Explore local parks, boutique shops, and delightful dining options that make this neighborhood truly special. This property is not just a house; it's a place to create lasting memories. Experience the warmth of home in a setting that combines modern living with classic charm. Don't miss the opportunity to make this enchanting townhouse your own and embrace the exclusive lifestyle it offers.
Key facts
- On-street parking
- Airlite townhouse
- Built 1920
Tags
Neighborhood map
What this means for you Summary
Snapshot
- This is a 3-bed/1.0-bath townhouse listed at $134k.
Deal economics
- At list price, monthly cash flow is $709 ($9k/yr) — positive.
- The deal already cash-flows at list — no discount required.
- Meets the 1% rule at list price ($2k rent vs $134k).
- Recommended offer: $118k (12.0% below list) — sets the bar for market timing.
- Cap rate 12.6% vs local median 6.0% in Baltimore — top-decile yield for the area; either an underpriced asset or a hidden risk that comps aren't pricing in. Stress-test before assuming the spread holds.
Location & tenants
- Location reads 76/100 on livability (#90 in MD, #3,396 nationally) — a middle-class / working-renter tenant base. Strengths: amenities A+, commute A+, housing A+; Watch: schools D, crime F.
- Baltimore City Public Schools (urban): math 7% / reading 16% proficiency, ranked #24 of 24 in MD (top 100%) — low school quality limits family demand, transient renter base, plan for 1-2y turnover; 79% free/reduced lunch — lower-income household profile, screen leases tightly.
- Market conditions: Rents rising fast (+7.5%/yr); 422 active listings in the ZIP; 40 comparable units currently listed for rent nearby; rentals at typical pace (median 24d on market — plan ~3-4 weeks tenant-placement turnaround); 1,273 units permitted in Baltimore city in 2024 (1,104 in 5+ unit buildings).
- At $1,891/mo this rent would consume 49% of the median local household income ($46k/yr) (locally 1755% of renters already pay >50% of income on rent) — very limited rent-growth headroom before tenants either downsize or default.
Forward outlook
- Local home prices are declining (-3.0%/yr); year-one equity from $930 of loan paydown is wiped out by about $4k of value loss. Plan a longer hold.
- Baltimore County population projected to shrink 4% by 2050 — rents likely to lag national; underwrite the cash flow, not the appreciation.
- At projected returns (-3.0% appreciation + 7.5% rent growth), your $38k cash investment doubles in ~5 years — after that, you're playing with house money.
Negotiation context
- It's been on market 141 days — a 12% lower offer ($118k) is reasonable based on typical stale-listing flexibility.
- 2 sale attempts since 3y ago with the ask held roughly flat each time — persistent listings suggest the price (not the market) is what's stuck; bring a comps-based counter.
- Current owner paid $54k; list at $134k implies a 149% gain — meaningful room to come down on a strong offer.
Risks & watch-outs
- Watch-outs: built in 1920 — expect roof / HVAC / electrical / plumbing capex.
- Climate carrying-cost: major wind risk, 27% chance of damaging wind over 30y; extreme-heat days projected 7→15/yr by 2055 (HVAC capex compounding) — expect insurance premiums to compound above CPI over the hold.
Questions for the listing agent
- It's been on market 141 days. Have you received any prior offers? Is the seller open to a 12% concession, seller financing, or rate buy-down credit?
- Built in 1920 — when were the roof, HVAC, electrical panel, plumbing, and water heater last replaced?
- Why hasn't it sold? Are there any deal-killer items the seller is aware of (foundation, flood, title, zoning, code violations)?
- Is there a deadline driving the sale (1031 exchange, divorce, estate, relocation)? That informs how much negotiation room exists.
- Schools are D-rated, which usually means shorter tenancies and higher turnover. Who's the typical renter profile here, and what's been the actual vacancy rate?
- Crime grade is F in this area — have there been break-ins, vandalism, or insurance claims at this property in the last 3 years? What carrier currently insures it and at what premium?
- What's the average days-on-market for RENTAL listings here right now (not sales)? A rising rental-DOM trend means longer vacancies and softer asking-rent achievability than the comps imply.
- What's the recent tenant-quality profile in this submarket — average credit score on applications, eviction rate, late-payment / NSF rate, and stable-employment percentage? A property-management company in the area should have these aggregated.
- How much new for-sale + rental construction is in the pipeline within 1–3 miles? Heavy new supply typically softens prices + rents 12–24 months out; constrained supply supports both.
Investment metrics
- 1% rule
- 1.41% ✓
- Cap rate
- 12.62%
- Cash-on-cash
- 22.58%
- DSCR
- 2.00
- GRM
- 5.9
CMA / ARV
- ARV (median comp)
- $152,817
- List price
- $134,500
- Delta
- -11.99%
- Verdict
- UNDERPRICED
- Comps
- 20 within 1.0 mi
Show comp detail 12 sales within ~0.75 mi
| Address | Dist | Beds/Ba | Sqft | Sold | Price | $/sf | Match |
|---|---|---|---|---|---|---|---|
| 8 N Pulaski St | 0.17mi | 3/3.0 | 2,230 (+1%) | 1mo | $114,000 | $51 | 81 |
| 10 N Pulaski St | 0.17mi | 4/1.5 (+1) | 2,232 (+2%) | 3mo | $92,500 | $41 | 80 |
| 41 N Gorman Ave | 0.00mi | 2/3.0 (-1) | 2,100 (-4%) | 9mo | $205,000 | $98 | 72 |
| 1706 Lemmon St | 0.54mi | 3/1.0 | 2,200 (0%) | 4mo | $38,500 | $18 | 71 |
| 206 S Gilmor St | 0.65mi | 4/2.5 (+1) | 2,200 (0%) | 3mo | $215,000 | $98 | 56 |
| 1810 Edmondson Ave | 0.58mi | 4/2.0 (+1) | 2,290 (+4%) | 8mo | $55,000 | $24 | 50 |
| 105 N Fulton Ave | 0.46mi | 4/2.0 (+1) | 2,000 (-9%) | 6mo | $50,000 | $25 | 50 |
| 329 N Gilmor St | 0.65mi | 4/2.5 (+1) | 2,066 (-6%) | 6mo | $315,000 | $152 | 43 |
| 1709 Hollins St | 0.52mi | 3/3.5 | 2,436 (+11%) | 9mo | $230,000 | $94 | 40 |
| 2537 Calverton Heights Ave | 0.63mi | 3/3.0 | 1,924 (-12%) | 6mo | $235,000 | $122 | 37 |
| 2318 W Lanvale St | 0.57mi | 4/2.5 (+1) | 1,884 (-14%) | 2mo | $180,000 | $96 | 36 |
| 854 Whitmore Ave | 0.66mi | 4/3.5 (+1) | 1,920 (-13%) | 4mo | $245,000 | $128 | 30 |
Match score weights: distance 35% · size 25% · config 20% · recency 20%. Top-matched comps best support the ARV.
Projected returns pro-forma
-3.0% appreciation · 7.51% rent growth · sell at horizon
- IRR
- 20.0%
- Equity multiple
- 1.86×
- Total profit
- $32,251
- Equity at exit
- $20,054
- IRR
- 30.9%
- Equity multiple
- 4.36×
- Total profit
- $126,366
- Equity at exit
- $11,629
Cash invested: $37,660 (down + closing). Projections, not guarantees.
Landlord ↔ Tenant lean methodology
- Overall (CITY)
- 12 Strongly Tenant-Friendly
- State Maryland
- 27 Tenant-Leaning · D+14
- County
- — inherits STATE
- City Baltimore
- 12 Strongly Tenant-Friendly · D+58
ZIP-level market 21223
- Rents YoY
- 7.5%
- Active inventory
- 422
- Price-to-rent
- 5.9×
Monthly cashflow live
- Estimated rent
- $1,891 high interval (Pro) →
- Mortgage (P&I)
- −$705
- Tax from tax record
- −$24 /mo · $285/yr
- Insurance
- −$56
- HOA
- −$0
- Vacancy / Maint / Mgmt
- −$397
- Net cashflow
- $709
Break-even live
UW: 25.0% down · 7.5% · 30yr · 1.5% tax · 5.0% vac · 8.0% maint · 8.0% mgmt
Financing live
Cash to close
- Down payment
- $33,625
- Closing costs
- $4,035
- Reserves months
- —
- Total cash needed
- —
Loan-product check · same deal, 3 products live
Conventional
25% down · 7.5% · 30yr
- Down + closing
- —
- Monthly P&I
- —
- Monthly cashflow
- —
- DSCR
- —
- Eligible?
- —
Personal DTI + credit; lowest rate.
DSCR
20% down · 8.5% · 30yr
- Down + closing
- —
- Monthly P&I
- —
- Monthly cashflow
- —
- DSCR
- —
- Eligible?
- —
No personal income docs; deal must DSCR.
Hard money
10% down · 12.0% · 12mo
- Down + closing
- —
- Monthly P&I
- —
- Monthly cashflow
- —
- DSCR
- —
- Eligible?
- —
Short-term bridge; refi at stabilization.
Rent comps 40 comps
| Address | Beds | Baths | Sqft | Rent | $/sqft | DOM | Units | Dist |
|---|---|---|---|---|---|---|---|---|
| 39 N Bentalou St Baltimore, MD | 3.0 | 2.5 | 1844 | $1,700 | $0.92 | 2d | 1 | 0.02mi |
| 1839 W Fayette St Baltimore, MD | 3.0 | 1.5 | 1426 | $1,675 | $1.17 | 23d | 1 | 0.35mi |
| 307 S Smallwood St Baltimore, MD | 2.0 | 2.5 | 1400 | $1,350 | $0.96 | 43d | 1 | 0.37mi |
| 1814 Penrose Ave Baltimore, MD | 3.0 | 1.0 | 1624 | $1,700 | $1.05 | 17d | 1 | 0.40mi |
| 1725 Hollins St #3 Baltimore, MD | 2.0 | 1.0 | 2796 | $1,195 | $0.43 | 43d | 1 | 0.47mi |
| 1725 Hollins St Unit 4 Baltimore, MD | 2.0 | 1.0 | 2796 | $1,195 | $0.43 | 44d | 1 | 0.47mi |
| 476 S Bentalou St Baltimore, MD | 2.0 | 1.5 | 1630 | $1,300 | $0.80 | 43d | 1 | 0.51mi |
| 1518 1/2 W Lexington St Baltimore, MD | 2.0 | 2.0 | 1650 | $1,200 | $0.73 | 4d | 1 | 0.62mi |
| 1625 Edmondson Ave Unit 1 Baltimore, MD | 4.0 | 3.0 | 1500 | $2,175 | $1.45 | 4d | 1 | 0.66mi |
| 1625 Edmondson Ave Unit 2 Baltimore, MD | 4.0 | 3.0 | 1500 | $1,895 | $1.26 | 12d | 1 | 0.66mi |
| 918 N Bentalou St Baltimore, MD | 3.0 | 1.5 | 1485 | $1,750 | $1.18 | 43d | 1 | 0.70mi |
| 1509 Edmondson Ave #1 Baltimore, MD | 3.0 | 2.0 | 1600 | $2,275 | $1.42 | 23d | 1 | 0.74mi |
| 1328 W Lombard St Baltimore, MD | 3.0 | 3.5 | 2312 | $3,600 | $1.56 | 12d | 1 | 0.77mi |
| 2922 Edmondson Ave Baltimore, MD | 3.0 | 2.0 | 1620 | $1,900 | $1.17 | 43d | 1 | 0.78mi |
| 941 Brunswick St Baltimore, MD | 3.0 | 1.5 | 1516 | $1,650 | $1.09 | 17d | 1 | 0.88mi |
| 941 Brunswick St Baltimore, MD | 3.0 | 1.5 | 1558 | $1,600 | $1.03 | 43d | 1 | 0.88mi |
| 2744 W Mosher St Baltimore, MD | 4.0 | 2.0 | 1412 | $2,100 | $1.49 | 23d | 1 | 0.90mi |
| 1138 W Lombard St Baltimore, MD | 3.0 | 3.5 | 2400 | $1,795 | $0.75 | 23d | 1 | 0.91mi |
| 1115 W Lombard St Baltimore, MD | 3.0 | 1.0 | 1468 | $2,100 | $1.43 | 43d | 1 | 0.94mi |
| 1613 Riggs Ave Baltimore, MD | 3.0 | 2.5 | 1800 | $1,800 | $1.00 | 23d | 1 | 0.96mi |
| 2806 Riggs Ave Baltimore, MD | 3.0 | 2.5 | 1412 | $1,900 | $1.35 | 3d | 1 | 0.98mi |
| 1000 Hollins St Unit 1000 Hollins Baltimore, MD | 3.0 | 2.5 | 1472 | $2,600 | $1.77 | 44d | 1 | 1.03mi |
| 1032 W Franklin St Baltimore, MD | 4.0 | 4.5 | 1913 | $2,650 | $1.39 | 23d | 1 | 1.03mi |
| 1101 S Carey St Baltimore, MD | 2.0 | 2.0 | 1400 | $1,200 | $0.86 | 21d | 1 | 1.05mi |
| 101 N Schroeder St Baltimore, MD | 3.0 | 1.0–2.0 | 1037 | $3,185 | $3.07 | 2d | 12 | 1.05mi |
| 922 W Lombard St Baltimore, MD | 4.0 | 2.0 | 2364 | $2,300 | $0.97 | 23d | 1 | 1.10mi |
| 913 W Lombard St Baltimore, MD | 3.0 | 1.0 | 1452 | $1,600 | $1.10 | 23d | 1 | 1.10mi |
| 110 S Poppleton St Baltimore, MD | 3.0 | 1.5 | 1800 | $1,900 | $1.06 | 43d | 1 | 1.13mi |
| 1227 Washington Blvd Baltimore, MD | 4.0 | 3.5 | 2664 | $2,950 | $1.11 | 4d | 1 | 1.14mi |
| 1501 N Payson St Baltimore, MD | 3.0 | 1.0 | 1400 | $1,550 | $1.11 | 43d | 1 | 1.14mi |
| 3324 Edmondson Ave Baltimore, MD | 3.0 | 2.5 | 2300 | $1,995 | $0.87 | 21d | 1 | 1.17mi |
| 1012 W Lanvale St Baltimore, MD | 2.0 | 2.0 | 2008 | $1,925 | $0.96 | 23d | 1 | 1.17mi |
| 405 N Edgewood St Baltimore, MD | 4.0 | 2.0 | 1408 | $2,950 | $2.10 | 4d | 1 | 1.21mi |
| 3423 Edmondson Ave Baltimore, MD | 2.0 | 1.5 | 1400 | $1,710 | $1.22 | 43d | 1 | 1.22mi |
| 1402 Poplar Grove St Baltimore, MD | 4.0 | 1.5 | 1540 | $800 | $0.52 | 43d | 1 | 1.22mi |
| 1226 W Cross St Baltimore, MD | 3.0 | 3.0 | 1551 | $2,250 | $1.45 | 43d | 1 | 1.23mi |
| 2800 Presstman St Baltimore, MD | 3.0 | 2.5 | 1460 | $1,799 | $1.23 | 23d | 1 | 1.24mi |
| 202 N Edgewood St Baltimore, MD | 3.0 | 2.0 | 1710 | $2,250 | $1.32 | 23d | 1 | 1.24mi |
| 1516 N Mount St Baltimore, MD | 3.0 | 1.5 | 1830 | $1,750 | $0.96 | 14d | 1 | 1.25mi |
| 853 W Lombard St Baltimore, MD | 3.0 | 2.5 | 2824 | $2,650 | $0.94 | 23d | 1 | 1.26mi |
Listing history 18 events
-
2026-06-18days on market $134,500 Active 141 DOM
-
2026-06-17days on market $134,500 Active 140 DOM
-
2026-06-16days on market $134,500 Active 139 DOM
-
2026-06-15days on market $134,500 Active 138 DOM
-
2026-06-13days on market $134,500 Active 136 DOM
-
2026-06-09days on market $134,500 Active 132 DOM
-
2026-06-08days on market $134,500 Active 131 DOM
-
2026-06-07days on market $134,500 Active 130 DOM
-
2026-06-04days on market $134,500 Active 127 DOM
-
2026-06-03days on market $134,500 Active 126 DOM
-
2026-06-02days on market $134,500 Active 125 DOM
-
2026-06-01days on market $134,500 Active 124 DOM
-
2026-05-31days on market $134,500 Active 123 DOM
-
2026-01-28$134,500 Active 1160-char remark
Show marketing remark (1160 chars)
Nestled in the charming Lexington neighborhood, this exquisite AirLite townhouse offers a perfect blend of comfort and sophistication. With three spacious bedrooms and a beautifully appointed full bathroom, this home is designed for both relaxation and entertaining. The classic brick exterior exudes timeless elegance, while the inviting interior beckons you to unwind. Step inside to discover a thoughtfully laid-out floor plan that maximizes space and natural light. The potential for customization is limitless, allowing you to tailor the space to your unique lifestyle. Enjoy the convenience of on-street parking, making it easy for guests to visit. The surrounding community is rich with amenities, offering a vibrant lifestyle just moments from your doorstep. Explore local parks, boutique shops, and delightful dining options that make this neighborhood truly special. This property is not just a house; it's a place to create lasting memories. Experience the warmth of home in a setting that combines modern living with classic charm. Don't miss the opportunity to make this enchanting townhouse your own and embrace the exclusive lifestyle it offers.
-
2025-01-30soldstatus $54,000
-
2023-09-29soldstatus $19,800 Closed 639-char remark
Show marketing remark (639 chars)
ONLINE AUCTION: Bidding begins 8/29/2023 @ 10:00 AM. Bidding ends 8/31/2023 @ 12:10 PM. List Price is Suggested Opening Bid. Deposit: $5,000 The property is a two-story townhome situated in the Penrose/Fayette Street Outreach neighborhood of West Baltimore. Gwynns Falls Park, notable for its trail system and urban wilderness, and Westside Shopping Center, offering various retail stores, are within a few blocks. Other nearby locations include Grace Medical Center and the Westside MARC Train Station, providing additional transport options. The property is conveniently located with easy access to Frederick Ave, a major traffic artery.
-
2023-09-01status Pending 639-char remark
Show marketing remark (639 chars)
ONLINE AUCTION: Bidding begins 8/29/2023 @ 10:00 AM. Bidding ends 8/31/2023 @ 12:10 PM. List Price is Suggested Opening Bid. Deposit: $5,000 The property is a two-story townhome situated in the Penrose/Fayette Street Outreach neighborhood of West Baltimore. Gwynns Falls Park, notable for its trail system and urban wilderness, and Westside Shopping Center, offering various retail stores, are within a few blocks. Other nearby locations include Grace Medical Center and the Westside MARC Train Station, providing additional transport options. The property is conveniently located with easy access to Frederick Ave, a major traffic artery.
-
2023-06-30$10,000 Active 639-char remark
Show marketing remark (639 chars)
ONLINE AUCTION: Bidding begins 8/29/2023 @ 10:00 AM. Bidding ends 8/31/2023 @ 12:10 PM. List Price is Suggested Opening Bid. Deposit: $5,000 The property is a two-story townhome situated in the Penrose/Fayette Street Outreach neighborhood of West Baltimore. Gwynns Falls Park, notable for its trail system and urban wilderness, and Westside Shopping Center, offering various retail stores, are within a few blocks. Other nearby locations include Grace Medical Center and the Westside MARC Train Station, providing additional transport options. The property is conveniently located with easy access to Frederick Ave, a major traffic artery.
ⓘ Source: listings_history table (triggers on properties + properties_extension) + one-shot
backfill from property_details.listing_events for pre-trigger history.
Tax reassessment forecast MD · Partial reset (capped growth)
- Current annual tax
- $285 · $24/mo
- Projected year-2 tax
- $876 · $73/mo
- Expected delta
- +$591/yr (+$49/mo · 207.2%)
ⓘ Screening estimate from a state-policy table — verify with the county assessor before closing.
Climate risk First Street
- Flood 1/10 Low FEMA zone X (unshaded) · 0% chance over 30 yrs
- Wildfire 1/10 Low
- Heat 8/10 Severe 7 d/yr ≥103°F today · 15 d/yr by 30 yrs out
- Wind 6/10 Major 27% chance of damaging wind over 30 yrs
- Air quality 3/10 Moderate 3 unhealthy d/yr today · 4 by 30 yrs out
Nearby sold comps map
Loading sold comps map…
Walkable amenities ~0.75 mi
Loading nearby amenities…
Taxation est. · year 1
- Rental income
- $22,691
- − Mortgage interest
- −$7,534
- − Property taxes
- −$285
- − Insurance
- −$672
- − Repairs & maintenance
- −$1,815
- − Management
- −$1,815
- − Depreciation
- −$3,913
- Taxable income
- $6,656
- Est. tax owed @ 24.0%
- −$1,597
- After-tax cash flow
- $6,907/yr
For passive investors: Depreciation is non-cash, so a rental often shows a tax loss while cash-flowing — sheltering income. Rental losses are passive: they offset passive income freely, and up to $25,000/yr can offset ordinary (W-2) income if you actively participate and your MAGI is under $100k (phasing out to $0 by $150k); unused losses carry forward. On sale, claimed depreciation is recaptured at up to 25%, and gains may owe capital-gains tax (a 1031 exchange can defer both). Figures are a year-1 estimate at your 24.0% rate — not tax advice; consult a CPA.
Schools (NCES district)
- District
- Baltimore City Public Schools
- NCES district ID
- 2400090
- Math proficiency
- 7% ▼ -9.00%
- Reading proficiency
- 16% ▼ -5.00%
- Median HH income
- $42,108
- Composite
- 10.08/100
- National rank
- #9805
- State rank
- #24 of 24 in MD
Livability — Baltimore
- Score
- 76/100
- State rank
- #90
- US rank
- #3396
Category grades
Schools grade is shown separately in the Schools card above.
Census & demographics
- Census place
- Baltimore, MD
- County
- Baltimore City · 558,601 people
- City population
- 588,727
- Metro
- Baltimore-Columbia-Towson, MD
- Population (ZIP)
- 19,572
- Household income
- $45,840
- Rent vs Own
- Severe rent burden
- 1755.0
Population outlook (Baltimore County) Hauer SSP2
- Today (2025)
- 624,249 people
- By 2030
- 621,541 · -0.4%
- By 2040
- 609,756 · -2.3%
- By 2050
- 597,249 · -4.3%
- By 2075
- 552,236 · -11.5%
- By 2100
- 513,934 · -17.7%
Race, ethnicity, and origin ACS 2023
- Neighborhood character
- Predominantly Black (72%)
- Race & ethnicity
- Black 72% White 16% Hispanic / Latino 7% Two or more races 6% Asian 1%
- Hispanic origin (detail)
- Mexican 3% Puerto Rican 1%
- Common ancestry
- Romanian 1%
- Foreign-born
- 8% · Canada
- Languages at home
- 90% English-only · Spanish 6% French/Haitian/Cajun 2% Other Indo-European 1%
Political lean MEDSL · Baltimore
- 2024 margin
- Solid D (+73.0) · D 85.2% · R 12.2% · Other 2.6%
- 2008→2024 swing
- -2.5pp toward R · 2008: 75.5pp · 2024: 73.0pp
- All cycles
- 2024: D+73.0 2020: D+76.6 2016: D+74.6 2012: D+76.4 2008: D+75.5
Not yet ingested
- Civics
- —
Market trends
- HPI YoY
- ▼ -97.99%
- Current HPI
- 140.5836
- Rent YoY
- ▲ 7.51%
- Metro
- Baltimore-Columbia-Towson, MD
- State GDP YoY
- ▲ 2.97%
- F500 in state
- 12
Industry mix (Fortune 500 HQ in MD)
| Industry | F500 HQs | Revenue |
|---|---|---|
| Aerospace / Defense | 1 | $71B |
|
||
| Utilities | 1 | $25B |
|
||
| Hotels | 1 | $24B |
|
||
| Consumer Goods | 1 | $7B |
|
||
| Real Estate | 1 | $6B |
|
||
| Chemicals | 1 | $2B |
|
||
Price history
+1245.0% since first listed5 events — show timeline
- 2026-01-28 Listed $134,500 BRIGHT MLS
- 2025-01-30 Sold (Public Records) $54,000 Public Records
- 2023-09-29 Sold (MLS) $19,800 BRIGHT MLS
- 2023-09-01 Pending — BRIGHT MLS
- 2023-06-30 Listed $10,000 BRIGHT MLS
Property tax history
-1.8%/yrLatest (2025): $285 · +50.4% YoY. Source: county tax records.
Cash-flow waterfall
monthlySold comps — $/sqft
last 12 mo · ≤1 miLoading sold comps…