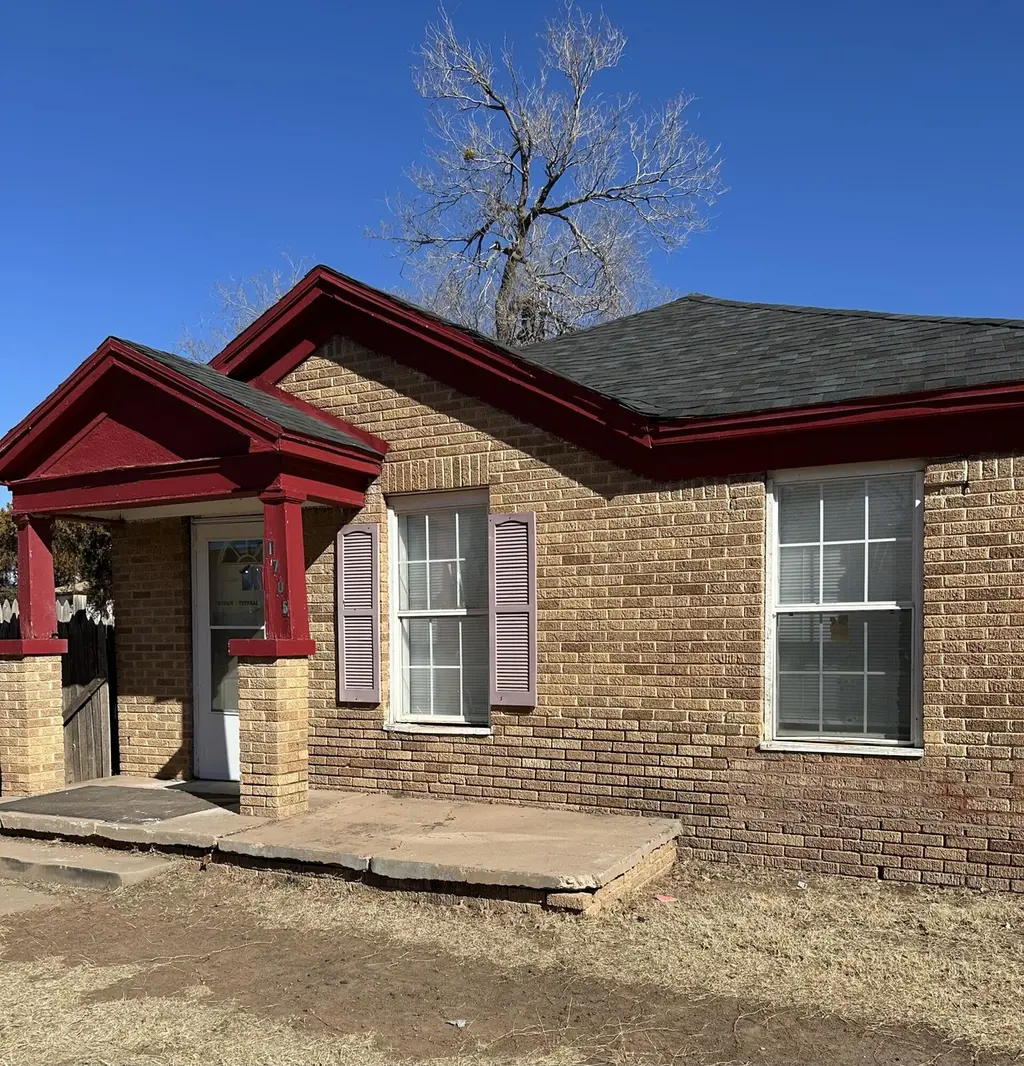
1705 Avenue S · Lubbock, TX
Flood risk 1/10 · Minimal
- FEMA flood zone
- X (unshaded)
- Chance of flooding over 30 yrs
- 0.0%
- Est. flood insurance / yr
- $507 – $1,088
Fire risk 1/10 · Minimal
- Est. fire insurance / yr
- $1,222 – $2,270
Heat risk 5/10 · Moderate
- Hot days now (above 100°F)
- 7 days/yr
- Hot days in 30 yrs
- 22 days/yr
Wind risk 2/10 · Minimal
- Chance of severe wind over 30 yrs
- —
Air-quality risk 2/10 · Minimal
- Unhealthy air days now
- 1 days/yr
- Unhealthy air days in 30 yrs
- 1 days/yr
Risk factors via First Street. Map © Google.
Why this score? — see what drove the B- grade
The composite is a weighted blend of 9 inputs, each scored 0–100. Each bar is that input's sub-score; the figure is the points it added to the 100-point composite (weight × sub-score).
- Cash flow +27.1/30.0
- DSCR +9.4/10.0
- Appreciation +8.4/10.0
- 1% rule +8.0/10.0
- Rent growth +4.6/5.0
- Livability +4.0/5.0
- Schools +3.1/10.0
- Condition / age +2.5/5.0
- ARV discount +0.0/15.0
$59,000
🖨 Deal sheet 📄 Offer letter ✓ Due diligence
Listing remarks MLS
Perfect for a first time homebuyer or an investor wanting to add to their portfolio. Renovations include brand NEW roof, vinyl plank flooring and fresh paint throughout, reglazed bathtub, and new vanity. Minutes from Texas Tech, and Depot District. Come check it out today!
Key facts
- Depot district
- New vanity
- New paint
Tags
Neighborhood map
What this means for you Summary
Snapshot
- This is a 2-bed/1.0-bath single-family listed at $59k.
Deal economics
- At list price, monthly cash flow is $167 ($2k/yr) — positive.
- The deal already cash-flows at list — no discount required.
- Meets the 1% rule at list price ($769 rent vs $59k).
- Recommended offer: $52k (12.0% below list) — sets the bar for market timing.
Location & tenants
- Location reads 80/100 on livability (#37 in TX, #1,749 nationally) — a professional / high-income tenant draw. Strengths: commute A+, cost of living A+, housing A+; Watch: employment C-, schools D+, crime F.
- Lubbock ISD (urban): math 36% / reading 39% proficiency, ranked #481 of 826 in TX (top 58%) — families likely to look elsewhere, expect single-tenant / working-renter base with shorter leases; 60% free/reduced lunch — lower-income household profile, screen leases tightly.
- Market conditions: Rents rising fast (+8.3%/yr); 33 active listings in the ZIP; 40 comparable units currently listed for rent nearby; rentals at typical pace (median 21d on market — plan ~3-4 weeks tenant-placement turnaround); 48% of comp listings sitting > 30 days — soft ceiling on asking rent; lower-income renter base — watch delinquency; 2,219 units permitted in Lubbock County in 2024 (252 in 5+ unit buildings).
- This rent runs 34% of the median local income ($27k/yr) — at the standard rent-burdened threshold; future hikes will face affordability resistance.
Forward outlook
- In year one you build about $4k of equity ($408 loan paydown + $4k appreciation (6.7% local appreciation)).
- Lubbock County population projected at +39% by 2050 — long-run rental-demand tailwind backs the buy-and-hold thesis.
- At projected returns (6.7% appreciation + 8.0% rent growth), your $17k cash investment doubles in ~3 years — after that, you're playing with house money.
- By year 8, paydown + projected appreciation supports a ~$34k cash-out refi (75% LTV) — recoverable capital for the next deal without selling this one.
Negotiation context
- It's been on market 131 days — a 12% lower offer ($52k) is reasonable based on typical stale-listing flexibility.
Risks & watch-outs
- Watch-outs: built in 1940 — expect roof / HVAC / electrical / plumbing capex.
- Climate carrying-cost: extreme-heat days projected 7→22/yr by 2055 (HVAC capex compounding) — expect insurance premiums to compound above CPI over the hold.
Questions for the listing agent
- It's been on market 131 days. Have you received any prior offers? Is the seller open to a 12% concession, seller financing, or rate buy-down credit?
- Built in 1940 — when were the roof, HVAC, electrical panel, plumbing, and water heater last replaced?
- Why hasn't it sold? Are there any deal-killer items the seller is aware of (foundation, flood, title, zoning, code violations)?
- Is there a deadline driving the sale (1031 exchange, divorce, estate, relocation)? That informs how much negotiation room exists.
- Schools are D-rated, which usually means shorter tenancies and higher turnover. Who's the typical renter profile here, and what's been the actual vacancy rate?
- Crime grade is F in this area — have there been break-ins, vandalism, or insurance claims at this property in the last 3 years? What carrier currently insures it and at what premium?
- What's the average days-on-market for RENTAL listings here right now (not sales)? A rising rental-DOM trend means longer vacancies and softer asking-rent achievability than the comps imply.
- What's the recent tenant-quality profile in this submarket — average credit score on applications, eviction rate, late-payment / NSF rate, and stable-employment percentage? A property-management company in the area should have these aggregated.
- How much new for-sale + rental construction is in the pipeline within 1–3 miles? Heavy new supply typically softens prices + rents 12–24 months out; constrained supply supports both.
Investment metrics
- 1% rule
- 1.30% ✓
- Cap rate
- 9.70%
- Cash-on-cash
- 12.16%
- DSCR
- 1.54
- GRM
- 6.4
CMA / ARV
- ARV (median comp)
- $49,077
- List price
- $59,000
- Delta
- 20.22%
- Verdict
- OVERPRICED
- Comps
- 1 within 2.0 mi
Projected returns pro-forma
6.7% appreciation · 8.0% rent growth · sell at horizon
- IRR
- 29.8%
- Equity multiple
- 3.08×
- Total profit
- $34,286
- Equity at exit
- $39,744
- IRR
- 29.6%
- Equity multiple
- 7.18×
- Total profit
- $102,101
- Equity at exit
- $74,485
Cash invested: $16,520 (down + closing). Projections, not guarantees.
Landlord ↔ Tenant lean methodology
- Overall (STATE)
- 87 Strongly Landlord-Friendly
- State Texas
- 87 Strongly Landlord-Friendly · R+5
- County
- — inherits STATE
- City
- — inherits STATE
ZIP-level market 79401
- Home prices YoY
- 3.0%
- Rents YoY
- 8.3%
- Active inventory
- 33
- Price-to-rent
- 6.4×
Monthly cashflow live
- Estimated rent
- $769 high interval (Pro) →
- Mortgage (P&I)
- −$309
- Tax from tax record
- −$106 /mo · $1,275/yr
- Insurance
- −$25
- HOA
- −$0
- Vacancy / Maint / Mgmt
- −$162
- Net cashflow
- $167
Break-even live
UW: 25.0% down · 7.5% · 30yr · 1.5% tax · 5.0% vac · 8.0% maint · 8.0% mgmt
Financing live
Cash to close
- Down payment
- $14,750
- Closing costs
- $1,770
- Reserves months
- —
- Total cash needed
- —
Loan-product check · same deal, 3 products live
Conventional
25% down · 7.5% · 30yr
- Down + closing
- —
- Monthly P&I
- —
- Monthly cashflow
- —
- DSCR
- —
- Eligible?
- —
Personal DTI + credit; lowest rate.
DSCR
20% down · 8.5% · 30yr
- Down + closing
- —
- Monthly P&I
- —
- Monthly cashflow
- —
- DSCR
- —
- Eligible?
- —
No personal income docs; deal must DSCR.
Hard money
10% down · 12.0% · 12mo
- Down + closing
- —
- Monthly P&I
- —
- Monthly cashflow
- —
- DSCR
- —
- Eligible?
- —
Short-term bridge; refi at stabilization.
Rent comps 40 comps
| Address | Beds | Baths | Sqft | Rent | $/sqft | DOM | Units | Dist |
|---|---|---|---|---|---|---|---|---|
| 1710 Avenue R Unit MR2 206 Lubbock, TX | 1.0 | 1.0 | 580 | $600 | $1.03 | 43d | 1 | 0.02mi |
| 1914 20th St Lubbock, TX | 1.0 | 1.0 | 750 | $499 | $0.67 | 13d | 1 | 0.17mi |
| 2010 Avenue S Lubbock, TX | 1.0 | 1.0 | 625 | $599 | $0.96 | 13d | 1 | 0.21mi |
| 1911 21st St Unit B Lubbock, TX | 2.0 | 1.0 | 714 | $750 | $1.05 | 43d | 1 | 0.25mi |
| 1915 Avenue O Unit O Lubbock, TX | 2.0 | 1.0 | 732 | $750 | $1.02 | 43d | 1 | 0.31mi |
| 1913 13th St Unit REAR Lubbock, TX | 1.0 | 1.0 | 743 | $700 | $0.94 | 43d | 1 | 0.31mi |
| 1909 23rd St Lubbock, TX | 1.0 | 1.0 | 500 | $600 | $1.20 | 43d | 1 | 0.39mi |
| 1805 Avenue V Unit V Lubbock, TX | 2.0 | 1.0 | 558 | $599 | $1.07 | 21d | 1 | 0.40mi |
| 2117 15th St Unit C Lubbock, TX | 1.0 | 1.0 | 600 | $575 | $0.96 | 21d | 1 | 0.41mi |
| 2202 15th St Unit 5 Lubbock, TX | 1.0 | 1.0 | 600 | $600 | $1.00 | 43d | 1 | 0.47mi |
| 2211 17th St Unit A Lubbock, TX | 1.0 | 1.0 | 675 | $675 | $1.00 | 13d | 1 | 0.47mi |
| 1604 W AVE Unit 8 Lubbock, TX | 1.0 | 1.0 | 700 | $699 | $1.00 | 43d | 1 | 0.48mi |
| 1604 W AVE Unit 5 Lubbock, TX | 1.0 | 1.0 | 700 | $699 | $1.00 | 43d | 1 | 0.48mi |
| 2510 Avenue T Lubbock, TX | 1.0 | 1.0 | 500 | $935 | $1.87 | 43d | 1 | 0.55mi |
| 2604 S 2604 Ave S A Unit 2604 Lubbock, TX | 1.0 | 1.0 | 572 | $625 | $1.09 | 43d | 1 | 0.57mi |
| 1917 26th St Unit B Lubbock, TX | 1.0 | 1.0 | 550 | $725 | $1.32 | 21d | 1 | 0.57mi |
| 1917 26th St Unit B Lubbock, TX | 1.0 | 1.0 | 550 | $735 | $1.34 | 43d | 1 | 0.57mi |
| 1710 9th St Unit 29 Lubbock, TX | 2.0 | 1.0 | 700 | $1,000 | $1.43 | 13d | 1 | 0.60mi |
| 1220 Broadway St Lubbock, TX | 1.0–2.0 | 1.0–2.0 | 932 | $1,500 | $1.61 | 13d | 7 | 0.61mi |
| 1220 Broadway St Unit 2001 Lubbock, TX | 1.0 | 1.0 | 725 | $1,350 | $1.86 | 44d | 1 | 0.61mi |
| 2205 25th St Lubbock, TX | 1.0 | 1.0 | 440 | $650 | $1.48 | 21d | 1 | 0.62mi |
| 1925 27th St Lubbock, TX | 1.0 | 1.0 | 392 | $550 | $1.40 | 13d | 1 | 0.64mi |
| 2324 14th St Unit Rear B Lubbock, TX | 1.0 | 1.0 | 568 | $575 | $1.01 | 43d | 1 | 0.70mi |
| 1202 Main St Lubbock, TX | 3.0 | 1.0–2.0 | 919 | $1,341 | $1.46 | 13d | 13 | 0.71mi |
| 1608 29th St Unit A Lubbock, TX | 1.0 | 1.0 | 505 | $595 | $1.18 | 13d | 1 | 0.75mi |
| 1608 29th St Unit B Lubbock, TX | 2.0 | 1.5 | 694 | $750 | $1.08 | 13d | 1 | 0.75mi |
| 1608 29th St Unit C Lubbock, TX | 1.0 | 1.0 | 680 | $650 | $0.96 | 43d | 1 | 0.75mi |
| 2323 25th St Unit Rear Lubbock, TX | 1.0 | 1.0 | 475 | $650 | $1.37 | 43d | 1 | 0.76mi |
| 2305 27th St Lubbock, TX | 1.0 | 1.0 | 516 | $625 | $1.21 | 21d | 1 | 0.81mi |
| 3104 Avenue N Lubbock, TX | 2.0 | 1.0 | 750 | $785 | $1.05 | 21d | 1 | 0.97mi |
| 1707 32nd St Lubbock, TX | 1.0 | 1.0 | 400 | $575 | $1.44 | 43d | 1 | 0.97mi |
| 2320 30th St Lubbock, TX | 1.0 | 1.0 | 480 | $625 | $1.30 | 13d | 1 | 0.99mi |
| 2422 29th St Unit REAR Lubbock, TX | 1.0 | 1.0 | 480 | $600 | $1.25 | 21d | 1 | 1.02mi |
| 2118 33rd St Unit B Lubbock, TX | 1.0 | 1.0 | 676 | $550 | $0.81 | 21d | 1 | 1.04mi |
| 226 S AVE Unit C Lubbock, TX | 1.0 | 1.0 | 665 | $525 | $0.79 | 43d | 1 | 1.06mi |
| 301 Avenue U Lubbock, TX | 1.0–2.0 | 1.0 | 625 | $875 | $1.40 | 13d | 4 | 1.07mi |
| 2308 33rd St Lubbock, TX | 1.0 | 1.0 | 696 | $850 | $1.22 | 43d | 1 | 1.11mi |
| 218 Avenue U Unit A Lubbock, TX | 1.0 | 1.0 | 665 | $525 | $0.79 | 13d | 1 | 1.13mi |
| 124 Temple Ave Lubbock, TX | 1.0 | 1.0 | 600 | $650 | $1.08 | 43d | 1 | 1.21mi |
| 124 Temple Ave Lubbock, TX | 1.0 | 1.0 | 600 | $600 | $1.00 | 21d | 1 | 1.21mi |
Listing history 22 events
-
2026-06-18days on market $59,000 Active 131 DOM
-
2026-06-17days on market $59,000 Active 130 DOM
-
2026-06-16days on market $59,000 Active 129 DOM
-
2026-06-15days on market $59,000 Active 128 DOM
-
2026-06-14days on market $59,000 Active 126 DOM
-
2026-06-13days on market $59,000 Active 125 DOM
-
2026-06-10days on market $59,000 Active 123 DOM
-
2026-06-09days on market $59,000 Active 122 DOM
-
2026-06-08days on market $59,000 Active 121 DOM
-
2026-06-07days on market $59,000 Active 120 DOM
-
2026-06-05days on market $59,000 Active 117 DOM
-
2026-06-03days on market $59,000 Active 116 DOM
-
2026-06-02days on market $59,000 Active 115 DOM
-
2026-06-01days on market $59,000 Active 114 DOM
-
2026-05-31days on market $59,000 Active 113 DOM
-
2026-05-30days on market $59,000 Active 112 DOM
-
2026-05-05price $59,000 273-char remark
Show marketing remark (273 chars)
Perfect for a first time homebuyer or an investor wanting to add to their portfolio. Renovations include brand NEW roof, vinyl plank flooring and fresh paint throughout, reglazed bathtub, and new vanity. Minutes from Texas Tech, and Depot District. Come check it out today!
-
2026-04-10price $69,000 273-char remark
Show marketing remark (273 chars)
Perfect for a first time homebuyer or an investor wanting to add to their portfolio. Renovations include brand NEW roof, vinyl plank flooring and fresh paint throughout, reglazed bathtub, and new vanity. Minutes from Texas Tech, and Depot District. Come check it out today!
-
2026-03-12price $69,900 273-char remark
Show marketing remark (273 chars)
Perfect for a first time homebuyer or an investor wanting to add to their portfolio. Renovations include brand NEW roof, vinyl plank flooring and fresh paint throughout, reglazed bathtub, and new vanity. Minutes from Texas Tech, and Depot District. Come check it out today!
-
2026-02-08$75,000 Active 273-char remark
Show marketing remark (273 chars)
Perfect for a first time homebuyer or an investor wanting to add to their portfolio. Renovations include brand NEW roof, vinyl plank flooring and fresh paint throughout, reglazed bathtub, and new vanity. Minutes from Texas Tech, and Depot District. Come check it out today!
-
2025-10-15soldstatus
-
1986-03-01soldstatus
ⓘ Source: listings_history table (triggers on properties + properties_extension) + one-shot
backfill from property_details.listing_events for pre-trigger history.
Tax reassessment forecast TX · Resets to sale price
- Current annual tax
- $1,275 · $106/mo
- Projected year-2 tax
- $1,275 · $106/mo
- Expected delta
- $0/yr ($0/mo · 0.0%)
ⓘ Screening estimate from a state-policy table — verify with the county assessor before closing.
Climate risk First Street
- Flood 1/10 Low FEMA zone X (unshaded) · 0% chance over 30 yrs
- Wildfire 1/10 Low
- Heat 5/10 Major 7 d/yr ≥100°F today · 22 d/yr by 30 yrs out
- Wind 2/10 Low
- Air quality 2/10 Low 1 unhealthy d/yr today · 1 by 30 yrs out
Nearby sold comps map
Loading sold comps map…
Walkable amenities ~0.75 mi
Loading nearby amenities…
Taxation est. · year 1
- Rental income
- $9,230
- − Mortgage interest
- −$3,305
- − Property taxes
- −$1,275
- − Insurance
- −$295
- − Repairs & maintenance
- −$738
- − Management
- −$738
- − Depreciation
- −$1,716
- Taxable income
- $1,162
- Est. tax owed @ 24.0%
- −$279
- After-tax cash flow
- $1,730/yr
For passive investors: Depreciation is non-cash, so a rental often shows a tax loss while cash-flowing — sheltering income. Rental losses are passive: they offset passive income freely, and up to $25,000/yr can offset ordinary (W-2) income if you actively participate and your MAGI is under $100k (phasing out to $0 by $150k); unused losses carry forward. On sale, claimed depreciation is recaptured at up to 25%, and gains may owe capital-gains tax (a 1031 exchange can defer both). Figures are a year-1 estimate at your 24.0% rate — not tax advice; consult a CPA.
Schools (NCES district)
- District
- Lubbock ISD
- NCES district ID
- 4828500
- Math proficiency
- 36% ▼ -8.00%
- Reading proficiency
- 39% ▼ -1.00%
- Median HH income
- $39,820
- Composite
- 31.44/100
- National rank
- #5984
- State rank
- #481 of 826 in TX
Livability — Lubbock
- Score
- 80/100
- State rank
- #37
- US rank
- #1749
Category grades
Schools grade is shown separately in the Schools card above.
Census & demographics
- Census place
- Lubbock, TX
- County
- Lubbock County · 293,542 people
- City population
- 283,030
- Metro
- Lubbock, TX
- Population (ZIP)
- 8,741
- Household income
- $26,980
- Rent vs Own
- Severe rent burden
- 1389.0
Population outlook (Lubbock County) Hauer SSP2
- Today (2025)
- 345,960 people
- By 2030
- 371,449 · +7.4%
- By 2040
- 424,539 · +22.7%
- By 2050
- 481,150 · +39.1%
- By 2075
- 633,467 · +83.1%
- By 2100
- 746,853 · +115.9%
Race, ethnicity, and origin ACS 2023
- Neighborhood character
- Diverse neighborhood (Simpson 0.64)
- Race & ethnicity
- White 47% Hispanic / Latino 37% Two or more races 14% Black 8% Asian 5%
- Hispanic origin (detail)
- Mexican 29%
- Common ancestry
- Lithuanian 3% Romanian 1% Iranian 1%
- Foreign-born
- 11% · Canada, South Korea, Jamaica
- Languages at home
- 73% English-only · Spanish 20% Other Indo-European 3% Korean 1%
Political lean MEDSL · Lubbock
- 2024 margin
- Solid R (+39.5) · D 29.7% · R 69.2% · Other 1.0%
- 2008→2024 swing
- -2.8pp toward R · 2008: -36.7pp · 2024: -39.5pp
- All cycles
- 2024: R+39.5 2020: R+32.2 2016: R+38.4 2012: R+40.9 2008: R+36.7
Not yet ingested
- Civics
- —
Market trends
- HPI YoY
- ▲ 6.70%
- Current HPI
- 233.4915
- Rent YoY
- ▲ 8.31%
- Metro
- Lubbock, TX
- State GDP YoY
- ▲ 3.95%
- F500 in state
- 110
Industry mix (Fortune 500 HQ in TX)
| Industry | F500 HQs | Revenue |
|---|---|---|
| Energy | 16 | $1,198B |
|
||
| Technology | 5 | $198B |
|
||
| Engineering / Construction | 4 | $72B |
|
||
| Energy Services | 3 | $60B |
|
||
| Utilities | 3 | $41B |
|
||
| Healthcare | 2 | $330B |
|
||
Price history
-21.3% since first listed6 events — show timeline
- 2026-05-05 Price Changed $59,000 LARMLS
- 2026-04-10 Price Changed $69,000 LARMLS
- 2026-03-12 Price Changed $69,900 LARMLS
- 2026-02-08 Listed $75,000 LARMLS
- 2025-10-15 Sold (Public Records) — Public Records
- 1986-03-01 Sold (Public Records) — Public Records
Property tax history
+3.8%/yrLatest (2025): $1,275 · +7.2% YoY. Source: county tax records.
Cash-flow waterfall
monthlySold comps — $/sqft
last 12 mo · ≤1 miLoading sold comps…