 Multi-family
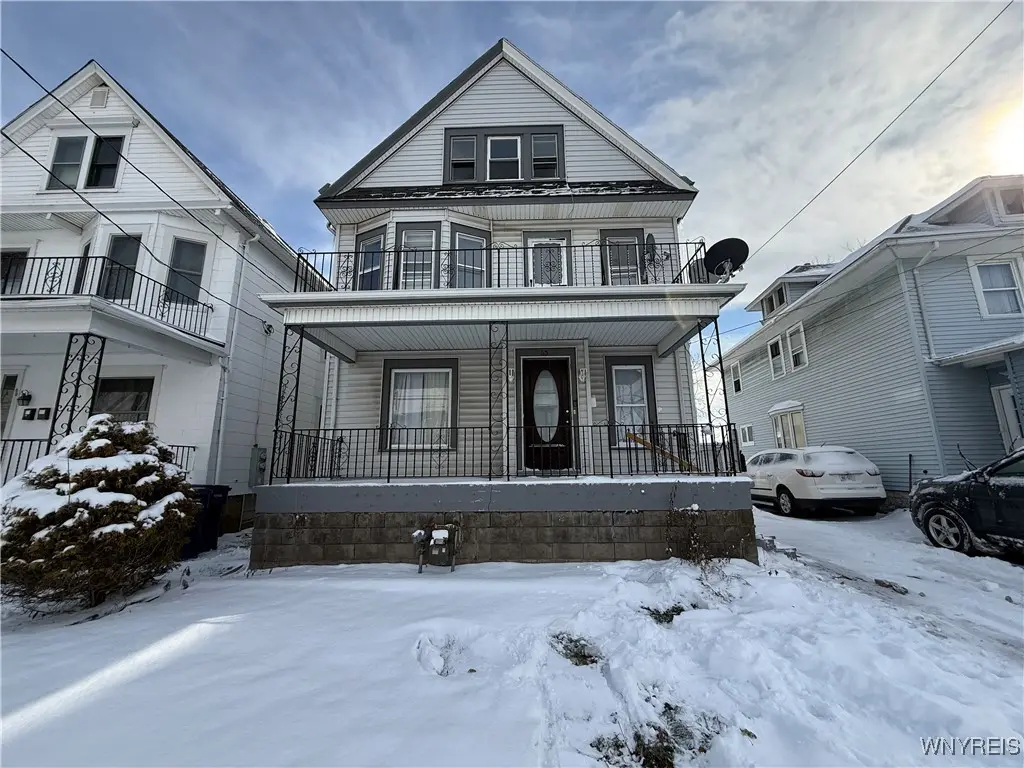
65 Hunt Ave · Buffalo, NY
Flood risk 1/10 · Minimal
- FEMA flood zone
- X (unshaded)
- Chance of flooding over 30 yrs
- 0.0%
- Est. flood insurance / yr
- $473 – $860
Fire risk 1/10 · Minimal
- Est. fire insurance / yr
- $691 – $1,283
Heat risk 3/10 · Minor
- Hot days now (above 93°F)
- 7 days/yr
- Hot days in 30 yrs
- 15 days/yr
Wind risk 1/10 · Minimal
- Chance of severe wind over 30 yrs
- —
Air-quality risk 4/10 · Minor
- Unhealthy air days now
- 4 days/yr
- Unhealthy air days in 30 yrs
- 9 days/yr
Risk factors via First Street. Map © Google.
Why this score? — see what drove the D+ grade
The composite is a weighted blend of 9 inputs, each scored 0–100. Each bar is that input's sub-score; the figure is the points it added to the 100-point composite (weight × sub-score).
- Cash flow +15.5/30.0
- ARV discount +8.0/15.0
- DSCR +4.8/10.0
- Rent growth +4.5/5.0
- Livability +3.9/5.0
- Schools +3.3/10.0
- 1% rule +2.9/10.0
- Condition / age +2.5/5.0
- Appreciation +0.0/10.0
$174,400
🖨 Deal sheet (PDF) 📄 Offer letter ✓ Due diligence
Multi-family units
County records classify this as Multi-Family (2-4 Unit). Listing-text estimate: 1 unit. estimate disagrees with records
Listing remarks MLS
Welcome to 65 Hunt Avenue, a well-maintained single-family home located in the City of Buffalo. This property offers 4 bedrooms and 1.5 bathrooms, providing a spacious and functional layout suitable for both owner-occupants and investors. The home is currently rented for $1,260 per month, offering immediate income potential. Features include solid mechanics, a full basement, and a full attic, providing ample storage and future flexibility. Additional highlights include a detached garage, first-floor laundry, and vinyl flooring throughout for easy maintenance. Conveniently located near public transportation, shopping, and everyday amenities, this property presents a strong opportunity for those seeking a reliable investment or a future primary residence. Don’t miss your chance to own this versatile Buffalo home. Seller will provide the existing survey with an affidavit of no change and a 40-year search on the note.
Key facts
- Vinyl flooring
- Full basement
- Full attic
Tags
Neighborhood map
What this means for you Summary
Snapshot
- This is a 3-bed/1.5-bath multifamily listed at $174k.
Deal economics
- At list price, monthly cash flow is $70 ($841/yr) — positive.
- The deal already cash-flows at list — no discount required.
- To meet the 1% rule (rent ≥ 1% of price), the offer needs to be $138k (21.1% below list).
- Recommended offer: $138k (21.1% below list) — sets the bar for 1% rule.
Location & tenants
- Location reads 77/100 on livability (#195 in NY, #3,011 nationally) — a middle-class / working-renter tenant base. Strengths: commute A+, housing A+, health & safety A+; Watch: crime F, employment D-.
- Buffalo City School District (urban): math 41% / reading 40% proficiency, ranked #535 of 590 in NY (top 91%) — families likely to look elsewhere, expect single-tenant / working-renter base with shorter leases; 75% free/reduced lunch — lower-income household profile, screen leases tightly.
- Zoned schools: International School (math 8% / reading 17%, grade F, #2,048 of 2,108 statewide, top 97%, 981 students, 92% FRL); Hutchinson Central Technical High School (math 96% / reading 32%, grade B-, #807 of 1,100 statewide, top 73%, 1,175 students, 78% FRL).
- Market conditions: Rents rising fast (+8.2%/yr); 199 active listings in the ZIP; 10 comparable units currently listed for rent nearby; rentals at typical pace (median 24d on market — plan ~3-4 weeks tenant-placement turnaround); lower-income renter base — watch delinquency; 1,244 units permitted in Erie County in 2024 (563 in 5+ unit buildings).
- This rent runs 42% of the median local income ($40k/yr) — at the standard rent-burdened threshold; future hikes will face affordability resistance.
Forward outlook
- Local home prices are declining (-3.0%/yr); year-one equity from $1k of loan paydown is wiped out by about $5k of value loss. Plan a longer hold.
Negotiation context
- It's been on market 104 days — a 9% lower offer ($159k) is reasonable based on typical stale-listing flexibility.
- 2 sale attempts since 14y ago with the ask held roughly flat each time — persistent listings suggest the price (not the market) is what's stuck; bring a comps-based counter.
- Current owner paid $20k; list at $174k implies a 759% gain — meaningful room to come down on a strong offer.
Risks & watch-outs
- Watch-outs: built in 1901 — expect roof / HVAC / electrical / plumbing capex.
Questions for the listing agent
- It's been on market 104 days. Have you received any prior offers? Is the seller open to a 21% concession, seller financing, or rate buy-down credit?
- Built in 1901 — when were the roof, HVAC, electrical panel, plumbing, and water heater last replaced?
- Why hasn't it sold? Are there any deal-killer items the seller is aware of (foundation, flood, title, zoning, code violations)?
- Is there a deadline driving the sale (1031 exchange, divorce, estate, relocation)? That informs how much negotiation room exists.
- Crime grade is F in this area — have there been break-ins, vandalism, or insurance claims at this property in the last 3 years? What carrier currently insures it and at what premium?
- The area grade is low — what's the realistic commute time and amenity access for the typical tenant pool here? Any planned neighborhood developments (good or bad) we should know about?
- What's the average days-on-market for RENTAL listings here right now (not sales)? A rising rental-DOM trend means longer vacancies and softer asking-rent achievability than the comps imply.
- What's the recent tenant-quality profile in this submarket — average credit score on applications, eviction rate, late-payment / NSF rate, and stable-employment percentage? A property-management company in the area should have these aggregated.
- How much new apartment / multifamily construction is in the pipeline within 1–3 miles? Heavy new supply (>2% of stock underway) typically softens rents 12–24 months out; light construction supports rent growth.
Investment metrics
- 1% rule
- 0.79% ✗
- Cap rate
- 6.78%
- Cash-on-cash
- 1.72%
- DSCR
- 1.08
- GRM
- 10.6
CMA / ARV
- ARV (median comp)
- $176,547
- List price
- $174,400
- Delta
- -1.22%
- Verdict
- FAIR
- Comps
- 20 within 1.0 mi
Show comp detail 12 sales within ~0.75 mi
| Address | Dist | Beds/Ba | Sqft | Sold | Price | $/sf | Match |
|---|---|---|---|---|---|---|---|
| 163 Royal Ave | 0.27mi | 4/2.0 (+1) | 1,631 (+1%) | 14mo | $126,000 | $77 | 68 |
| 151 Crowley Ave | 0.37mi | 4/2.0 (+1) | 1,565 (-3%) | 10mo | $89,000 | $57 | 62 |
| 109 Crowley Ave | 0.38mi | 4/2.0 (+1) | 1,624 (+0%) | 15mo | $108,750 | $67 | 62 |
| 14 Collaton St | 0.35mi | 4/2.0 (+1) | 1,708 (+6%) | 9mo | $105,000 | $61 | 60 |
| 29 Riverside Ave | 0.39mi | 4/2.0 (+1) | 1,660 (+3%) | 18mo | $200,900 | $121 | 56 |
| 31 Philadelphia St | 0.64mi | 3/2.0 | 1,628 (+1%) | 15mo | $220,000 | $135 | 55 |
| 77 Eckhert St | 0.74mi | 4/2.0 (+1) | 1,584 (-2%) | 6mo | $211,000 | $133 | 50 |
| 29 Philadelphia St | 0.65mi | 4/2.0 (+1) | 1,584 (-2%) | 11mo | $209,000 | $132 | 50 |
| 87 Laird Ave | 0.41mi | 4/2.0 (+1) | 1,419 (-12%) | 7mo | $150,000 | $106 | 48 |
| 19 Wyandotte Ave | 0.70mi | 4/2.0 (+1) | 1,610 (-0%) | 15mo | $108,750 | $68 | 47 |
| 23 Wyandotte Ave | 0.71mi | 4/2.0 (+1) | 1,496 (-8%) | 6mo | $150,000 | $100 | 42 |
| 270 East St | 0.73mi | 4/2.0 (+1) | 1,497 (-8%) | 13mo | $80,000 | $53 | 36 |
Match score weights: distance 35% · size 25% · config 20% · recency 20%. Top-matched comps best support the ARV.
Projected returns pro-forma
-3.0% appreciation · 8.0% rent growth · sell at horizon
- IRR
- -8.9%
- Equity multiple
- 0.66×
- Total profit
- $-16,622
- Equity at exit
- $26,004
- IRR
- 5.6%
- Equity multiple
- 1.49×
- Total profit
- $23,974
- Equity at exit
- $15,079
Cash invested: $48,832 (down + closing). Projections, not guarantees.
Landlord ↔ Tenant lean methodology
- Overall (STATE)
- 15 Strongly Tenant-Friendly
- State New York
- 15 Strongly Tenant-Friendly · D+10
- County
- — inherits STATE
- City
- — inherits STATE
ZIP-level market 14207
- Home prices YoY
- -18.9%
- Rents YoY
- 8.2%
- Active inventory
- 199
- Price-to-rent
- 10.6×
Monthly cashflow live
- Estimated rent
- $1,376 high interval (Pro) →
- Mortgage (P&I)
- −$915
- Tax from tax record
- −$29 /mo · $353/yr
- Insurance
- −$73
- HOA
- −$0
- Vacancy / Maint / Mgmt
- −$289
- Net cashflow
- $70
Break-even live
Sensitivity live
| Price | -10% $169 | -5% $119 | +0% $70 | +5% $-179 | +10% $-239 |
|---|---|---|---|---|---|
| Rent | -10% $-39 | -5% $16 | +0% $70 | +5% $124 | +10% $179 |
| Rate | -1.0pp $158 | -0.5pp $114 | base $70 | +0.5pp $25 | +1.0pp $-21 |
UW: 25.0% down · 7.5% · 30yr · 1.5% tax · 5.0% vac · 8.0% maint · 8.0% mgmt
Financing live
Cash to close
- Down payment
- $43,600
- Closing costs
- $5,232
- Reserves months
- —
- Total cash needed
- —
Loan-product check · same deal, 3 products live
Conventional
25% down · 7.5% · 30yr
- Down + closing
- —
- Monthly P&I
- —
- Monthly cashflow
- —
- DSCR
- —
- Eligible?
- —
Personal DTI + credit; lowest rate.
DSCR
20% down · 8.5% · 30yr
- Down + closing
- —
- Monthly P&I
- —
- Monthly cashflow
- —
- DSCR
- —
- Eligible?
- —
No personal income docs; deal must DSCR.
Hard money
10% down · 12.0% · 12mo
- Down + closing
- —
- Monthly P&I
- —
- Monthly cashflow
- —
- DSCR
- —
- Eligible?
- —
Short-term bridge; refi at stabilization.
Rent comps 10 comps
| Address | Beds | Baths | Sqft | Rent | $/sqft | DOM | Units | Dist |
|---|---|---|---|---|---|---|---|---|
| 118 Rano St Buffalo, NY | 3.0 | 1.0 | 1050 | $1,200 | $1.14 | 23d | 1 | 0.12mi |
| 158 Chadduck Ave Buffalo, NY | 4.0 | 1.0 | 1200 | $1,250 | $1.04 | 25d | 1 | 0.52mi |
| 61 Baxter St Buffalo, NY | 3.0 | 1.0 | 2014 | $1,400 | $0.70 | 0d | 1 | 0.71mi |
| 509 Hinman Ave Unit Upper Buffalo, NY | 3.0 | 1.0 | 1600 | $1,325 | $0.83 | 0d | 1 | 0.83mi |
| 78 Germain St Buffalo, NY | 3.0 | 1.0 | 2030 | $1,300 | $0.64 | 16d | 1 | 0.89mi |
| 62 Germain St Buffalo, NY | 3.0 | 1.0 | 1320 | $1,250 | $0.95 | 25d | 1 | 0.92mi |
| 52 Greeley St Unit Upper Buffalo, NY | 2.0 | 1.0 | 1804 | $1,000 | $0.55 | 25d | 1 | 0.93mi |
| 62 Seabrook St Buffalo, NY | 4.0 | 1.0 | 1300 | $2,000 | $1.54 | 3d | 1 | 1.04mi |
| 293 Grote St Buffalo, NY | 1.0–2.0 | 1.0–2.0 | 817 | $2,345 | $2.87 | 0d | 1 | 1.16mi |
| 139 Fordham Dr Buffalo, NY | 3.0 | 1.0 | 1453 | $1,700 | $1.17 | 25d | 1 | 1.37mi |
Listing history 5 events
-
2026-05-05status Pending 933-char remark
Show marketing remark (933 chars)
Welcome to 65 Hunt Avenue, a well-maintained single-family home located in the City of Buffalo. This property offers 4 bedrooms and 1.5 bathrooms, providing a spacious and functional layout suitable for both owner-occupants and investors. The home is currently rented for $1,260 per month, offering immediate income potential. Features include solid mechanics, a full basement, and a full attic, providing ample storage and future flexibility. Additional highlights include a detached garage, first-floor laundry, and vinyl flooring throughout for easy maintenance. Conveniently located near public transportation, shopping, and everyday amenities, this property presents a strong opportunity for those seeking a reliable investment or a future primary residence. Don’t miss your chance to own this versatile Buffalo home. Seller will provide the existing survey with an affidavit of no change and a 40-year search on the note.
-
2026-02-21price $174,400 933-char remark
Show marketing remark (933 chars)
Welcome to 65 Hunt Avenue, a well-maintained single-family home located in the City of Buffalo. This property offers 4 bedrooms and 1.5 bathrooms, providing a spacious and functional layout suitable for both owner-occupants and investors. The home is currently rented for $1,260 per month, offering immediate income potential. Features include solid mechanics, a full basement, and a full attic, providing ample storage and future flexibility. Additional highlights include a detached garage, first-floor laundry, and vinyl flooring throughout for easy maintenance. Conveniently located near public transportation, shopping, and everyday amenities, this property presents a strong opportunity for those seeking a reliable investment or a future primary residence. Don’t miss your chance to own this versatile Buffalo home. Seller will provide the existing survey with an affidavit of no change and a 40-year search on the note.
-
2026-01-21$174,900 Active 933-char remark
Show marketing remark (933 chars)
Welcome to 65 Hunt Avenue, a well-maintained single-family home located in the City of Buffalo. This property offers 4 bedrooms and 1.5 bathrooms, providing a spacious and functional layout suitable for both owner-occupants and investors. The home is currently rented for $1,260 per month, offering immediate income potential. Features include solid mechanics, a full basement, and a full attic, providing ample storage and future flexibility. Additional highlights include a detached garage, first-floor laundry, and vinyl flooring throughout for easy maintenance. Conveniently located near public transportation, shopping, and everyday amenities, this property presents a strong opportunity for those seeking a reliable investment or a future primary residence. Don’t miss your chance to own this versatile Buffalo home. Seller will provide the existing survey with an affidavit of no change and a 40-year search on the note.
-
2012-05-07soldstatus $20,300 511-char remark
Show marketing remark (511 chars)
Convenient location. Spacious living spaces include a large master bedroom with separate sitting area. The attic has two additional finished rooms and theres a first floor laundry. This property has some good updates but does need repairs and redecorating, Huge garage with additional storage or workshop area. Property is sold AS IS. All information is approximate. No search or survey provided. Deed restriction. See MLS attachment for additional property information, setting up showings and making an offer.
-
2012-03-18$20,000 511-char remark
Show marketing remark (511 chars)
Convenient location. Spacious living spaces include a large master bedroom with separate sitting area. The attic has two additional finished rooms and theres a first floor laundry. This property has some good updates but does need repairs and redecorating, Huge garage with additional storage or workshop area. Property is sold AS IS. All information is approximate. No search or survey provided. Deed restriction. See MLS attachment for additional property information, setting up showings and making an offer.
ⓘ Source: listings_history table (triggers on properties + properties_extension) + one-shot
backfill from property_details.listing_events for pre-trigger history.
Tax reassessment forecast NY · Partial reset (capped growth)
- Current annual tax
- $353 · $29/mo
- Projected year-2 tax
- $1,650 · $138/mo
- Expected delta
- +$1,297/yr (+$108/mo · 367.4%)
ⓘ Screening estimate from a state-policy table — verify with the county assessor before closing.
Climate risk First Street
- Flood 1/10 Low FEMA zone X (unshaded) · 0% chance over 30 yrs
- Wildfire 1/10 Low
- Heat 3/10 Moderate 7 d/yr ≥93°F today · 15 d/yr by 30 yrs out
- Wind 1/10 Low
- Air quality 4/10 Moderate 4 unhealthy d/yr today · 9 by 30 yrs out
Nearby sold comps map
Loading sold comps map…
Walkable amenities ~0.75 mi
Loading nearby amenities…
Taxation est. · year 1
- Rental income
- $16,507
- − Mortgage interest
- −$9,769
- − Property taxes
- −$353
- − Insurance
- −$872
- − Repairs & maintenance
- −$1,321
- − Management
- −$1,321
- − Depreciation
- −$5,073
- Taxable loss
- −$2,201
- Est. tax savings @ 24.0%
- +$528
- After-tax cash flow
- $1,369/yr
For passive investors: Depreciation is non-cash, so a rental often shows a tax loss while cash-flowing — sheltering income. Rental losses are passive: they offset passive income freely, and up to $25,000/yr can offset ordinary (W-2) income if you actively participate and your MAGI is under $100k (phasing out to $0 by $150k); unused losses carry forward. On sale, claimed depreciation is recaptured at up to 25%, and gains may owe capital-gains tax (a 1031 exchange can defer both). Figures are a year-1 estimate at your 24.0% rate — not tax advice; consult a CPA.
Schools (NCES district)
- District
- Buffalo City School District
- NCES district ID
- 3605850
- Math proficiency
- 41% ▲ 11.00%
- Reading proficiency
- 40% ▲ 7.00%
- Median HH income
- $31,665
- Composite
- 33.17/100
- National rank
- #5544
- State rank
- #535 of 590 in NY
Livability — Buffalo
- Score
- 77/100
- State rank
- #195
- US rank
- #3011
Category grades
Schools grade is shown separately in the Schools card above.
Census & demographics
- Census place
- Buffalo, NY
- County
- Erie County · 714,559 people
- City population
- 440,021
- Metro
- Buffalo-Cheektowaga, NY
- Population (ZIP)
- 26,327
- Household income
- $39,753
- Rent vs Own
- Severe rent burden
- 2177.0
Population outlook (Erie County) Hauer SSP2
- Today (2025)
- 933,037 people
- By 2030
- 935,181 · +0.2%
- By 2040
- 928,531 · -0.5%
- By 2050
- 905,725 · -2.9%
- By 2075
- 834,037 · -10.6%
- By 2100
- 708,033 · -24.1%
Race, ethnicity, and origin ACS 2023
- Neighborhood character
- Highly diverse neighborhood (Simpson 0.74)
- Race & ethnicity
- White 40% Hispanic / Latino 23% Black 16% Asian 15% Two or more races 14%
- Hispanic origin (detail)
- Puerto Rican 18% Dominican 2%
- Common ancestry
- Romanian 8% Portuguese 1% Arab 1%
- Foreign-born
- 19% · Philippines, Canada, India
- Languages at home
- 65% English-only · Spanish 14% Other Asian/Pacific 10% Other Indo-European 5%
Political lean MEDSL · Erie
- 2024 margin
- Lean D (+9.7) · D 54.8% · R 45.2%
- 2008→2024 swing
- -7.9pp toward R · 2008: 17.5pp · 2024: 9.7pp
- All cycles
- 2024: D+9.7 2020: D+14.7 2016: D+4.8 2012: D+15.6 2008: D+17.5
Not yet ingested
- Civics
- —
Market trends
- HPI YoY
- ▼ -54.42%
- Current HPI
- 233.0902
- Rent YoY
- ▲ 8.19%
- Metro
- Buffalo-Cheektowaga, NY
- State GDP YoY
- ▲ 2.60%
- F500 in state
- 92
Industry mix (Fortune 500 HQ in NY)
| Industry | F500 HQs | Revenue |
|---|---|---|
| Financial Services | 10 | $950B |
|
||
| Consumer Goods | 9 | $162B |
|
||
| Insurance | 4 | $225B |
|
||
| Telecommunications | 2 | $144B |
|
||
| Pharmaceuticals | 2 | $112B |
|
||
| Media / Entertainment | 2 | $69B |
|
||
Price history
+772.0% since first listed5 events — show timeline
- 2026-05-05 Pending — WNYREIS
- 2026-02-21 Price Changed $174,400 WNYREIS
- 2026-01-21 Listed $174,900 WNYREIS
- 2012-05-07 Sold (MLS) $20,300 WNYREIS
- 2012-03-18 Listed $20,000 WNYREIS
Property tax history
+2.6%/yrLatest (2025): $353 · +0.0% YoY. Source: county tax records.
Cash-flow waterfall
monthlySold comps — $/sqft
last 12 mo · ≤1 miLoading sold comps…