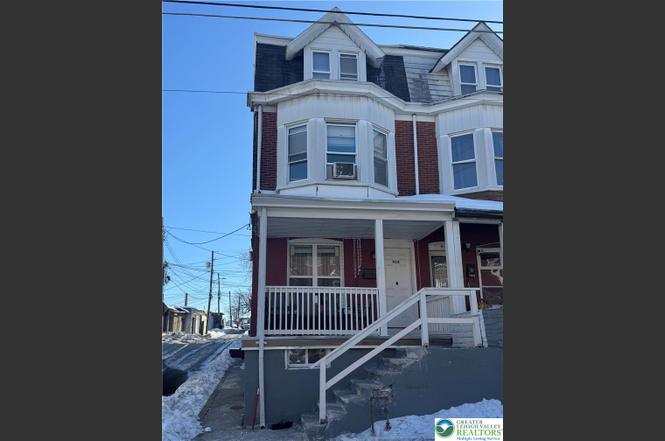
414 W Washington St · Allentown, PA
Flood risk 1/10 · Minimal
- FEMA flood zone
- X (unshaded)
- Chance of flooding over 30 yrs
- 0.0%
- Est. flood insurance / yr
- $473 – $860
Fire risk 1/10 · Minimal
- Est. fire insurance / yr
- $511 – $949
Heat risk 5/10 · Moderate
- Hot days now (above 100°F)
- 7 days/yr
- Hot days in 30 yrs
- 15 days/yr
Wind risk 4/10 · Minor
- Chance of severe wind over 30 yrs
- 16.0%
Air-quality risk 3/10 · Minor
- Unhealthy air days now
- 3 days/yr
- Unhealthy air days in 30 yrs
- 4 days/yr
Risk factors via First Street. Map © Google.
Why this score? — see what drove the C- grade
The composite is a weighted blend of 9 inputs, each scored 0–100. Each bar is that input's sub-score; the figure is the points it added to the 100-point composite (weight × sub-score).
- Cash flow +16.1/30.0
- ARV discount +15.0/15.0
- DSCR +5.0/10.0
- Livability +4.0/5.0
- Rent growth +3.9/5.0
- 1% rule +3.6/10.0
- Condition / age +2.5/5.0
- Schools +1.2/10.0
- Appreciation +0.0/10.0
$249,900
🖨 Deal sheet (PDF) 📄 Offer letter ✓ Due diligence
Listing remarks MLS
Why rent when you can own this beauty, moving ready 4 bed and 2 1/2 bath with finish basement. Don't miss this opportunity to own it, low taxes and maintenance. Seller will provide with clear CO from the city. Most see make your appointment today before is GONE.
Key facts
- Second kitchen
- Bonus room
- Finished basement
Tags
Neighborhood map
What this means for you Summary
Snapshot
- This is a 5-bed/1.5-bath single-family listed at $250k.
Deal economics
- At list price, monthly cash flow is $129 ($2k/yr) — positive.
- The deal already cash-flows at list — no discount required.
- To meet the 1% rule (rent ≥ 1% of price), the offer needs to be $216k (13.6% below list).
- Recommended offer: $216k (13.6% below list) — sets the bar for 1% rule.
- Cap rate 6.9% vs local median 5.3% in Allentown — top-decile yield for the area; either an underpriced asset or a hidden risk that comps aren't pricing in. Stress-test before assuming the spread holds.
Location & tenants
- Location reads 81/100 on livability (#171 in PA, #1,440 nationally) — a professional / high-income tenant draw. Strengths: commute A+, cost of living A+, housing A+; Watch: employment D.
- Allentown City SD (urban): math 10% / reading 20% proficiency, ranked #513 of 539 in PA (top 95%) — low school quality limits family demand, transient renter base, plan for 1-2y turnover; 73% free/reduced lunch — lower-income household profile, screen leases tightly.
- Zoned schools: Sheridan El Sch (math 2%, 560 students, 100% FRL); Trexler Ms (math 2% / reading 24%, grade F, #484 of 512 statewide, top 95%, 820 students, 100% FRL); William Allen Hs (math 29% / reading 10%, grade F, #392 of 437 statewide, top 90%, 2,852 students, 87% FRL) — zoned schools average 96% FRL vs 73% district-wide (23 pts higher); higher-poverty schools than district average — tighter screening recommended.
- Market conditions: Rents rising fast (+5.5%/yr); 170 active listings in the ZIP; 30 comparable units currently listed for rent nearby; rentals at typical pace (median 22d on market — plan ~3-4 weeks tenant-placement turnaround); lower-income renter base — watch delinquency; 765 units permitted in Lehigh County in 2024 (286 in 5+ unit buildings).
- At $2,160/mo this rent would consume 60% of the median local household income ($43k/yr) (locally 4313% of renters already pay >50% of income on rent) — very limited rent-growth headroom before tenants either downsize or default.
Forward outlook
- Local home prices are declining (-3.0%/yr); year-one equity from $2k of loan paydown is wiped out by about $7k of value loss. Plan a longer hold.
- Lehigh County population projected at +21% by 2050 — long-run rental-demand tailwind backs the buy-and-hold thesis.
Negotiation context
- It's been on market 58 days — a 3% lower offer ($242k) is reasonable based on typical stale-listing flexibility.
- 7 sale attempts since 19y ago with the ask held roughly flat each time — persistent listings suggest the price (not the market) is what's stuck; bring a comps-based counter.
- Current owner paid $180k; 39% above their basis — modest negotiation headroom, anchor on the comps not their cost.
Risks & watch-outs
- Watch-outs: built in 1913 — expect roof / HVAC / electrical / plumbing capex.
- Climate carrying-cost: extreme-heat days projected 7→15/yr by 2055 (HVAC capex compounding) — expect insurance premiums to compound above CPI over the hold.
Questions for the listing agent
- It's been on market 58 days. Have you received any prior offers? Is the seller open to a 14% concession, seller financing, or rate buy-down credit?
- Built in 1913 — when were the roof, HVAC, electrical panel, plumbing, and water heater last replaced?
- Is there a deadline driving the sale (1031 exchange, divorce, estate, relocation)? That informs how much negotiation room exists.
- Schools are D-rated, which usually means shorter tenancies and higher turnover. Who's the typical renter profile here, and what's been the actual vacancy rate?
- What's the average days-on-market for RENTAL listings here right now (not sales)? A rising rental-DOM trend means longer vacancies and softer asking-rent achievability than the comps imply.
- What's the recent tenant-quality profile in this submarket — average credit score on applications, eviction rate, late-payment / NSF rate, and stable-employment percentage? A property-management company in the area should have these aggregated.
- How much new for-sale + rental construction is in the pipeline within 1–3 miles? Heavy new supply typically softens prices + rents 12–24 months out; constrained supply supports both.
Investment metrics
- 1% rule
- 0.86% ✗
- Cap rate
- 6.91%
- Cash-on-cash
- 2.22%
- DSCR
- 1.10
- GRM
- 9.6
CMA / ARV
- ARV (on-the-fly)
- $385,520
- Comps found
- 2
Show comp detail 2 sales within ~0.75 mi
| Address | Dist | Beds/Ba | Sqft | Sold | Price | $/sf | Match |
|---|---|---|---|---|---|---|---|
| 133 Oakwood Dr | 0.53mi | 4/2.5 (-1) | 1,680 (+6%) | 10mo | $410,000 | $244 | 48 |
| 1051 N 10th St | 0.73mi | 4/1.5 (-1) | 1,712 (+8%) | 1mo | $385,000 | $225 | 46 |
Match score weights: distance 35% · size 25% · config 20% · recency 20%. Top-matched comps best support the ARV.
Projected returns pro-forma
-3.0% appreciation · 5.48% rent growth · sell at horizon
- IRR
- -10.3%
- Equity multiple
- 0.62×
- Total profit
- $-26,803
- Equity at exit
- $37,261
- IRR
- 2.0%
- Equity multiple
- 1.16×
- Total profit
- $10,857
- Equity at exit
- $21,607
Cash invested: $69,972 (down + closing). Projections, not guarantees.
Landlord ↔ Tenant lean methodology
- Overall (STATE)
- 62 Landlord-Friendly
- State Pennsylvania
- 62 Landlord-Friendly · EVEN
- County
- — inherits STATE
- City
- — inherits STATE
ZIP-level market 18102
- Rents YoY
- 5.5%
- Active inventory
- 170
- Price-to-rent
- 9.6×
Monthly cashflow live
- Estimated rent
- $2,160 high interval (Pro) →
- Mortgage (P&I)
- −$1,311
- Tax from tax record
- −$162 /mo · $1,948/yr
- Insurance
- −$104
- HOA
- −$0
- Lot rent
- −$0
- Vacancy / Maint / Mgmt
- −$454
- Net cashflow
- $129
Break-even live
Sensitivity live
| Price | -10% $271 | -5% $200 | +0% $129 | +5% $58 | +10% $-12 |
|---|---|---|---|---|---|
| Rent | -10% $-41 | -5% $44 | +0% $129 | +5% $215 | +10% $300 |
| Rate | -1.0pp $255 | -0.5pp $193 | base $129 | +0.5pp $64 | +1.0pp $-1 |
UW: 25.0% down · 7.5% · 30yr · 1.5% tax · 5.0% vac · 8.0% maint · 8.0% mgmt
Financing live
Cash to close
- Down payment
- $62,475
- Closing costs
- $7,497
- Reserves months
- —
- Total cash needed
- —
Loan-product check · same deal, 3 products live
Conventional
25% down · 7.5% · 30yr
- Down + closing
- —
- Monthly P&I
- —
- Monthly cashflow
- —
- DSCR
- —
- Eligible?
- —
Personal DTI + credit; lowest rate.
DSCR
20% down · 8.5% · 30yr
- Down + closing
- —
- Monthly P&I
- —
- Monthly cashflow
- —
- DSCR
- —
- Eligible?
- —
No personal income docs; deal must DSCR.
Hard money
10% down · 12.0% · 12mo
- Down + closing
- —
- Monthly P&I
- —
- Monthly cashflow
- —
- DSCR
- —
- Eligible?
- —
Short-term bridge; refi at stabilization.
Rent comps 30 comps
| Address | Beds | Baths | Sqft | Rent | $/sqft | DOM | Units | Dist |
|---|---|---|---|---|---|---|---|---|
| 535 Tilghman St Unit 2ND Allentown, PA | 4.0 | 2.0 | 1500 | $1,750 | $1.17 | 5d | 1 | 0.21mi |
| 913 N 6th St Allentown, PA | 4.0 | 1.0 | 1476 | $1,698 | $1.15 | 16d | 1 | 0.26mi |
| 1304 N 4th St Allentown, PA | 5.0 | 2.0 | 1891 | $2,900 | $1.53 | 46d | 1 | 0.29mi |
| 622 Park St Allentown, PA | 5.0 | 1.5 | 1638 | $2,300 | $1.40 | 5d | 1 | 0.33mi |
| 631 W Allen St Allentown, PA | 5.0 | 1.5 | 1695 | $2,100 | $1.24 | 46d | 1 | 0.36mi |
| 432 N Law St Allentown, PA | 4.0 | 1.0 | 1328 | $1,500 | $1.13 | 16d | 1 | 0.39mi |
| 738 W Cedar St Allentown, PA | 5.0 | 1.5 | 1900 | $2,500 | $1.32 | 46d | 1 | 0.41mi |
| 164 W Tilghman St Allentown, PA | 5.0 | 2.0 | 1801 | $2,250 | $1.25 | 25d | 1 | 0.43mi |
| 856 N 8th St Allentown, PA | 5.0 | 1.5 | 1499 | $1,975 | $1.32 | 21d | 1 | 0.46mi |
| 814 Washington St #2 Allentown, PA | 4.0 | 1.0 | 1200 | $1,600 | $1.33 | 5d | 1 | 0.47mi |
| 823 W Washington St Allentown, PA | 4.0 | 1.0 | 1400 | $1,950 | $1.39 | 16d | 1 | 0.50mi |
| 630 N Front St Allentown, PA | 4.0 | 1.0 | 1912 | $1,900 | $0.99 | 25d | 1 | 0.57mi |
| 213 Chew St Allentown, PA | 5.0 | 1.0 | 1725 | $2,100 | $1.22 | 46d | 1 | 0.58mi |
| 1111 Fullerton Ave Allentown, PA | 5.0 | 1.5 | 1670 | $2,200 | $1.32 | 46d | 1 | 0.60mi |
| 389 W Turner St Allentown, PA | 4.0 | 1.5 | 2144 | $2,400 | $1.12 | 5d | 1 | 0.60mi |
| 828 W Gordon St Allentown, PA | 4.0 | 2.5 | 1628 | $2,250 | $1.38 | 5d | 1 | 0.65mi |
| 208 Ridge Ave Allentown, PA | 4.0 | 1.0 | 1396 | $1,700 | $1.22 | 25d | 1 | 0.73mi |
| 208 Ridge Ave Allentown, PA | 4.0 | 1.0 | 1396 | $1,600 | $1.15 | 5d | 1 | 0.73mi |
| 626 N 11th St Allentown, PA | 4.0 | 1.5 | 1642 | $2,200 | $1.34 | 5d | 1 | 0.81mi |
| 111 Ridge Ave Allentown, PA | 4.0 | 1.0 | 1658 | $1,650 | $1.00 | 46d | 1 | 0.82mi |
| 948 W Maple St Allentown, PA | 4.0 | 1.0 | 1932 | $2,300 | $1.19 | 46d | 1 | 1.09mi |
| 1338 W Liberty St Allentown, PA | 4.0 | 1.0 | 1526 | $2,000 | $1.31 | 16d | 1 | 1.14mi |
| 1348 W Liberty St Allentown, PA | 5.0 | 1.0 | 1561 | $1,900 | $1.22 | 25d | 1 | 1.16mi |
| 1341 Chew St Allentown, PA | 5.0 | 1.5 | 2139 | $2,500 | $1.17 | 23d | 1 | 1.21mi |
| 450 Hanover Ave Allentown, PA | 5.0 | 1.0 | 1692 | $2,200 | $1.30 | 25d | 1 | 1.23mi |
| 1455 W Tilghman St Allentown, PA | 4.0 | 1.5 | 1520 | $1,850 | $1.22 | 46d | 1 | 1.24mi |
| 36 S Jefferson St Allentown, PA | 5.0 | 1.5 | 2128 | $2,500 | $1.17 | 16d | 1 | 1.31mi |
| 144 S 12th St Allentown, PA | 4.0 | 2.0 | 1242 | $2,000 | $1.61 | 5d | 1 | 1.35mi |
| 1538 Chew St Allentown, PA | 5.0 | 1.0 | 1874 | $2,800 | $1.49 | 21d | 1 | 1.43mi |
| 41 S Franklin St Allentown, PA | 5.0 | 2.0 | 1897 | $2,500 | $1.32 | 16d | 1 | 1.48mi |
Listing history 26 events
-
2026-06-07statusdays on market $249,900 Pending 58 DOM
-
2026-06-03days on market $249,900 Active 56 DOM
-
2026-06-02days on market $249,900 Active 55 DOM
-
2026-06-01days on market $249,900 Active 54 DOM
-
2026-05-31days on market $249,900 Active 53 DOM
-
2026-05-31days on market $249,900 Active 52 DOM
-
2026-04-01status Pending
-
2026-02-10$249,900 Active
-
2021-09-17soldstatus $180,250
-
2021-09-15soldstatus $180,000 Sold 262-char remark
Show marketing remark (262 chars)
Why rent when you can own this beauty, moving ready 4 bed and 2 1/2 bath with finish basement. Don't miss this opportunity to own it, low taxes and maintenance. Seller will provide with clear CO from the city. Most see make your appointment today before is GONE.
-
2021-07-26status Pending 262-char remark
Show marketing remark (262 chars)
Why rent when you can own this beauty, moving ready 4 bed and 2 1/2 bath with finish basement. Don't miss this opportunity to own it, low taxes and maintenance. Seller will provide with clear CO from the city. Most see make your appointment today before is GONE.
-
2021-07-19$170,000 Active 262-char remark
Show marketing remark (262 chars)
Why rent when you can own this beauty, moving ready 4 bed and 2 1/2 bath with finish basement. Don't miss this opportunity to own it, low taxes and maintenance. Seller will provide with clear CO from the city. Most see make your appointment today before is GONE.
-
2020-01-07soldstatus $108,000
-
2019-12-30soldstatus $108,000 Sold 493-char remark
Show marketing remark (493 chars)
Terrific 4 BR 1.5 bath end of row townhome in Allentown. Home has been completely remodeled throughout with an open concept on the first floor with new laminate floors and a modern kitchen with granite countertops and stainless steel appliances. Additionally, home offers new windows throughout, modern baths, new wall to wall carpeting on 2nd and 3rd floors, and gas heat. Also notably, this home has extremely low taxes, currently less than $800 per year. This home is a definite MUST SEE!!!
-
2019-12-11status Pending 493-char remark
Show marketing remark (493 chars)
Terrific 4 BR 1.5 bath end of row townhome in Allentown. Home has been completely remodeled throughout with an open concept on the first floor with new laminate floors and a modern kitchen with granite countertops and stainless steel appliances. Additionally, home offers new windows throughout, modern baths, new wall to wall carpeting on 2nd and 3rd floors, and gas heat. Also notably, this home has extremely low taxes, currently less than $800 per year. This home is a definite MUST SEE!!!
-
2019-11-19$114,900 Active 493-char remark
Show marketing remark (493 chars)
Terrific 4 BR 1.5 bath end of row townhome in Allentown. Home has been completely remodeled throughout with an open concept on the first floor with new laminate floors and a modern kitchen with granite countertops and stainless steel appliances. Additionally, home offers new windows throughout, modern baths, new wall to wall carpeting on 2nd and 3rd floors, and gas heat. Also notably, this home has extremely low taxes, currently less than $800 per year. This home is a definite MUST SEE!!!
-
2009-01-01historical
-
2008-11-11$89,900
-
2008-08-27historical
-
2008-08-27historical
-
2008-05-19$99,900
-
2008-05-17$99,900
-
2007-10-26soldstatus $70,000
-
2007-10-10soldstatus $70,000
-
2007-09-15$90,000
-
1992-08-01soldstatus $53,000
ⓘ Source: listings_history table (triggers on properties + properties_extension) + one-shot
backfill from property_details.listing_events for pre-trigger history.
Tax reassessment forecast PA · Partial reset (capped growth)
- Current annual tax
- $1,948 · $162/mo
- Projected year-2 tax
- $2,948 · $246/mo
- Expected delta
- +$1,000/yr (+$83/mo · 51.4%)
ⓘ Screening estimate from a state-policy table — verify with the county assessor before closing.
Climate risk First Street
- Flood 1/10 Low FEMA zone X (unshaded) · 0% chance over 30 yrs
- Wildfire 1/10 Low
- Heat 5/10 Major 7 d/yr ≥100°F today · 15 d/yr by 30 yrs out
- Wind 4/10 Moderate 16% chance of damaging wind over 30 yrs
- Air quality 3/10 Moderate 3 unhealthy d/yr today · 4 by 30 yrs out
Nearby sold comps map
Loading sold comps map…
Walkable amenities ~0.75 mi
Loading nearby amenities…
Taxation est. · year 1
- Rental income
- $25,916
- − Mortgage interest
- −$13,998
- − Property taxes
- −$1,948
- − Insurance
- −$1,250
- − Repairs & maintenance
- −$2,073
- − Management
- −$2,073
- − Depreciation
- −$7,270
- Taxable loss
- −$2,696
- Est. tax savings @ 24.0%
- +$647
- After-tax cash flow
- $2,197/yr
For passive investors: Depreciation is non-cash, so a rental often shows a tax loss while cash-flowing — sheltering income. Rental losses are passive: they offset passive income freely, and up to $25,000/yr can offset ordinary (W-2) income if you actively participate and your MAGI is under $100k (phasing out to $0 by $150k); unused losses carry forward. On sale, claimed depreciation is recaptured at up to 25%, and gains may owe capital-gains tax (a 1031 exchange can defer both). Figures are a year-1 estimate at your 24.0% rate — not tax advice; consult a CPA.
Schools (NCES district)
- District
- Allentown City SD
- NCES district ID
- 4202280
- Math proficiency
- 10% ▼ -10.00%
- Reading proficiency
- 20% ▼ -15.00%
- Median HH income
- $36,337
- Composite
- 12.43/100
- National rank
- #9630
- State rank
- #513 of 539 in PA
Livability — Allentown
- Score
- 81/100
- State rank
- #171
- US rank
- #1440
Category grades
Schools grade is shown separately in the Schools card above.
Census & demographics
- Census place
- Allentown, PA
- County
- Lehigh County · 333,019 people
- City population
- 172,996
- Metro
- Allentown-Bethlehem-Easton, PA-NJ
- Population (ZIP)
- 51,001
- Household income
- $43,085
- Rent vs Own
- Severe rent burden
- 4313.0
Population outlook (Lehigh County) Hauer SSP2
- Today (2025)
- 392,957 people
- By 2030
- 408,319 · +3.9%
- By 2040
- 440,007 · +12.0%
- By 2050
- 475,940 · +21.1%
- By 2075
- 590,448 · +50.3%
- By 2100
- 690,314 · +75.7%
Race, ethnicity, and origin ACS 2023
- Neighborhood character
- Predominantly Hispanic (69%)
- Race & ethnicity
- Hispanic / Latino 69% Two or more races 28% White 18% Black 10%
- Hispanic origin (detail)
- Mexican 3% Puerto Rican 38% Dominican 22%
- Common ancestry
- Polish 1% Romanian 1% Hispanic 1%
- Foreign-born
- 22% · Canada, Jamaica
- Languages at home
- 45% English-only · Spanish 52% Arabic 2%
Political lean MEDSL · Lehigh
- 2024 margin
- Toss-up / Even · D 50.7% · R 48.0% · Other 1.2%
- 2008→2024 swing
- -12.9pp toward R · 2008: 15.6pp · 2024: 2.7pp
- All cycles
- 2024: D+2.7 2020: D+7.6 2016: D+4.4 2012: D+7.5 2008: D+15.6
Not yet ingested
- Civics
- —
Market trends
- HPI YoY
- ▼ -227.01%
- Current HPI
- 404.834
- Rent YoY
- ▲ 5.48%
- Metro
- Allentown-Bethlehem-Easton, PA-NJ
- State GDP YoY
- ▲ 1.68%
- F500 in state
- 34
Industry mix (Fortune 500 HQ in PA)
| Industry | F500 HQs | Revenue |
|---|---|---|
| Healthcare | 2 | $309B |
|
||
| Insurance | 2 | $27B |
|
||
| Telecommunications / Media | 1 | $124B |
|
||
| Industrial Distribution | 1 | $22B |
|
||
| Financial Services | 1 | $20B |
|
||
| Chemicals / Materials | 1 | $18B |
|
||
Price history
+371.5% since first listed20 events — show timeline
- 2026-04-01 Pending — GLVRMLS
- 2026-02-10 Listed $249,900 GLVRMLS
- 2021-09-17 Sold (Public Records) $180,250 Public Records
- 2021-09-15 Sold (MLS) $180,000 GLVRMLS
- 2021-07-26 Pending — GLVRMLS
- 2021-07-19 Listed $170,000 GLVRMLS
- 2020-01-07 Sold (Public Records) $108,000 Public Records
- 2019-12-30 Sold (MLS) $108,000 GLVRMLS
- 2019-12-11 Pending — GLVRMLS
- 2019-11-19 Listed $114,900 GLVRMLS
- 2009-01-01 Listing Removed — GLVRMLS
- 2008-11-11 Listed $89,900 GLVRMLS
- 2008-08-27 Listing Removed — GLVRMLS
- 2008-08-27 Listing Removed — GLVRMLS
- 2008-05-19 Listed $99,900 GLVRMLS
- 2008-05-17 Listed $99,900 GLVRMLS
- 2007-10-26 Sold (MLS) $70,000 GLVRMLS
- 2007-10-10 Sold (Public Records) $70,000 Public Records
- 2007-09-15 Listed $90,000 GLVRMLS
- 1992-08-01 Sold (Public Records) $53,000 Public Records
Property tax history
-2.0%/yrLatest (2026): $1,948 · +0.7% YoY. Source: county tax records.
Cash-flow waterfall
monthlySold comps — $/sqft
last 12 mo · ≤1 miLoading sold comps…