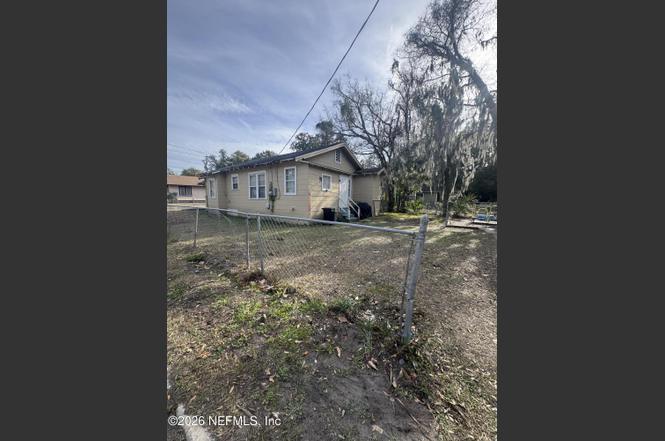
3842 Boulevard · Jacksonville, FL
Flood risk 1/10 · Minimal
- FEMA flood zone
- X (unshaded)
- Chance of flooding over 30 yrs
- 0.0%
- Est. flood insurance / yr
- $507 – $1,088
Fire risk 1/10 · Minimal
- Est. fire insurance / yr
- $947 – $1,759
Heat risk 9/10 · Severe
- Hot days now (above 107°F)
- 7 days/yr
- Hot days in 30 yrs
- 20 days/yr
Wind risk 9/10 · Severe
- Chance of severe wind over 30 yrs
- 99.0%
Air-quality risk 4/10 · Minor
- Unhealthy air days now
- 6 days/yr
- Unhealthy air days in 30 yrs
- 6 days/yr
Risk factors via First Street. Map © Google.
Why this score? — see what drove the C- grade
The composite is a weighted blend of 9 inputs, each scored 0–100. Each bar is that input's sub-score; the figure is the points it added to the 100-point composite (weight × sub-score).
- Cash flow +24.0/30.0
- DSCR +7.7/10.0
- 1% rule +5.7/10.0
- ARV discount +4.2/15.0
- Livability +4.2/5.0
- Schools +3.9/10.0
- Rent growth +2.7/5.0
- Condition / age +2.5/5.0
- Appreciation +0.0/10.0
$99,999
🖨 Deal sheet (PDF) 📄 Offer letter ✓ Due diligence
Listing remarks MLS
PRICE REDUCTION...INVESTOR ALERT!! Bring ALL OFFERS... Clean 2 bedroom 1 bath Home with fireplace. Bathroom looks updated. Beautiful old hardwood floors. Sold “as-is” without repairs or warranty. Seller has no knowledge of the property history, no disclosures supplied.
Key facts
- 4,791 sq ft lot
- Built 1924
- Listed 148 days
Property features AI
Exterior
- Parking: On-street parking
- Utilities: Public sewer; Electricity connected; Water connected
- Home design: Single family residence; Used as an investment property
- Exterior features: Lot size approximately 0.11 acres; No private pool
Interior
- Kitchen: Electric oven; Refrigerator
- Bedrooms: 2 bedrooms
- Bathrooms: 1 full bathroom
- Heating & cooling: Central heating; Central air
- Interior features: Central heating; Central air
- Laundry & utility: Electric water heater
Neighborhood map
What this means for you Summary
Snapshot
- This is a 2-bed/1.0-bath single-family listed at $100k.
Deal economics
- At list price, monthly cash flow is $196 ($2k/yr) — positive.
- The deal already cash-flows at list — no discount required.
- Meets the 1% rule at list price ($1k rent vs $100k).
- Recommended offer: $88k (12.0% below list) — sets the bar for market timing.
- Cap rate 8.6% vs local median 3.9% in Jacksonville — top-decile yield for the area; either an underpriced asset or a hidden risk that comps aren't pricing in. Stress-test before assuming the spread holds.
Location & tenants
- Location reads 83/100 on livability (#50 in FL, #911 nationally) — a professional / high-income tenant draw. Strengths: amenities A+, commute A+, housing A+.
- Duval (urban): math 46% / reading 45% proficiency, ranked #48 of 73 in FL (top 66%) — families likely to look elsewhere, expect single-tenant / working-renter base with shorter leases.
- Market conditions: Rents flat; 200 active listings in the ZIP; 40 comparable units currently listed for rent nearby; rentals at typical pace (median 25d on market — plan ~3-4 weeks tenant-placement turnaround); lower-income renter base — watch delinquency; 6,503 units permitted in Duval County in 2024 (1,131 in 5+ unit buildings).
- This rent runs 33% of the median local income ($39k/yr) — at the standard rent-burdened threshold; future hikes will face affordability resistance.
Forward outlook
- Local home prices are declining (-3.0%/yr); year-one equity from $691 of loan paydown is wiped out by about $3k of value loss. Plan a longer hold.
- Duval County population projected at +19% by 2050 — long-run rental-demand tailwind backs the buy-and-hold thesis.
Negotiation context
- It's been on market 148 days — a 12% lower offer ($88k) is reasonable based on typical stale-listing flexibility.
- 3 sale attempts since 11y ago with the ask held roughly flat each time — persistent listings suggest the price (not the market) is what's stuck; bring a comps-based counter.
Risks & watch-outs
- Watch-outs: built in 1924 — expect roof / HVAC / electrical / plumbing capex.
- Climate carrying-cost: severe wind risk, 99% chance of damaging wind over 30y; extreme-heat days projected 7→20/yr by 2055 (HVAC capex compounding) — expect insurance premiums to compound above CPI over the hold.
Questions for the listing agent
- It's been on market 148 days. Have you received any prior offers? Is the seller open to a 12% concession, seller financing, or rate buy-down credit?
- Built in 1924 — when were the roof, HVAC, electrical panel, plumbing, and water heater last replaced?
- Why hasn't it sold? Are there any deal-killer items the seller is aware of (foundation, flood, title, zoning, code violations)?
- Is there a deadline driving the sale (1031 exchange, divorce, estate, relocation)? That informs how much negotiation room exists.
- Schools are B-rated — typically a magnet for longer-tenancy family renters. What's the average tenant stay here, and is there a school-zone premium baked into asking?
- What's the average days-on-market for RENTAL listings here right now (not sales)? A rising rental-DOM trend means longer vacancies and softer asking-rent achievability than the comps imply.
- What's the recent tenant-quality profile in this submarket — average credit score on applications, eviction rate, late-payment / NSF rate, and stable-employment percentage? A property-management company in the area should have these aggregated.
- How much new for-sale + rental construction is in the pipeline within 1–3 miles? Heavy new supply typically softens prices + rents 12–24 months out; constrained supply supports both.
Investment metrics
- 1% rule
- 1.07% ✓
- Cap rate
- 8.65%
- Cash-on-cash
- 8.40%
- DSCR
- 1.37
- GRM
- 7.8
CMA / ARV
- ARV (on-the-fly)
- $93,100
- Comps found
- 12
Show comp detail 12 sales within ~0.75 mi
| Address | Dist | Beds/Ba | Sqft | Sold | Price | $/sf | Match |
|---|---|---|---|---|---|---|---|
| 334 Birch St | 0.11mi | 3/1.0 (+1) | 1,008 (+3%) | 4mo | $50,000 | $50 | 82 |
| 2822 Flanders St #8-19 | 0.54mi | 2/1.0 | 983 (+0%) | 5mo | $58,000 | $59 | 70 |
| 2830 Saturn Ave | 0.57mi | 3/1.0 (+1) | 960 (-2%) | 2mo | $72,000 | $75 | 64 |
| 28 W 35th St | 0.39mi | 3/1.5 (+1) | 1,034 (+6%) | 4mo | $110,000 | $106 | 62 |
| 4562 Notter Ave | 0.29mi | 3/2.0 (+1) | 1,052 (+7%) | 4mo | $139,000 | $132 | 62 |
| 705 Oak Arbor Cir | 0.23mi | 3/2.0 (+1) | 1,094 (+12%) | 1mo | $160,000 | $146 | 60 |
| 1004 W 26th St | 0.58mi | 3/1.0 (+1) | 936 (-4%) | 2mo | $102,500 | $110 | 59 |
| 632 Ivy St | 0.40mi | 3/1.0 (+1) | 890 (-9%) | 5mo | $45,000 | $51 | 56 |
| 3410 N Lee St | 0.60mi | 3/1.0 (+1) | 1,056 (+8%) | 3mo | $100,000 | $95 | 52 |
| 4808 Silver St | 0.47mi | 3/1.0 (+1) | 1,120 (+14%) | 1mo | $135,000 | $121 | 49 |
| 2727 N N Davis Rd St | 0.71mi | 3/1.0 (+1) | 904 (-8%) | 1mo | $78,000 | $86 | 48 |
| 1125 W 29th St | 0.70mi | 3/1.0 (+1) | 864 (-12%) | 4mo | $73,000 | $84 | 39 |
Match score weights: distance 35% · size 25% · config 20% · recency 20%. Top-matched comps best support the ARV.
Projected returns pro-forma
-3.0% appreciation · 0.94% rent growth · sell at horizon
- IRR
- -5.8%
- Equity multiple
- 0.79×
- Total profit
- $-5,899
- Equity at exit
- $14,910
- IRR
- 1.3%
- Equity multiple
- 1.08×
- Total profit
- $2,344
- Equity at exit
- $8,646
Cash invested: $28,000 (down + closing). Projections, not guarantees.
Landlord ↔ Tenant lean methodology
- Overall (STATE)
- 87 Strongly Landlord-Friendly
- State Florida
- 87 Strongly Landlord-Friendly · R+3
- County
- — inherits STATE
- City
- — inherits STATE
ZIP-level market 32206
- Home prices YoY
- -23.7%
- Rents YoY
- 0.9%
- Active inventory
- 200
- Price-to-rent
- 7.8×
Monthly cashflow live
- Estimated rent
- $1,071 high interval (Pro) →
- Mortgage (P&I)
- −$524
- Tax from tax record
- −$84 /mo · $1,006/yr
- Insurance
- −$42
- HOA
- −$0
- Vacancy / Maint / Mgmt
- −$225
- Net cashflow
- $196
Break-even live
Sensitivity live
| Price | -10% $253 | -5% $224 | +0% $196 | +5% $168 | +10% $139 |
|---|---|---|---|---|---|
| Rent | -10% $111 | -5% $154 | +0% $196 | +5% $238 | +10% $281 |
| Rate | -1.0pp $246 | -0.5pp $222 | base $196 | +0.5pp $170 | +1.0pp $144 |
UW: 25.0% down · 7.5% · 30yr · 1.5% tax · 5.0% vac · 8.0% maint · 8.0% mgmt
Financing live
Cash to close
- Down payment
- $25,000
- Closing costs
- $3,000
- Reserves months
- —
- Total cash needed
- —
Loan-product check · same deal, 3 products live
Conventional
25% down · 7.5% · 30yr
- Down + closing
- —
- Monthly P&I
- —
- Monthly cashflow
- —
- DSCR
- —
- Eligible?
- —
Personal DTI + credit; lowest rate.
DSCR
20% down · 8.5% · 30yr
- Down + closing
- —
- Monthly P&I
- —
- Monthly cashflow
- —
- DSCR
- —
- Eligible?
- —
No personal income docs; deal must DSCR.
Hard money
10% down · 12.0% · 12mo
- Down + closing
- —
- Monthly P&I
- —
- Monthly cashflow
- —
- DSCR
- —
- Eligible?
- —
Short-term bridge; refi at stabilization.
Rent comps 40 comps
| Address | Beds | Baths | Sqft | Rent | $/sqft | DOM | Units | Dist |
|---|---|---|---|---|---|---|---|---|
| 3927 Notter Ave Jacksonville, FL | 2.0 | 1.0 | 738 | $850 | $1.15 | 22d | 1 | 0.05mi |
| 3927 Notter Ave Jacksonville, FL | 2.0 | 1.0 | 738 | $850 | $1.15 | 15d | 1 | 0.05mi |
| 3933 Boulevard #2 Jacksonville, FL | 2.0 | 1.0 | 684 | $748 | $1.09 | 9d | 1 | 0.06mi |
| 3732 Lehigh St Jacksonville, FL | 2.0 | 1.0 | 850 | $900 | $1.06 | 16d | 1 | 0.12mi |
| 3730 Lehigh St Unit 3730 Jacksonville, FL | 2.0 | 1.0 | 850 | $900 | $1.06 | 16d | 1 | 0.12mi |
| 3914 Springfield Blvd Jacksonville, FL | 2.0 | 1.0 | 858 | $1,050 | $1.22 | 5d | 1 | 0.15mi |
| 3914 Springfield Blvd Jacksonville, FL | 2.0 | 1.0 | 858 | $1,050 | $1.22 | 25d | 1 | 0.15mi |
| 154 W 28th St Jacksonville, FL | 2.0 | 2.0 | 818 | $1,138 | $1.39 | 18d | 1 | 0.20mi |
| 528 W 25th St Jacksonville, FL | 2.0 | 1.0 | 944 | $1,100 | $1.17 | 25d | 1 | 0.25mi |
| 666 Basswood St Jacksonville, FL | 3.0 | 1.0 | 1002 | $1,400 | $1.40 | 25d | 1 | 0.25mi |
| 451 Long Branch Blvd Unit 451 Jacksonville, FL | 2.0 | 1.0 | 1000 | $1,350 | $1.35 | 25d | 1 | 0.26mi |
| 3728 Silver St Jacksonville, FL | 2.0 | 1.0 | 916 | $1,100 | $1.20 | 25d | 1 | 0.27mi |
| 519 W 23rd St Jacksonville, FL | 1.0 | 1.0 | 624 | $775 | $1.24 | 25d | 1 | 0.31mi |
| 539 W 23rd St #3 Jacksonville, FL | 1.0 | 1.0 | 795 | $775 | $0.97 | 25d | 1 | 0.32mi |
| 204 W 23rd St Jacksonville, FL | 3.0 | 1.0 | 960 | $1,225 | $1.28 | 3d | 1 | 0.37mi |
| 511 Ivy St Jacksonville, FL | 2.0 | 1.0 | 900 | $995 | $1.11 | 25d | 1 | 0.38mi |
| 134 W 23rd St Jacksonville, FL | 2.0 | 1.0 | 768 | $1,050 | $1.37 | 25d | 1 | 0.39mi |
| 849 W 30th St Apt 3 Jacksonville, FL | 2.0 | 1.0 | 750 | $965 | $1.29 | 25d | 1 | 0.41mi |
| 4721 E Castlewood Dr Jacksonville, FL | 3.0 | 1.0 | 1008 | $1,250 | $1.24 | 25d | 1 | 0.44mi |
| 522 W 21st St Jacksonville, FL | 3.0 | 2.0 | 1045 | $1,350 | $1.29 | 25d | 1 | 0.44mi |
| 34 W 23rd St Jacksonville, FL | 3.0 | 1.5 | 962 | $1,400 | $1.46 | 25d | 1 | 0.44mi |
| 4918 N Pearl St Jacksonville, FL | 2.0 | 1.0 | 850 | $895 | $1.05 | 25d | 1 | 0.47mi |
| 101 W 21st St Unit 2 Jacksonville, FL | 2.0 | 1.0 | 635 | $1,085 | $1.71 | 25d | 1 | 0.47mi |
| 917 W 30th St Jacksonville, FL | 2.0 | 1.0 | 672 | $1,200 | $1.79 | 18d | 1 | 0.47mi |
| 519 W 19th St Jacksonville, FL | 2.0 | 2.0 | 1071 | $1,075 | $1.00 | 5d | 1 | 0.51mi |
| 519 W 19th St Unit a Jacksonville, FL | 2.0 | 1.5 | 1071 | $1,095 | $1.02 | 22d | 1 | 0.51mi |
| 519 W 19th St Jacksonville, FL | 2.0 | 2.0 | 1071 | $1,095 | $1.02 | 22d | 1 | 0.51mi |
| 519 W 19th St Unit a Jacksonville, FL | 2.0 | 1.5 | 1071 | $1,075 | $1.00 | 15d | 1 | 0.51mi |
| 22 W 38th St Jacksonville, FL | 2.0 | 1.0 | 800 | $1,100 | $1.38 | 25d | 1 | 0.51mi |
| 2906 Silver St Unit 01 Jacksonville, FL | 2.0 | 1.0 | 840 | $895 | $1.07 | 25d | 1 | 0.52mi |
| 916 W 25th St Jacksonville, FL | 2.0 | 1.0 | 816 | $1,025 | $1.26 | 18d | 1 | 0.52mi |
| 610 W 18th St Unit 2 Jacksonville, FL | 2.0 | 1.0 | 750 | $825 | $1.10 | 3d | 1 | 0.60mi |
| 610 W 18th St Unit 1 Jacksonville, FL | 2.0 | 1.0 | 750 | $825 | $1.10 | 25d | 1 | 0.60mi |
| 3416 N Lee St Unit 1 Jacksonville, FL | 2.0 | 1.0 | 680 | $995 | $1.46 | 25d | 1 | 0.61mi |
| 2817 Mars Ave Jacksonville, FL | 2.0 | 1.0 | 945 | $975 | $1.03 | 22d | 1 | 0.63mi |
| 3902 Stuart St Jacksonville, FL | 2.0 | 2.0 | 1114 | $1,050 | $0.94 | 25d | 1 | 0.65mi |
| 2811 Venus St Jacksonville, FL | 2.0 | 1.0 | 830 | $1,087 | $1.31 | 5d | 1 | 0.66mi |
| 1104 W 29th St Unit 1104 Jacksonville, FL | 2.0 | 1.0 | 624 | $850 | $1.36 | 25d | 1 | 0.68mi |
| 141 W 43rd St Jacksonville, FL | 3.0 | 2.0 | 1022 | $1,231 | $1.20 | 4d | 1 | 0.71mi |
| 5035 N Main St Jacksonville, FL | 3.0 | 1.0–2.0 | 816 | $1,181 | $1.45 | 25d | 69 | 0.72mi |
Listing history 27 events
-
2026-06-18days on market $99,999 Active 148 DOM
-
2026-06-17days on market $99,999 Active 147 DOM
-
2026-06-16days on market $99,999 Active 146 DOM
-
2026-06-15days on market $99,999 Active 145 DOM
-
2026-06-10days on market $99,999 Active 139 DOM
-
2026-06-08days on market $99,999 Active 138 DOM
-
2026-06-08days on market $99,999 Active 137 DOM
-
2026-06-03days on market $99,999 Active 133 DOM
-
2026-06-02days on market $99,999 Active 132 DOM
-
2026-06-01days on market $99,999 Active 131 DOM
-
2026-05-31days on market $99,999 Active 130 DOM
-
2026-02-22price $99,999
-
2026-02-12price $100,000
-
2026-01-20$105,000 Active
-
2025-10-11historical $1,100
-
2025-10-09price $1,100
-
2025-09-06$1,150
-
2021-09-01soldstatus $1,450,000
-
2015-07-23soldstatus $10,500 Sold 281-char remark
Show marketing remark (281 chars)
PRICE REDUCTION...INVESTOR ALERT!! Bring ALL OFFERS... Clean 2 bedroom 1 bath Home with fireplace. Bathroom looks updated. Beautiful old hardwood floors. Sold “as-is” without repairs or warranty. Seller has no knowledge of the property history, no disclosures supplied.
-
2015-07-02status Pending 281-char remark
Show marketing remark (281 chars)
PRICE REDUCTION...INVESTOR ALERT!! Bring ALL OFFERS... Clean 2 bedroom 1 bath Home with fireplace. Bathroom looks updated. Beautiful old hardwood floors. Sold “as-is” without repairs or warranty. Seller has no knowledge of the property history, no disclosures supplied.
-
2015-06-12historical 281-char remark
Show marketing remark (281 chars)
PRICE REDUCTION...INVESTOR ALERT!! Bring ALL OFFERS... Clean 2 bedroom 1 bath Home with fireplace. Bathroom looks updated. Beautiful old hardwood floors. Sold “as-is” without repairs or warranty. Seller has no knowledge of the property history, no disclosures supplied.
-
2015-03-16$19,990 Active 281-char remark
Show marketing remark (281 chars)
PRICE REDUCTION...INVESTOR ALERT!! Bring ALL OFFERS... Clean 2 bedroom 1 bath Home with fireplace. Bathroom looks updated. Beautiful old hardwood floors. Sold “as-is” without repairs or warranty. Seller has no knowledge of the property history, no disclosures supplied.
-
2015-03-16price $14,900 281-char remark
Show marketing remark (281 chars)
PRICE REDUCTION...INVESTOR ALERT!! Bring ALL OFFERS... Clean 2 bedroom 1 bath Home with fireplace. Bathroom looks updated. Beautiful old hardwood floors. Sold “as-is” without repairs or warranty. Seller has no knowledge of the property history, no disclosures supplied.
-
2015-03-16price $16,990 281-char remark
Show marketing remark (281 chars)
PRICE REDUCTION...INVESTOR ALERT!! Bring ALL OFFERS... Clean 2 bedroom 1 bath Home with fireplace. Bathroom looks updated. Beautiful old hardwood floors. Sold “as-is” without repairs or warranty. Seller has no knowledge of the property history, no disclosures supplied.
-
2001-02-09soldstatus $57,000
-
2000-01-05soldstatus $40,500
-
1990-11-28soldstatus $12,754
ⓘ Source: listings_history table (triggers on properties + properties_extension) + one-shot
backfill from property_details.listing_events for pre-trigger history.
Tax reassessment forecast FL · Resets to sale price
- Current annual tax
- $1,006 · $84/mo
- Projected year-2 tax
- $1,006 · $84/mo
- Expected delta
- $0/yr ($0/mo · -0.0%)
ⓘ Screening estimate from a state-policy table — verify with the county assessor before closing.
Climate risk First Street
- Flood 1/10 Low FEMA zone X (unshaded) · 0% chance over 30 yrs
- Wildfire 1/10 Low
- Heat 9/10 Extreme 7 d/yr ≥107°F today · 20 d/yr by 30 yrs out
- Wind 9/10 Extreme 99% chance of damaging wind over 30 yrs
- Air quality 4/10 Moderate 6 unhealthy d/yr today · 6 by 30 yrs out
Nearby sold comps map
Loading sold comps map…
Walkable amenities ~0.75 mi
Loading nearby amenities…
Taxation est. · year 1
- Rental income
- $12,851
- − Mortgage interest
- −$5,601
- − Property taxes
- −$1,006
- − Insurance
- −$500
- − Repairs & maintenance
- −$1,028
- − Management
- −$1,028
- − Depreciation
- −$2,909
- Taxable income
- $778
- Est. tax owed @ 24.0%
- −$187
- After-tax cash flow
- $2,166/yr
For passive investors: Depreciation is non-cash, so a rental often shows a tax loss while cash-flowing — sheltering income. Rental losses are passive: they offset passive income freely, and up to $25,000/yr can offset ordinary (W-2) income if you actively participate and your MAGI is under $100k (phasing out to $0 by $150k); unused losses carry forward. On sale, claimed depreciation is recaptured at up to 25%, and gains may owe capital-gains tax (a 1031 exchange can defer both). Figures are a year-1 estimate at your 24.0% rate — not tax advice; consult a CPA.
Schools (NCES district)
- District
- Duval
- NCES district ID
- 1200480
- Math proficiency
- 46% ▼ -11.00%
- Reading proficiency
- 45% ▼ -4.00%
- Median HH income
- $48,987
- Composite
- 38.97/100
- National rank
- #4076
- State rank
- #48 of 73 in FL
Livability — Jacksonville
- Score
- 83/100
- State rank
- #50
- US rank
- #911
Category grades
Schools grade is shown separately in the Schools card above.
Census & demographics
- Census place
- Jacksonville, FL
- County
- Duval County · 1,015,274 people
- City population
- 979,034
- Metro
- Jacksonville, FL
- Population (ZIP)
- 17,105
- Household income
- $39,242
- Rent vs Own
- Severe rent burden
- 1057.0
Population outlook (Duval County) Hauer SSP2
- Today (2025)
- 1,013,010 people
- By 2030
- 1,059,228 · +4.6%
- By 2040
- 1,141,439 · +12.7%
- By 2050
- 1,205,258 · +19.0%
- By 2075
- 1,324,282 · +30.7%
- By 2100
- 1,319,620 · +30.3%
Race, ethnicity, and origin ACS 2023
- Neighborhood character
- Predominantly Black (65%)
- Race & ethnicity
- Black 65% White 22% Two or more races 8% Hispanic / Latino 6%
- Hispanic origin (detail)
- Mexican 1% Puerto Rican 2%
- Common ancestry
- Italian 2% Romanian 1% Slovak 1%
- Foreign-born
- 5% · Canada
- Languages at home
- 93% English-only · Spanish 3% Arabic 1% German/W. Germanic 1%
Political lean MEDSL · Duval
- 2024 margin
- Toss-up / Even · D 48.7% · R 50.1% · Other 1.2%
- 2008→2024 swing
- +0.4pp no change · 2008: -1.9pp · 2024: -1.5pp
- All cycles
- 2024: R+1.5 2020: D+3.8 2016: R+1.5 2012: R+3.6 2008: R+1.9
Not yet ingested
- Civics
- —
Market trends
- HPI YoY
- ▼ -64.55%
- Current HPI
- 208.1852
- Rent YoY
- ▲ 0.94%
- Metro
- Jacksonville, FL
- State GDP YoY
- ▲ 3.28%
- F500 in state
- 36
Industry mix (Fortune 500 HQ in FL)
| Industry | F500 HQs | Revenue |
|---|---|---|
| Industrial Technology | 2 | $29B |
|
||
| Insurance | 2 | $17B |
|
||
| Retail | 1 | $60B |
|
||
| Technology Distribution | 1 | $58B |
|
||
| Homebuilding | 1 | $35B |
|
||
| Technology Manufacturing | 1 | $35B |
|
||
Price history
+684.1% since first listed16 events — show timeline
- 2026-02-22 Price Changed $99,999 realMLS
- 2026-02-12 Price Changed $100,000 realMLS
- 2026-01-20 Listed $105,000 realMLS
- 2025-10-11 Rental Removed $1,100 NEFLMLS
- 2025-10-09 Price Changed $1,100 NEFLMLS
- 2025-09-06 Listed for Rent $1,150 NEFLMLS
- 2021-09-01 Sold (Public Records) $1,450,000 Public Records
- 2015-07-23 Sold (MLS) $10,500 realMLS
- 2015-07-02 Pending — realMLS
- 2015-06-12 Listing Removed — realMLS
- 2015-03-16 Listed $19,990 realMLS
- 2015-03-16 Price Changed $16,990 realMLS
- 2015-03-16 Price Changed $14,900 realMLS
- 2001-02-09 Sold (Public Records) $57,000 Public Records
- 2000-01-05 Sold (Public Records) $40,500 Public Records
- 1990-11-28 Sold (Public Records) $12,754 Public Records
Property tax history
+12.3%/yrLatest (2025): $1,006 · +27.7% YoY. Source: county tax records.
Cash-flow waterfall
monthlySold comps — $/sqft
last 12 mo · ≤1 miLoading sold comps…