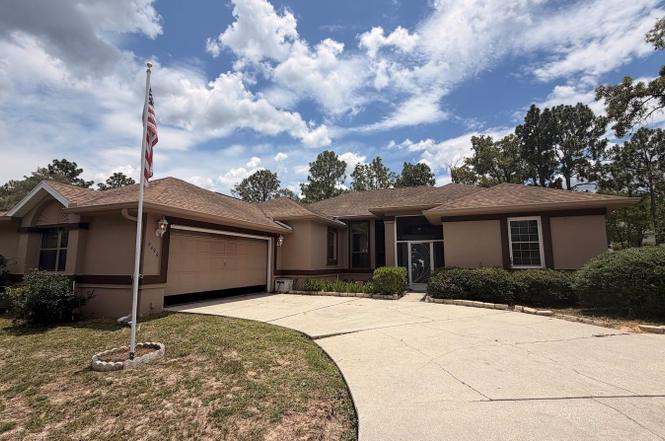
2496 E Newhaven St · Citrus Hills, FL
Flood risk 1/10 · Minimal
- FEMA flood zone
- X (unshaded)
- Chance of flooding over 30 yrs
- 0.0%
- Est. flood insurance / yr
- $507 – $1,088
Fire risk 5/10 · Moderate
- Est. fire insurance / yr
- $947 – $1,759
Heat risk 9/10 · Severe
- Hot days now (above 108°F)
- 7 days/yr
- Hot days in 30 yrs
- 23 days/yr
Wind risk 9/10 · Severe
- Chance of severe wind over 30 yrs
- 99.0%
Air-quality risk 1/10 · Minimal
- Unhealthy air days now
- 0 days/yr
- Unhealthy air days in 30 yrs
- 0 days/yr
Risk factors via First Street. Map © Google.
Why this score? — see what drove the B- grade
The composite is a weighted blend of 9 inputs, each scored 0–100. Each bar is that input's sub-score; the figure is the points it added to the 100-point composite (weight × sub-score).
- Cash flow +25.7/30.0
- ARV discount +15.0/15.0
- DSCR +8.6/10.0
- 1% rule +6.2/10.0
- Schools +4.1/10.0
- Livability +3.2/5.0
- Rent growth +2.5/5.0
- Condition / age +2.5/5.0
- Appreciation +0.0/10.0
$199,999
🖨 Deal sheet (PDF) 📄 Offer letter ✓ Due diligence
Listing remarks MLS
Citrus Hills - beautiful Celina Hills location on . 50 acre homestie. Wonderful double door entry leading to formal dining room and living room with sliders leading to lanai and inground caged pool. Split bedroom plan with master bedroom overlooking pool master bath with double vanities, jacuzzi tub shower. Kitchen has convenient breakfast counter and opens to family room area. Move in condition and in perfect location. Lockbox - not vacant. Call office first. Thank you.
Key facts
- Attached garage
- High-volume ceilings
- Formal dining area
Tags
Property features AI
Finance
- Other: No lease restrictions indicated
- HOA & community: Has HOA: Celina Hills Property Owner's Association, annual fee $109 (about $9.08/month); Pets allowed
Exterior
- Parking: Attached garage; 2-car garage; Garage faces side
- Utilities: Public water; Septic tank sewer; Cable available; Electricity connected; Water connected
- Home design: Single family residence; One-story; North-facing
- Construction: Block, concrete and stucco construction; Shingle roof; Slab foundation; Built on one level
- Exterior features: Enclosed patio/porch; Front porch; Rear porch; Screened porch; Rain gutters; Other exterior features; Paved lot; Oak trees and landscaped grounds; Half-acre lot (approx.)
Interior
- Kitchen: Dishwasher; Microwave; Refrigerator; Eat-in kitchen
- Bedrooms: 3 bedrooms
- Flooring: Carpet
- Bathrooms: 2 full bathrooms
- Heating & cooling: Central heating; Central air conditioning
- Interior features: Ceiling fans; Crown molding; Eat-in kitchen; Thermostat; Tray ceilings; Walk-in closets; Window treatments; Other interior features
- Laundry & utility: Dedicated laundry room
Neighborhood map
What this means for you Summary
Snapshot
- This is a 3-bed/2.0-bath single-family listed at $200k.
Deal economics
- At list price, monthly cash flow is $482 ($6k/yr) — positive.
- The deal already cash-flows at list — no discount required.
- Meets the 1% rule at list price ($2k rent vs $200k).
- Cap rate 9.2% vs local median 2.9% in Citrus Hills — top-decile yield for the area; either an underpriced asset or a hidden risk that comps aren't pricing in. Stress-test before assuming the spread holds.
Location & tenants
- Location reads 63/100 on livability (#744 in FL) — a middle-class / working-renter tenant base. Strengths: crime A+, housing A+; Watch: health & safety C-, amenities F, commute F.
- Citrus (rural): math 49% / reading 50% proficiency, ranked #44 of 73 in FL (top 60%) — families likely to look elsewhere, expect single-tenant / working-renter base with shorter leases.
- Zoned schools: Hernando Elementary School (math 47% / reading 51%, grade D, #1,134 of 2,144 statewide, top 54%, 813 students, 71% FRL); Inverness Middle School (math 52% / reading 48%, grade C, #254 of 571 statewide, top 45%, 1,017 students, 60% FRL); Citrus High School (math 34% / reading 51%, grade F, #264 of 667 statewide, top 41%, 1,503 students, 54% FRL) — zoned schools at 62% FRL track the district average.
- Market conditions: 427 active listings in the ZIP; 4 comparable units currently listed for rent nearby; rentals at typical pace (median 23d on market — plan ~3-4 weeks tenant-placement turnaround); 2,443 units permitted in Citrus County in 2024 (0 in 5+ unit buildings).
- At $2,244/mo this rent would consume 47% of the median local household income ($58k/yr) (locally 240% of renters already pay >50% of income on rent) — very limited rent-growth headroom before tenants either downsize or default.
Forward outlook
- Local home prices are declining (-3.0%/yr); year-one equity from $1k of loan paydown is wiped out by about $6k of value loss. Plan a longer hold.
- Citrus County population projected to shrink 10% by 2050 — rents likely to lag national; underwrite the cash flow, not the appreciation.
Negotiation context
- Only 3 days on market — expect competitive offers; lowballing is unlikely to land.
- 2 sale attempts since 25y ago with the ask held roughly flat each time — persistent listings suggest the price (not the market) is what's stuck; bring a comps-based counter.
- Current owner paid $130k; list at $200k implies a 54% gain — meaningful room to come down on a strong offer.
Risks & watch-outs
- Climate carrying-cost: severe wind risk, 99% chance of damaging wind over 30y; moderate wildfire risk; extreme-heat days projected 7→23/yr by 2055 (HVAC capex compounding) — expect insurance premiums to compound above CPI over the hold.
Questions for the listing agent
- What does the HOA fee cover, when was the last increase, and are there any pending special assessments or reserve-fund shortfalls?
- Is there a deadline driving the sale (1031 exchange, divorce, estate, relocation)? That informs how much negotiation room exists.
- Schools are D-rated, which usually means shorter tenancies and higher turnover. Who's the typical renter profile here, and what's been the actual vacancy rate?
- What's the average days-on-market for RENTAL listings here right now (not sales)? A rising rental-DOM trend means longer vacancies and softer asking-rent achievability than the comps imply.
- What's the recent tenant-quality profile in this submarket — average credit score on applications, eviction rate, late-payment / NSF rate, and stable-employment percentage? A property-management company in the area should have these aggregated.
- How much new for-sale + rental construction is in the pipeline within 1–3 miles? Heavy new supply typically softens prices + rents 12–24 months out; constrained supply supports both.
Investment metrics
- 1% rule
- 1.12% ✓
- Cap rate
- 9.18%
- Cash-on-cash
- 10.32%
- DSCR
- 1.46
- GRM
- 7.4
CMA / ARV
- ARV (on-the-fly)
- $361,599
- Comps found
- 12
Show comp detail 12 sales within ~0.75 mi
| Address | Dist | Beds/Ba | Sqft | Sold | Price | $/sf | Match |
|---|---|---|---|---|---|---|---|
| 2617 E Newhaven St | 0.13mi | 3/2.0 | 1,770 (-2%) | 4mo | $300,000 | $169 | 88 |
| 2500 E Steven St | 0.25mi | 3/2.0 | 1,863 (+4%) | 1mo | $392,000 | $210 | 82 |
| 2828 E Celina St | 0.34mi | 3/2.0 | 1,759 (-2%) | 7mo | $350,000 | $199 | 75 |
| 2174 E Celina St | 0.34mi | 3/2.0 | 1,886 (+5%) | 2mo | $380,000 | $201 | 75 |
| 2656 E Hampshire St | 0.36mi | 3/2.0 | 1,862 (+4%) | 4mo | $499,000 | $268 | 74 |
| 2245 E Marcia St | 0.28mi | 3/2.0 | 1,610 (-10%) | 1mo | $280,000 | $174 | 69 |
| 2996 E Angelina St | 0.60mi | 3/2.0 | 1,807 (+0%) | 6mo | $405,000 | $224 | 66 |
| 3064 E Joseph Ln | 0.58mi | 3/2.0 | 1,751 (-3%) | 7mo | $230,000 | $131 | 62 |
| 2061 E Celina St | 0.44mi | 3/2.5 | 1,585 (-12%) | 6mo | $267,500 | $169 | 53 |
| 2983 E Marcia St | 0.51mi | 3/2.0 | 2,015 (+12%) | 4mo | $490,000 | $243 | 53 |
| 1191 N Chance Way | 0.74mi | 3/2.0 | 1,997 (+11%) | 1mo | $425,000 | $213 | 46 |
| 1159 N Nashua Ter | 0.56mi | 4/3.0 (+1) | 1,990 (+11%) | 1mo | $365,000 | $183 | 46 |
Match score weights: distance 35% · size 25% · config 20% · recency 20%. Top-matched comps best support the ARV.
Projected returns pro-forma
-3.0% appreciation · 3.0% rent growth · sell at horizon
- IRR
- -0.8%
- Equity multiple
- 0.97×
- Total profit
- $-1,759
- Equity at exit
- $29,821
- IRR
- 8.8%
- Equity multiple
- 1.68×
- Total profit
- $37,873
- Equity at exit
- $17,292
Cash invested: $56,000 (down + closing). Projections, not guarantees.
Landlord ↔ Tenant lean methodology
- Overall (STATE)
- 87 Strongly Landlord-Friendly
- State Florida
- 87 Strongly Landlord-Friendly · R+3
- County
- — inherits STATE
- City
- — inherits STATE
ZIP-level market 34453
- Home prices YoY
- -26.1%
- Active inventory
- 427
- Price-to-rent
- 7.4×
Monthly cashflow live
- Estimated rent
- $2,244 medium interval (Pro) →
- Mortgage (P&I)
- −$1,049
- Tax from tax record
- −$150 /mo · $1,800/yr
- Insurance
- −$83
- HOA
- −$9
- Vacancy / Maint / Mgmt
- −$471
- Net cashflow
- $482
Break-even live
Sensitivity live
| Price | -10% $595 | -5% $538 | +0% $482 | +5% $425 | +10% $368 |
|---|---|---|---|---|---|
| Rent | -10% $304 | -5% $393 | +0% $482 | +5% $570 | +10% $659 |
| Rate | -1.0pp $582 | -0.5pp $532 | base $482 | +0.5pp $430 | +1.0pp $377 |
UW: 25.0% down · 7.5% · 30yr · 1.5% tax · 5.0% vac · 8.0% maint · 8.0% mgmt
Financing live
Cash to close
- Down payment
- $50,000
- Closing costs
- $6,000
- Reserves months
- —
- Total cash needed
- —
Loan-product check · same deal, 3 products live
Conventional
25% down · 7.5% · 30yr
- Down + closing
- —
- Monthly P&I
- —
- Monthly cashflow
- —
- DSCR
- —
- Eligible?
- —
Personal DTI + credit; lowest rate.
DSCR
20% down · 8.5% · 30yr
- Down + closing
- —
- Monthly P&I
- —
- Monthly cashflow
- —
- DSCR
- —
- Eligible?
- —
No personal income docs; deal must DSCR.
Hard money
10% down · 12.0% · 12mo
- Down + closing
- —
- Monthly P&I
- —
- Monthly cashflow
- —
- DSCR
- —
- Eligible?
- —
Short-term bridge; refi at stabilization.
Rent comps 4 comps
| Address | Beds | Baths | Sqft | Rent | $/sqft | DOM | Units | Dist |
|---|---|---|---|---|---|---|---|---|
| 2620 E Newhaven St Inverness, FL | 3.0 | 2.0 | 1884 | $2,400 | $1.27 | 23d | 1 | 0.15mi |
| 2858 E Marcia St Inverness, FL | 4.0 | 2.0 | 1790 | $2,500 | $1.40 | 23d | 1 | 0.40mi |
| 543 N Rooks Ave Inverness, FL | 3.0 | 2.0 | 1296 | $1,900 | $1.47 | 23d | 1 | 0.90mi |
| 1471 E Saint James Loop Inverness, FL | 3.0 | 2.0 | 1228 | $1,700 | $1.38 | 23d | 1 | 1.21mi |
HOA detail
- Monthly dues
- $9 · $108/yr
- Likely covers
- pool
Listing history 3 events
-
2026-06-21days on market $199,999 Active 3 DOM
-
2026-06-19remarks 678-char remark
-
2026-06-19$199,999 Active 1 DOM
ⓘ Source: listings_history table (triggers on properties + properties_extension) + one-shot
backfill from property_details.listing_events for pre-trigger history.
Tax reassessment forecast FL · Resets to sale price
- Current annual tax
- $1,800 · $150/mo
- Projected year-2 tax
- $1,800 · $150/mo
- Expected delta
- $0/yr ($0/mo · 0.0%)
ⓘ Screening estimate from a state-policy table — verify with the county assessor before closing.
Climate risk First Street
- Flood 1/10 Low FEMA zone X (unshaded) · 0% chance over 30 yrs
- Wildfire 5/10 Major
- Heat 9/10 Extreme 7 d/yr ≥108°F today · 23 d/yr by 30 yrs out
- Wind 9/10 Extreme 99% chance of damaging wind over 30 yrs
- Air quality 1/10 Low 0 unhealthy d/yr today · 0 by 30 yrs out
Nearby sold comps map
Loading sold comps map…
Walkable amenities ~0.75 mi
Loading nearby amenities…
Taxation est. · year 1
- Rental income
- $26,927
- − Mortgage interest
- −$11,203
- − Property taxes
- −$1,800
- − Insurance
- −$1,000
- − Repairs & maintenance
- −$2,154
- − Management
- −$2,154
- − HOA
- −$108
- − Depreciation
- −$5,818
- Taxable income
- $2,690
- Est. tax owed @ 24.0%
- −$646
- After-tax cash flow
- $5,133/yr
For passive investors: Depreciation is non-cash, so a rental often shows a tax loss while cash-flowing — sheltering income. Rental losses are passive: they offset passive income freely, and up to $25,000/yr can offset ordinary (W-2) income if you actively participate and your MAGI is under $100k (phasing out to $0 by $150k); unused losses carry forward. On sale, claimed depreciation is recaptured at up to 25%, and gains may owe capital-gains tax (a 1031 exchange can defer both). Figures are a year-1 estimate at your 24.0% rate — not tax advice; consult a CPA.
Schools (NCES district)
- District
- Citrus
- NCES district ID
- 1200270
- Math proficiency
- 49% ▼ -10.00%
- Reading proficiency
- 50% ▼ -6.00%
- Median HH income
- $38,618
- Composite
- 41.28/100
- National rank
- #3519
- State rank
- #44 of 73 in FL
Livability — Citrus Hills
- Score
- 63/100
- State rank
- #744
- US rank
- #16030
Category grades
Schools grade is shown separately in the Schools card above.
Census & demographics
- Census place
- Citrus Hills, FL
- County
- Citrus County · 111,314 people
- Metro
- Homosassa Springs, FL
- Population (ZIP)
- 10,621
- Household income
- $57,568
- Rent vs Own
- Severe rent burden
- 240.0
Population outlook (Citrus County) Hauer SSP2
- Today (2025)
- 138,622 people
- By 2030
- 136,886 · -1.3%
- By 2040
- 132,009 · -4.8%
- By 2050
- 125,196 · -9.7%
- By 2075
- 108,570 · -21.7%
- By 2100
- 84,454 · -39.1%
Race, ethnicity, and origin ACS 2023
- Neighborhood character
- Predominantly White (87%)
- Race & ethnicity
- White 87% Hispanic / Latino 6% Black 3% Two or more races 3% Asian 2%
- Hispanic origin (detail)
- Puerto Rican 2%
- Common ancestry
- Lithuanian 3% Romanian 3% Italian 3%
- Foreign-born
- 4% · Canada
- Languages at home
- 94% English-only · Spanish 4% Tagalog/Filipino 1% Other Asian/Pacific 0%
Political lean MEDSL · Citrus
- 2024 margin
- Solid R (+45.9) · D 26.8% · R 72.6%
- 2008→2024 swing
- -29.8pp toward R · 2008: -16.1pp · 2024: -45.9pp
- All cycles
- 2024: R+45.9 2020: R+41.0 2016: R+39.7 2012: R+21.9 2008: R+16.1
Not yet ingested
- Civics
- —
Market trends
- HPI YoY
- ▼ -103.32%
- Current HPI
- 291.8965
- Rent YoY
- —
- Metro
- Homosassa Springs, FL
- State GDP YoY
- ▲ 3.28%
- F500 in state
- 36
Industry mix (Fortune 500 HQ in FL)
| Industry | F500 HQs | Revenue |
|---|---|---|
| Industrial Technology | 2 | $29B |
|
||
| Insurance | 2 | $17B |
|
||
| Retail | 1 | $60B |
|
||
| Technology Distribution | 1 | $58B |
|
||
| Homebuilding | 1 | $35B |
|
||
| Technology Manufacturing | 1 | $35B |
|
||
Price history
+758.4% since first listed5 events — show timeline
- 2026-06-18 Listed $199,999 Stellar MLS as Distributed by MLS Grid
- 2002-06-03 Sold (Public Records) $130,000 Public Records
- 2002-05-29 Sold (MLS) $129,950 RACC
- 2001-09-24 Listed $134,900 RACC
- 1993-04-01 Sold (Public Records) $23,300 Public Records
Property tax history
+2.2%/yrLatest (2025): $1,800 · +6.0% YoY. Source: county tax records.
Cash-flow waterfall
monthlySold comps — $/sqft
last 12 mo · ≤1 miLoading sold comps…