 🏗️ New Construction
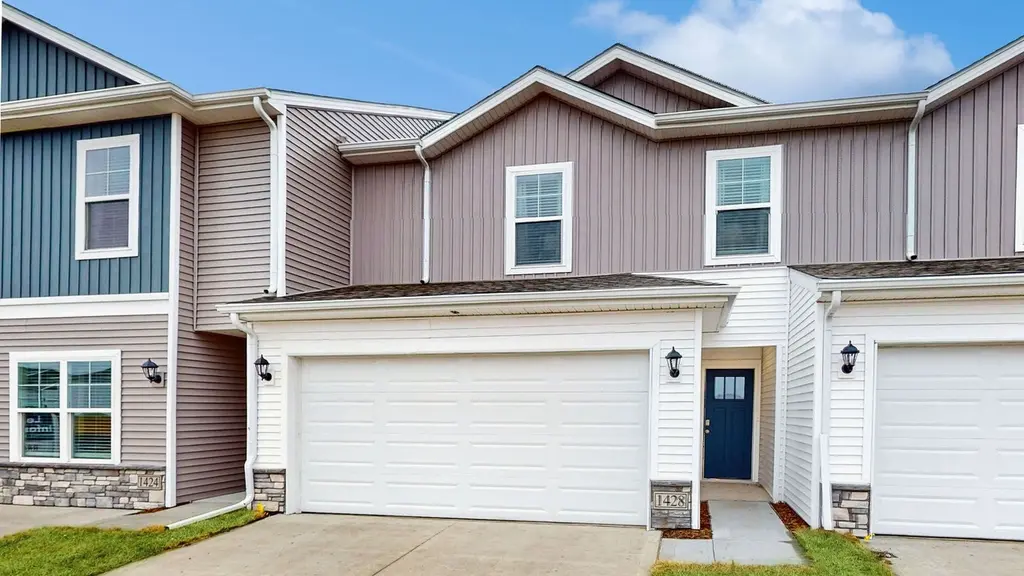
Tatum Plan · West Des Moines, IA
Flood risk No data
- FEMA flood zone
- —
- Chance of flooding over 30 yrs
- —
- Est. flood insurance / yr
- —
Fire risk No data
- Est. fire insurance / yr
- —
Heat risk No data
- Hot days now (above threshold)
- —
- Hot days in 30 yrs
- —
Wind risk No data
- Chance of severe wind over 30 yrs
- —
Air-quality risk No data
- Unhealthy air days now
- —
- Unhealthy air days in 30 yrs
- —
Risk factors via First Street. Map © Google.
Why this score? — see what drove the F grade
The composite is a weighted blend of 9 inputs, each scored 0–100. Each bar is that input's sub-score; the figure is the points it added to the 100-point composite (weight × sub-score).
- ARV discount +7.5/15.0
- Schools +7.1/10.0
- Livability +4.4/5.0
- Rent growth +3.0/5.0
- Cash flow +2.5/30.0
- Condition / age +2.5/5.0
- 1% rule +0.0/10.0
- DSCR +0.0/10.0
- Appreciation +0.0/10.0
$276,990
🖨 Deal sheet (PDF) 📄 Offer letter ✓ Due diligence
Listing remarks
Introducing the Tatum at Banks Landing Townhomes community in West Des Moines, IA This two-story townhome offers 4 bedrooms, 2.5 bathrooms, and 1,658 sq. ft. of thoughtfully designed living space, complete with all appliances. Step into a welcoming foyer that flows seamlessly into the open-concept main level. The stylish kitchen, featuring modern white cabinetry, stainless steel appliances, and a large island. The kitchen overlooks the dining area and great room-perfect for entertaining. An electric fireplace adds cozy warmth to the living space, and a conveniently located half bath serves guests. Upstairs, all four bedrooms are thoughtfully arranged. The primary bedroom, tucked in the back
Key facts
- Dual vanities
- Stylish kitchen
- Walk-in shower
Tags
Property features AI
Finance
- Other: Listing status: Active
- Financial info: List price $276,990
Exterior
- Parking: 2 total parking spaces, including a 2-car garage
- Home design: Tatum plan (new construction plan); Single-family plan listing (Plan)
- Exterior features: Living area approximately 1498; Located at 1401 S Banks St, West Des Moines, IA
Interior
- Bedrooms: 3 bedrooms
- Bathrooms: 2 full bathrooms and 1 half bathroom
- Interior features: Open-plan living area
Neighborhood map
What this means for you Summary
Snapshot
- This is a 3-bed/2.5-bath single-family listed at $277k.
Deal economics
- At list price, monthly cash flow is $-2k ($-19k/yr) — negative.
- To cash-flow at today's rent, offer at most $229k (17.3% below list).
- To meet the 1% rule (rent ≥ 1% of price), the offer needs to be $200k (27.7% below list).
- Recommended offer: $200k (27.7% below list) — sets the bar for 1% rule.
Location & tenants
- Location reads 87/100 on livability (#11 in IA, #336 nationally) — a professional / high-income tenant draw. Strengths: amenities A+, cost of living A+, housing A+; Watch: commute F.
- Waukee Community School District (suburban): math 80% / reading 79% proficiency, ranked #14 of 289 in IA (top 5%) — strong family-tenant draw, lease renewals of 3-5y typical; only 11% free/reduced lunch — higher-income household profile.
- Zoned schools: Woodland Hills Elementary School (math 79% / reading 68%, grade A, #172 of 616 statewide, top 28%, 537 students, 24% FRL); South Middle School (math 78% / reading 77%, grade A+, #50 of 246 statewide, top 20%, 909 students, 26% FRL); Waukee High School (math 74% / reading 82%, grade A-, #53 of 336 statewide, top 16%, 1,268 students, 24% FRL).
- Market conditions: Rents rising (+1.9%/yr); 591 active listings in the ZIP; 7 comparable units currently listed for rent nearby; rentals at typical pace (median 16d on market — plan ~3-4 weeks tenant-placement turnaround); solid renter incomes; 1,503 units permitted in Dallas County in 2024 (630 in 5+ unit buildings).
Forward outlook
- Local home prices are declining (-3.0%/yr); year-one equity from $3k of loan paydown is wiped out by about $14k of value loss. Plan a longer hold.
- Dallas County population projected at +74% by 2050 — long-run rental-demand tailwind backs the buy-and-hold thesis.
Negotiation context
- It's been on market 59 days — a 3% lower offer ($269k) is reasonable based on typical stale-listing flexibility.
Questions for the listing agent
- What do current leases actually rent for vs. the listed asking? Can we see a recent rent roll and the last 12 months of T-12 income?
- It's been on market 59 days. Have you received any prior offers? Is the seller open to a 28% concession, seller financing, or rate buy-down credit?
- Is there a deadline driving the sale (1031 exchange, divorce, estate, relocation)? That informs how much negotiation room exists.
- Schools are A-rated — typically a magnet for longer-tenancy family renters. What's the average tenant stay here, and is there a school-zone premium baked into asking?
- The area grade is low — what's the realistic commute time and amenity access for the typical tenant pool here? Any planned neighborhood developments (good or bad) we should know about?
- What's the average days-on-market for RENTAL listings here right now (not sales)? A rising rental-DOM trend means longer vacancies and softer asking-rent achievability than the comps imply.
- What's the recent tenant-quality profile in this submarket — average credit score on applications, eviction rate, late-payment / NSF rate, and stable-employment percentage? A property-management company in the area should have these aggregated.
- How much new for-sale + rental construction is in the pipeline within 1–3 miles? Heavy new supply typically softens prices + rents 12–24 months out; constrained supply supports both.
Investment metrics
- 1% rule
- 0.43% ✗
- Cap rate
- 2.12%
- Cash-on-cash
- -14.89%
- DSCR
- 0.34
- GRM
- 19.2
CMA / ARV
- ARV (median comp)
- $460,687
- List price
- $276,990
- Delta
- -39.87%
- Verdict
- UNDERPRICED
- Comps
- 20 within 1.0 mi
Show comp detail 12 sales within ~0.75 mi
| Address | Dist | Beds/Ba | Sqft | Sold | Price | $/sf | Match |
|---|---|---|---|---|---|---|---|
| 1404 S 91st St | 0.09mi | 4/3.0 (+1) | 1,433 (-4%) | 5mo | $451,900 | $315 | 77 |
| 1479 S 91st St | 0.09mi | 3/3.0 | 1,433 (-4%) | 11mo | $462,496 | $323 | 77 |
| 1230 S 92nd St | 0.29mi | 3/2.0 | 1,509 (+1%) | 10mo | $487,995 | $323 | 75 |
| 1473 S 91st St | 0.09mi | 4/3.0 (+1) | 1,433 (-4%) | 12mo | $458,778 | $320 | 72 |
| 1244 S 92nd St | 0.28mi | 3/3.0 | 1,579 (+5%) | 6mo | $524,742 | $332 | 71 |
| 1194 S Radley St | 0.27mi | 4/3.0 (+1) | 1,412 (-6%) | 5mo | $435,000 | $308 | 67 |
| 1216 S 92nd St | 0.29mi | 4/3.0 (+1) | 1,579 (+5%) | 4mo | $510,000 | $323 | 67 |
| 1122 S Radley St | 0.35mi | 3/2.0 | 1,402 (-6%) | 11mo | $395,000 | $282 | 62 |
| 803 S 93rd St | 0.68mi | 3/3.0 | 1,555 (+4%) | 3mo | $575,000 | $370 | 57 |
| 1299 S Radley St | 0.25mi | 4/3.0 (+1) | 1,697 (+13%) | 4mo | $689,900 | $407 | 56 |
| 8459 Longmeadow Ln | 0.60mi | 3/2.0 | 1,642 (+10%) | 2mo | $538,231 | $328 | 52 |
| 1283 S Radley St | 0.26mi | 4/3.0 (+1) | 1,675 (+12%) | 11mo | $697,407 | $416 | 52 |
Match score weights: distance 35% · size 25% · config 20% · recency 20%. Top-matched comps best support the ARV.
Projected returns pro-forma
-3.0% appreciation · 1.94% rent growth · sell at horizon
- IRR
- -45.9%
- Equity multiple
- -0.39×
- Total profit
- $-178,697
- Equity at exit
- $68,690
- IRR
- -92.2%
- Equity multiple
- -1.29×
- Total profit
- $-295,269
- Equity at exit
- $39,832
Cash invested: $128,992 (down + closing). Projections, not guarantees.
Landlord ↔ Tenant lean methodology
- Overall (STATE)
- 83 Strongly Landlord-Friendly
- State Iowa
- 83 Strongly Landlord-Friendly · R+6
- County
- — inherits STATE
- City
- — inherits STATE
ZIP-level market 50266
- Home prices YoY
- -17.5%
- Rents YoY
- 1.9%
- Active inventory
- 591
- Price-to-rent
- 11.5×
Monthly cashflow live
- Estimated rent
- $2,004 high interval (Pro) →
- Mortgage (P&I)
- −$2,416
- Tax est. 1.5%
- −$576 /mo · $6,910/yr
- Insurance
- −$192
- HOA
- −$0
- Vacancy / Maint / Mgmt
- −$421
- Net cashflow
- $-1,601
Break-even live
Sensitivity live
| Price | -10% $-1,283 | -5% $-1,442 | +0% $-1,601 | +5% $-1,760 | +10% $-1,919 |
|---|---|---|---|---|---|
| Rent | -10% $-1,759 | -5% $-1,680 | +0% $-1,601 | +5% $-1,522 | +10% $-1,443 |
| Rate | -1.0pp $-1,369 | -0.5pp $-1,484 | base $-1,601 | +0.5pp $-1,720 | +1.0pp $-1,842 |
UW: 25.0% down · 7.5% · 30yr · 1.5% tax · 5.0% vac · 8.0% maint · 8.0% mgmt
Financing live
Cash to close
- Down payment
- $115,172
- Closing costs
- $13,821
- Reserves months
- —
- Total cash needed
- —
Loan-product check · same deal, 3 products live
Conventional
25% down · 7.5% · 30yr
- Down + closing
- —
- Monthly P&I
- —
- Monthly cashflow
- —
- DSCR
- —
- Eligible?
- —
Personal DTI + credit; lowest rate.
DSCR
20% down · 8.5% · 30yr
- Down + closing
- —
- Monthly P&I
- —
- Monthly cashflow
- —
- DSCR
- —
- Eligible?
- —
No personal income docs; deal must DSCR.
Hard money
10% down · 12.0% · 12mo
- Down + closing
- —
- Monthly P&I
- —
- Monthly cashflow
- —
- DSCR
- —
- Eligible?
- —
Short-term bridge; refi at stabilization.
Rent comps 7 comps
| Address | Beds | Baths | Sqft | Rent | $/sqft | DOM | Units | Dist |
|---|---|---|---|---|---|---|---|---|
| 1257 S 91st St West Des Moines, IA | 3.0 | 3.5 | 1503 | $2,200 | $1.46 | 25d | 1 | 0.20mi |
| 1139 S 91st St West Des Moines, IA | 3.0 | 3.5 | 1529 | $2,200 | $1.44 | 25d | 1 | 0.30mi |
| 8925 Cascade Ave West Des Moines, IA | 1.0–3.0 | 1.0–2.0 | 1035 | $1,595 | $1.54 | 15d | 11 | 0.70mi |
| 10101 Stark Dr West Des Moines, IA | 3.0 | 2.5 | 1667 | $2,095 | $1.26 | 15d | 1 | 0.95mi |
| 455 S 85th St West Des Moines, IA | 1.0–3.0 | 1.0–2.5 | 1215 | $2,352 | $1.94 | 15d | 23 | 1.18mi |
| 6950 Stagecoach Dr West Des Moines, IA | 2.0–3.0 | 2.5–3.5 | 1785 | $2,585 | $1.45 | 15d | 20 | 1.44mi |
| 9005 Bridgewood Blvd West Des Moines, IA | 1.0–3.0 | 1.0–2.0 | 1044 | $950 | $0.91 | 23d | 1 | 1.45mi |
Listing history 18 events
-
2026-06-21days on market $276,990 Active 59 DOM
-
2026-06-18days on market $276,990 Active 56 DOM
-
2026-06-17days on market $276,990 Active 55 DOM
-
2026-06-16days on market $276,990 Active 54 DOM
-
2026-06-15days on market $276,990 Active 53 DOM
-
2026-06-14days on market $276,990 Active 51 DOM
-
2026-06-13days on market $276,990 Active 50 DOM
-
2026-06-10days on market $276,990 Active 48 DOM
-
2026-06-09days on market $276,990 Active 47 DOM
-
2026-06-08days on market $276,990 Active 46 DOM
-
2026-06-07days on market $276,990 Active 45 DOM
-
2026-06-05days on market $276,990 Active 42 DOM
-
2026-06-03days on market $276,990 Active 41 DOM
-
2026-06-02days on market $276,990 Active 40 DOM
-
2026-06-01days on market $276,990 Active 39 DOM
-
2026-05-31days on market $276,990 Active 38 DOM
-
2026-05-31days on market $276,990 Active 37 DOM
-
2026-04-23$276,990 Active 1029-char remark
ⓘ Source: listings_history table (triggers on properties + properties_extension) + one-shot
backfill from property_details.listing_events for pre-trigger history.
Nearby sold comps map
Loading sold comps map…
Walkable amenities ~0.75 mi
Loading nearby amenities…
Taxation est. · year 1
- Rental income
- $24,043
- − Mortgage interest
- −$25,806
- − Property taxes
- −$6,910
- − Insurance
- −$2,303
- − Repairs & maintenance
- −$1,923
- − Management
- −$1,923
- − Depreciation
- −$13,402
- Taxable loss
- −$28,225
- Est. tax savings @ 24.0%
- +$6,774
- After-tax cash flow
- $-12,437/yr
For passive investors: Depreciation is non-cash, so a rental often shows a tax loss while cash-flowing — sheltering income. Rental losses are passive: they offset passive income freely, and up to $25,000/yr can offset ordinary (W-2) income if you actively participate and your MAGI is under $100k (phasing out to $0 by $150k); unused losses carry forward. On sale, claimed depreciation is recaptured at up to 25%, and gains may owe capital-gains tax (a 1031 exchange can defer both). Figures are a year-1 estimate at your 24.0% rate — not tax advice; consult a CPA.
Schools (NCES district)
- District
- Waukee Community School District
- NCES district ID
- 1930510
- Math proficiency
- 80% ▼ -6.00%
- Reading proficiency
- 79% ▼ -5.00%
- Median HH income
- $88,580
- Composite
- 70.94/100
- National rank
- #245
- State rank
- #14 of 289 in IA
Livability — West Des Moines
- Score
- 87/100
- State rank
- #11
- US rank
- #336
Category grades
Schools grade is shown separately in the Schools card above.
Census & demographics
- Census place
- West Des Moines, IA
- County
- Dallas County · 77,082 people
- City population
- 71,011
- Metro
- Des Moines-West Des Moines, IA
- Population (ZIP)
- 37,523
- Household income
- $87,025
- Rent vs Own
- Severe rent burden
- 1561.0
Population outlook (Dallas County) Hauer SSP2
- Today (2025)
- 111,904 people
- By 2030
- 127,807 · +14.2%
- By 2040
- 160,576 · +43.5%
- By 2050
- 194,154 · +73.5%
- By 2075
- 271,895 · +143.0%
- By 2100
- 326,525 · +191.8%
Race, ethnicity, and origin ACS 2023
- Neighborhood character
- Predominantly White (80%)
- Race & ethnicity
- White 80% Asian 8% Two or more races 6% Hispanic / Latino 5% Black 3%
- Hispanic origin (detail)
- Mexican 3%
- Common ancestry
- Portuguese 5% Italian 3% Iranian 2%
- Foreign-born
- 12% · Canada, South Korea, Vietnam
- Languages at home
- 86% English-only · Spanish 4% Other Asian/Pacific 3% Other Indo-European 2%
Political lean MEDSL · Dallas
- 2024 margin
- Toss-up / Even · D 46.9% · R 51.7% · Other 1.4%
- 2008→2024 swing
- +0.8pp no change · 2008: -5.5pp · 2024: -4.8pp
- All cycles
- 2024: R+4.8 2020: R+2.0 2016: R+9.6 2012: R+11.8 2008: R+5.5
Not yet ingested
- Civics
- —
Market trends
- HPI YoY
- ▼ -43.24%
- Current HPI
- 203.6979
- Rent YoY
- ▲ 1.94%
- Metro
- Des Moines-West Des Moines, IA
- State GDP YoY
- ▲ 2.48%
- F500 in state
- 4
Industry mix (Fortune 500 HQ in IA)
| Industry | F500 HQs | Revenue |
|---|---|---|
| Financial Services | 1 | $16B |
|
||
| Retail / Convenience | 1 | $15B |
|
||
Cash-flow waterfall
monthlySold comps — $/sqft
last 12 mo · ≤1 miLoading sold comps…