 🌊 Lakefront
6107 Apache Dr · Enchanted Oaks, TX
Flood risk 1/10 · Minimal
- FEMA flood zone
- X (unshaded)
- Chance of flooding over 30 yrs
- 0.0%
- Est. flood insurance / yr
- $507 – $1,088
Fire risk 3/10 · Minor
- Est. fire insurance / yr
- $1,222 – $2,270
Heat risk 7/10 · Major
- Hot days now (above 109°F)
- 7 days/yr
- Hot days in 30 yrs
- 26 days/yr
Wind risk 6/10 · Moderate
- Chance of severe wind over 30 yrs
- 62.0%
Air-quality risk 2/10 · Minimal
- Unhealthy air days now
- 0 days/yr
- Unhealthy air days in 30 yrs
- 1 days/yr
Risk factors via First Street. Map © Google.
Why this score? — see what drove the C- grade
The composite is a weighted blend of 9 inputs, each scored 0–100. Each bar is that input's sub-score; the figure is the points it added to the 100-point composite (weight × sub-score).
- Cash flow +21.9/30.0
- ARV discount +7.5/15.0
- DSCR +7.0/10.0
- 1% rule +6.0/10.0
- Schools +3.2/10.0
- Livability +3.0/5.0
- Condition / age +2.5/5.0
- Rent growth +1.1/5.0
- Appreciation +0.0/10.0
$100,000
🖨 Deal sheet 📄 Offer letter ✓ Due diligence
Listing remarks MLS
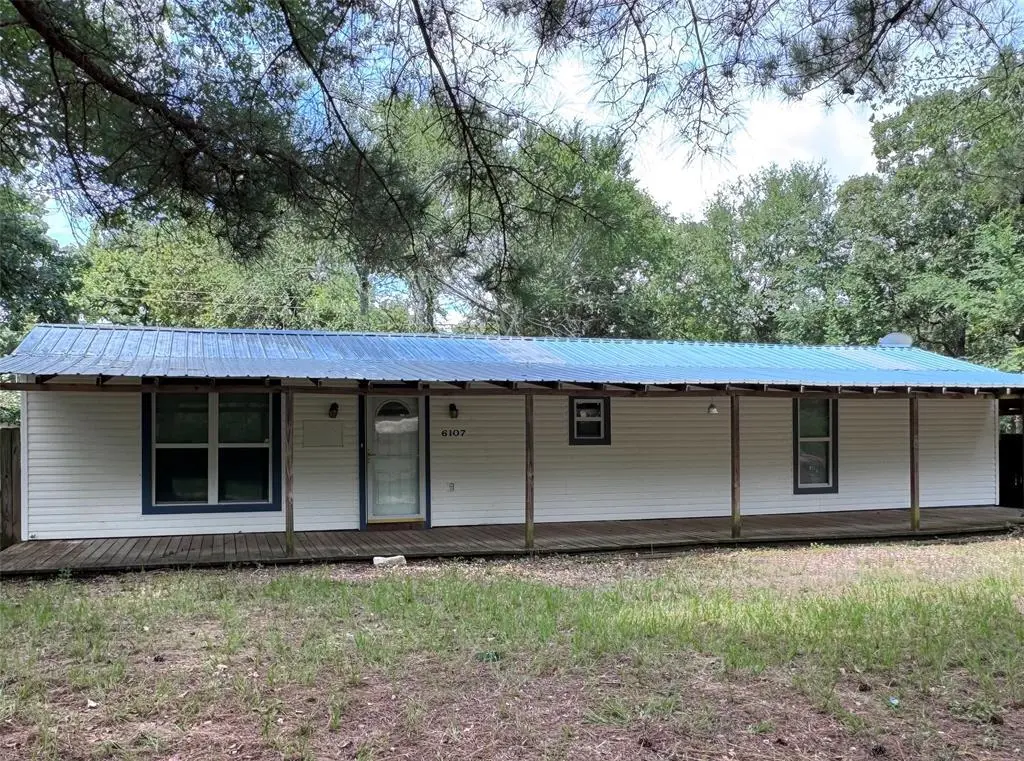
* * * JUST LISTED * * * This beautiful home on THREE LOTS (one-third acre) in Indian Harbor is affordably priced under $50,000! There are two separate parcel numbers. Surrounded by big beautiful trees. Has all appliances, but it needs flooring, etc. Stainless steel fridge, dishwasher, stove, built-in microwave. Clothes washer and dryer. This is * not * a mobile or manufactured home -- it was site built. NICE metal roof! Two storage sheds, wooden privacy fence, huge covered patio on front and back. Hurry! Indian Harbor Property Owner's Association includes two private boat ramps, dock, park with picnic tables and a million dollar lake front, trash service, etc. More photos coming soon.
Key facts
- Two storage sheds
- 0.24 acre lot
- Parking
Tags
Property features AI
Finance
- Other: Multiple parcel IDs on property; Access: cash, conventional, FHA, VA financing accepted
- HOA & community: Mandatory association (Indian Harbor); Association fee $126 annually; Association includes full use of facilities and grounds maintenance; Community features: boat ramp, community dock, park
Exterior
- Parking: Carport (1 covered/unpaved space); No garage spaces
- Security: Security system; Smoke detector(s)
- Utilities: City sewer; Co-op water; Not in a municipal utility district
- Home design: Single family residence; One story; Residential property; Year built 2000; Property not attached
- Construction: Siding construction; Metal roof; Slab foundation
- Exterior features: Covered porch(es); Covered patio/porch; Fire pit; Storage; Wood fencing; Interior lot with many trees
Interior
- Kitchen: Gas range; Microwave; Refrigerator; Kitchen included in 3-room count
- Bedrooms: 1 bedroom (on main level)
- Bathrooms: 1 full bathroom
- Heating & cooling: Cooling: Other
- Interior features: Cable TV available; Window coverings
- Laundry & utility: Washer; Dryer
Neighborhood map
What this means for you Summary
Snapshot
- This is a 1-bed/1.0-bath single-family listed at $100k.
Deal economics
- At list price, monthly cash flow is $157 ($2k/yr) — positive.
- The deal already cash-flows at list — no discount required.
- Meets the 1% rule at list price ($1k rent vs $100k).
- Cap rate 8.2% vs local median 2.2% in Enchanted Oaks — top-decile yield for the area; either an underpriced asset or a hidden risk that comps aren't pricing in. Stress-test before assuming the spread holds.
Location & tenants
- Location reads 60/100 on livability (#1,103 in TX) — a middle-class / working-renter tenant base. Strengths: cost of living A+, crime A, housing A; Watch: schools F, amenities F, commute F.
- Eustace ISD (rural): math 32% / reading 45% proficiency, ranked #455 of 826 in TX (top 55%) — families likely to look elsewhere, expect single-tenant / working-renter base with shorter leases; 62% free/reduced lunch — lower-income household profile, screen leases tightly.
- Market conditions: Rents falling (-5.8%/yr); 694 active listings in the ZIP; 263 units permitted in Henderson County in 2024 (0 in 5+ unit buildings).
Forward outlook
- Local home prices are declining (-3.0%/yr); year-one equity from $691 of loan paydown is wiped out by about $3k of value loss. Plan a longer hold.
Negotiation context
- Only 14 days on market — expect competitive offers; lowballing is unlikely to land.
- 3 sale attempts since 7y ago with the ask held roughly flat each time — persistent listings suggest the price (not the market) is what's stuck; bring a comps-based counter.
Risks & watch-outs
- Climate carrying-cost: major wind risk, 62% chance of damaging wind over 30y; extreme-heat days projected 7→26/yr by 2055 (HVAC capex compounding) — expect insurance premiums to compound above CPI over the hold.
Questions for the listing agent
- What does the HOA fee cover, when was the last increase, and are there any pending special assessments or reserve-fund shortfalls?
- Is there a deadline driving the sale (1031 exchange, divorce, estate, relocation)? That informs how much negotiation room exists.
- Schools are F-rated, which usually means shorter tenancies and higher turnover. Who's the typical renter profile here, and what's been the actual vacancy rate?
- This sits on a lake — are riparian / water-frontage rights deeded with the parcel? Any dock permits, shoreline easements, or HOA water-use restrictions?
- What's the documented flood / surge / shoreline-erosion history here (FEMA AND non-FEMA — e.g., storm surge, creek backup, septic-field saturation)?
- Any water-quality or seasonal algae-bloom issues that affect tenant satisfaction or short-term-rental demand?
- What's the average days-on-market for RENTAL listings here right now (not sales)? A rising rental-DOM trend means longer vacancies and softer asking-rent achievability than the comps imply.
- What's the recent tenant-quality profile in this submarket — average credit score on applications, eviction rate, late-payment / NSF rate, and stable-employment percentage? A property-management company in the area should have these aggregated.
- How much new for-sale + rental construction is in the pipeline within 1–3 miles? Heavy new supply typically softens prices + rents 12–24 months out; constrained supply supports both.
Investment metrics
- 1% rule
- 1.10% ✓
- Cap rate
- 8.17%
- Cash-on-cash
- 6.72%
- DSCR
- 1.30
- GRM
- 7.6
CMA / ARV
No comps found within radius.
Projected returns pro-forma
-3.0% appreciation · 0.0% rent growth · sell at horizon
- IRR
- -9.5%
- Equity multiple
- 0.66×
- Total profit
- $-9,409
- Equity at exit
- $14,910
- IRR
- -4.8%
- Equity multiple
- 0.73×
- Total profit
- $-7,656
- Equity at exit
- $8,646
Cash invested: $28,000 (down + closing). Projections, not guarantees.
Landlord ↔ Tenant lean methodology
- Overall (STATE)
- 87 Strongly Landlord-Friendly
- State Texas
- 87 Strongly Landlord-Friendly · R+5
- County
- — inherits STATE
- City
- — inherits STATE
ZIP-level market 75156
- Rents YoY
- -5.8%
- Active inventory
- 694
- Price-to-rent
- 7.6×
Monthly cashflow live
- Estimated rent
- $1,098 medium interval (Pro) →
- Mortgage (P&I)
- −$524
- Tax from tax record
- −$134 /mo · $1,603/yr
- Insurance
- −$42
- HOA
- −$11
- Vacancy / Maint / Mgmt
- −$231
- Net cashflow
- $157
Break-even live
UW: 25.0% down · 7.5% · 30yr · 1.5% tax · 5.0% vac · 8.0% maint · 8.0% mgmt
Financing live
Cash to close
- Down payment
- $25,000
- Closing costs
- $3,000
- Reserves months
- —
- Total cash needed
- —
Loan-product check · same deal, 3 products live
Conventional
25% down · 7.5% · 30yr
- Down + closing
- —
- Monthly P&I
- —
- Monthly cashflow
- —
- DSCR
- —
- Eligible?
- —
Personal DTI + credit; lowest rate.
DSCR
20% down · 8.5% · 30yr
- Down + closing
- —
- Monthly P&I
- —
- Monthly cashflow
- —
- DSCR
- —
- Eligible?
- —
No personal income docs; deal must DSCR.
Hard money
10% down · 12.0% · 12mo
- Down + closing
- —
- Monthly P&I
- —
- Monthly cashflow
- —
- DSCR
- —
- Eligible?
- —
Short-term bridge; refi at stabilization.
HOA detail
- Monthly dues
- $11 · $132/yr
- Likely covers
- trash
Listing history 11 events
-
2026-06-19days on market $100,000 Active 14 DOM
-
2026-06-18days on market $100,000 Active 13 DOM
-
2026-06-17days on market $100,000 Active 12 DOM
-
2026-06-16days on market $100,000 Active 11 DOM
-
2026-06-15days on market $100,000 Active 10 DOM
-
2026-06-14days on market $100,000 Active 8 DOM
-
2026-06-12days on market $100,000 Active 7 DOM
-
2026-06-09days on market $100,000 Active 4 DOM
-
2026-06-08days on market $100,000 Active 3 DOM
-
2026-06-07remarks 699-char remark
-
2026-06-07$100,000 Active 2 DOM
ⓘ Source: listings_history table (triggers on properties + properties_extension) + one-shot
backfill from property_details.listing_events for pre-trigger history.
Tax reassessment forecast TX · Resets to sale price
- Current annual tax
- $1,603 · $134/mo
- Projected year-2 tax
- $1,830 · $152/mo
- Expected delta
- +$227/yr (+$19/mo · 14.2%)
ⓘ Screening estimate from a state-policy table — verify with the county assessor before closing.
Climate risk First Street
- Flood 1/10 Low FEMA zone X (unshaded) · 0% chance over 30 yrs
- Wildfire 3/10 Moderate
- Heat 7/10 Severe 7 d/yr ≥109°F today · 26 d/yr by 30 yrs out
- Wind 6/10 Major 62% chance of damaging wind over 30 yrs
- Air quality 2/10 Low 0 unhealthy d/yr today · 1 by 30 yrs out
Nearby sold comps map
Loading sold comps map…
Walkable amenities ~0.75 mi
Loading nearby amenities…
Taxation est. · year 1
- Rental income
- $13,176
- − Mortgage interest
- −$5,602
- − Property taxes
- −$1,603
- − Insurance
- −$500
- − Repairs & maintenance
- −$1,054
- − Management
- −$1,054
- − HOA
- −$132
- − Depreciation
- −$2,909
- Taxable income
- $322
- Est. tax owed @ 24.0%
- −$77
- After-tax cash flow
- $1,804/yr
For passive investors: Depreciation is non-cash, so a rental often shows a tax loss while cash-flowing — sheltering income. Rental losses are passive: they offset passive income freely, and up to $25,000/yr can offset ordinary (W-2) income if you actively participate and your MAGI is under $100k (phasing out to $0 by $150k); unused losses carry forward. On sale, claimed depreciation is recaptured at up to 25%, and gains may owe capital-gains tax (a 1031 exchange can defer both). Figures are a year-1 estimate at your 24.0% rate — not tax advice; consult a CPA.
Schools (NCES district)
- District
- Eustace ISD
- NCES district ID
- 4818720
- Math proficiency
- 32% ▼ -18.00%
- Reading proficiency
- 45% ▼ -7.00%
- Median HH income
- $42,425
- Composite
- 32.48/100
- National rank
- #5711
- State rank
- #455 of 826 in TX
Livability — Enchanted Oaks
- Score
- 60/100
- State rank
- #1103
- US rank
- #19536
Category grades
Schools grade is shown separately in the Schools card above.
Census & demographics
- County
- Henderson County · 34,977 people
- Metro
- Athens, TX
- Population (ZIP)
- 16,333
- Household income
- $60,867
- Rent vs Own
- Severe rent burden
- 400.0
Population outlook (Henderson County) Hauer SSP2
- Today (2025)
- 80,471 people
- By 2030
- 80,608 · +0.2%
- By 2040
- 80,087 · -0.5%
- By 2050
- 78,208 · -2.8%
- By 2075
- 72,423 · -10.0%
- By 2100
- 61,012 · -24.2%
Race, ethnicity, and origin ACS 2023
- Neighborhood character
- Predominantly White (85%)
- Race & ethnicity
- White 85% Hispanic / Latino 7% Two or more races 7% Black 1%
- Hispanic origin (detail)
- Mexican 5%
- Common ancestry
- Slovak 3% Serbian 2% European 2%
- Foreign-born
- 4% · Canada, Jamaica
- Languages at home
- 94% English-only · Spanish 4% Other Indo-European 1%
Political lean MEDSL · Henderson
- 2024 margin
- Solid R (+63.5) · D 18.0% · R 81.4%
- 2008→2024 swing
- -18.8pp toward R · 2008: -44.6pp · 2024: -63.5pp
- All cycles
- 2024: R+63.5 2020: R+60.2 2016: R+60.0 2012: R+54.8 2008: R+44.6
Not yet ingested
- Civics
- —
Market trends
- HPI YoY
- ▼ -216.77%
- Current HPI
- 199.8108
- Rent YoY
- ▼ -5.76%
- Metro
- Athens, TX
- State GDP YoY
- ▲ 3.95%
- F500 in state
- 110
Industry mix (Fortune 500 HQ in TX)
| Industry | F500 HQs | Revenue |
|---|---|---|
| Energy | 16 | $1,198B |
|
||
| Technology | 5 | $198B |
|
||
| Engineering / Construction | 4 | $72B |
|
||
| Energy Services | 3 | $60B |
|
||
| Utilities | 3 | $41B |
|
||
| Healthcare | 2 | $330B |
|
||
Price history
+100.4% since first listed14 events — show timeline
- 2026-06-03 Listed $100,000 NTREIS
- 2020-03-04 Listing Removed — NTREIS
- 2020-02-28 Listed $79,900 NTREIS
- 2020-01-14 Sold (MLS) — NTREIS
- 2019-12-23 Pending — NTREIS
- 2019-12-06 Contingent — NTREIS
- 2019-12-03 Price Changed $39,900 NTREIS
- 2019-11-23 Price Changed $41,900 NTREIS
- 2019-11-12 Price Changed $44,900 NTREIS
- 2019-10-28 Listed $49,900 NTREIS
- 2008-02-27 Sold (Public Records) — Public Records
- 2002-10-21 Sold (Public Records) — Public Records
- 2002-04-04 Sold (Public Records) — Public Records
- 1999-06-25 Sold (Public Records) — Public Records
Property tax history
+12.0%/yrLatest (2025): $1,603 · +4.2% YoY. Source: county tax records.
Cash-flow waterfall
monthlySold comps — $/sqft
last 12 mo · ≤1 miLoading sold comps…